
Subtropics: Difference between revisions
No edit summary |
Undid revision 398532127 by 65.93.4.78 (talk) |
||
| Line 6: | Line 6: | ||
[[File:Jardim do Campo Grande.jpg|thumb|300px|right|Campo Grande Garden in [[Lisbon]], [[Portugal]], European Union (Europe)]] |
[[File:Jardim do Campo Grande.jpg|thumb|300px|right|Campo Grande Garden in [[Lisbon]], [[Portugal]], European Union (Europe)]] |
||
[[File:Vallettaupperbarraccagardens.JPG|thumb|300px|right|Upper Barracca Gardens im [[Malta]], European Union (centrally in the Mediterranean Sea, between Europe, Africa and Asia)]] |
[[File:Vallettaupperbarraccagardens.JPG|thumb|300px|right|Upper Barracca Gardens im [[Malta]], European Union (centrally in the Mediterranean Sea, between Europe, Africa and Asia)]] |
||
[[Image:[http://www.facebook.com/photo.php?pid=6137772&l=99b1fb2d5b&id=501861550 Palm trees in southern Ontario, Canada.]]] |
|||
[[Image:Parc de la Ligue Arabe, Casablanca.jpg|thumb|300px|right|Parc de la Ligue Arabe in [[Casablanca]], [[Morocco]] (Africa)]] |
[[Image:Parc de la Ligue Arabe, Casablanca.jpg|thumb|300px|right|Parc de la Ligue Arabe in [[Casablanca]], [[Morocco]] (Africa)]] |
||
[[Image:Alicestreet.jpg|thumb|300px|right|City Botanical Garden in [[Brisbane]], [[Australia]]]] |
[[Image:Alicestreet.jpg|thumb|300px|right|City Botanical Garden in [[Brisbane]], [[Australia]]]] |
||
| Line 84: | Line 83: | ||
|clear = none |
|clear = none |
||
|source = [http://cdo.ncdc.noaa.gov/climatenormals/clim20/ca/045115.pdf NOAA] |
|source = [http://cdo.ncdc.noaa.gov/climatenormals/clim20/ca/045115.pdf NOAA] |
||
}} |
|||
{{climate chart |
|||
| [[Pelee Island, Canada]] |
|||
| 6.2 | 15.1 | 84.6 |
|||
| 10.2 | 15.9 | 93.5 |
|||
| 10.9 | 19.0 | 79.8 |
|||
| 12.4 | 22.8 | 21.1 |
|||
| 14.4 | 23.8 | 7.9 |
|||
| 16.3 | 26.4 | 1.5 |
|||
| 18.1 | 28.8 | .3 |
|||
| 18.7 | 29.3 | 3.3 |
|||
| 18.1 | 28.5 | 8.1 |
|||
| 15.5 | 26.1 | 9.4 |
|||
| 11.4 | 22.9 | 26.7 |
|||
| 8.2 | 20.4 | 48.5 |
|||
|float = left |
|||
|clear = none |
|||
|source = [http://www.weather.ca] |
|||
}} |
}} |
||
{{climate chart |
{{climate chart |
||
Revision as of 22:35, 25 November 2010
This article needs additional citations for verification. (September 2010) |


The subtropics are the geographical and climatical zone of the Earth immediately north and south of the tropical zone, which is bounded by the Tropic of Cancer and the Tropic of Capricorn, at latitudes 23.5°N and 23.5°S. The term "subtropical" describes the climatic region found adjacent to the tropics, usually between 20 and 40 degrees of latitude in both hemispheres.
Definition
According to climatologist Glenn G. Trewartha, a subtropical region should have at least eight months with a mean temperature of 10 °C (50.0 °F) or above. His revision of Köppen climate classification assigns to such areas the letter C, while others zones encompassed in the original Köppen group C class would be considered part of group.
American climatologist John F. Griffiths in his book Applied climatology described the subtropical zone as having a coldest month of between 6 °C (42.8 °F) and 18 °C (64.4 °F) and assigning to this group the letter B, while the original B group of Köppen taxonomy would be spread over the various temperature-based groups.
German climatologists Carl Troll and Karlheinz Paffen defined warmgemäßigte Zonen ("Warm temperate zones") plain and hilly lands having an average temperature of the coldest month between 2 °C (35.6 °F) and 13 °C (55.4 °F) in Northern Hemisphere and between 6 °C (42.8 °F) and 13 °C (55.4 °F) in Southern Hemisphere, excluding oceanic and continental climates.
Characteristics
In subtropical climates the winters are relatively warm, but not as hot as the summer season. These climates rarely—if ever—see frost or snow, and plants such as palm, citrus and many broadleaf evergreens flourish, in contrast to the hardier deciduous and coniferous trees which dominate midlatitude climates. As one moves toward the tropical side the slight winter cool season disappears altogether, while at the poleward threshold of the subtropics the winters become much cooler.
Rainfall patterns vary widely throughout the subtropics including hot deserts, savannas, monsoon forests, humid forests and the warmer parts of the Mediterranean climate zone. Subtropical regions include most of California and southern Europe (Mediterranean or dry-summer subtropical climate), the low deserts of the Southwest USA (hot arid type), the Gulf Coast and most of Florida (humid subtropical climate), northern India (monsoon), southeast China (humid), the middle part of South America (varied), much of Australia (varied) and coastal South Africa. Even the Isles of Scilly meet both requirements— 6 °C (42.8 °F) average in the coldest month and eight months with the average above 10 °C (50.0 °F) . Plymouth in Devon just meets the John F. Griffiths' requirement for a subtropical climate — average 3 °C (37.4 °F) min and 9 °C (48.2 °F) max in the coldest month.
Subtropical areas
Examples of subtropical cities and areas around the world include (see map above for more details):
- In Africa
- North Africa: Algiers, Algeria; Alexandria, Egypt; Casablanca, Morocco; Tripoli, Libya; Tunis, Tunisia;
- Southern Africa: Cape Town, Durban and East London, South Africa; Maseru, Lesotho and Natal, South Africa.
- The part of Atlantic Ocean, areas on the islands of European Union around the coast of Africa: Las Palmas, Spain; Funchal, Portugal.
- In The Americas
- The United States: Atlanta; Austin; Birmingham; Charleston, South Carolina; Charlotte; Dallas; Houston; Jacksonville, Florida; Las Vegas; Los Angeles; Little Rock; Memphis; Nashville; New Orleans; Norfolk, Virginia; Phoenix; Raleigh; Sacramento, California ;San Antonio; San Diego; San Jose; San Francisco Bay Area; Savannah; Tampa; and Tucson, Arizona
- Mexico: Monterrey, Hermosillo, Cd. Juárez, Tijuana.
- Brazil: São Paulo, Santa Catarina, Rio Grande do Sul, Paraná, Mato Grosso do Sul.
- Latin America: Buenos Aires, Argentina; Montevideo, Uruguay; Santiago, Chile; Valparaiso, Chile; Lima, Perú; and Asuncion, Paraguay.
- In Eurasia
- Mainland China: Nanjing, Shanghai, Hangzhou, Xiamen, Shenzhen, Guangzhou, Nanning, Changsha, Wuhan, Chongqing, Chengdu [1]
- Hong Kong
- Macau
- Taiwan: Taipei
- Japan: Shikoku, Kyushu, Okinawa, Western Honshu
- European Union: Inland areas around the Mediterranean Sea including a major part of the Iberian Peninsula, Apennine Peninsula and Balkan Peninsula. Major metropolises (urban area of range from 2.4 to 5.4 million people): Lisbon; Barcelona; Madrid; Rome; Naples; Milan; Athens. Some examples of other larger cities (urban area above 0.5 million people): Malaga; Valencia; Porto; Marseilles; Nice. Other places: Malta and Gibraltar with English as official language.
- Georgia: Batumi.
- India: Amritsar, and New Delhi.
- Russia: Sochi, Tuapse, Gelendzhik.
- Philippines: Baguio, Batanes.
- Turkey: Adana, Antalya, Izmir, Mersin.
- The Middle East: Iran, Persian Gulf; Baghdad, Iraq; Pakistan; Jerusalem, Israel; Riyadh, Saudi Arabia; Tel Aviv, Israel; Beirut, Lebanon and Latakia, Syria.
- Vietnam: Hanoi, Hai Phong, Da Lat.
- In Oceania
- Australia: New South Wales, Northern Territory, Queensland, Western Australia, South Australia and parts of Victoria (Australia)
- New Zealand: Auckland, Northland, Coromandel, East Cape and Wellington.
This list is incomplete; you can help by adding missing items. |
Subtropical flora
-
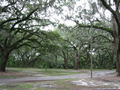 Savannah, Georgia: Live oak with spanish moss. This is a typical scene in the subtropical region of the eastern and southern USA as far west as eastern Texas.
 -
 Curitiba: Live oak with araucarias. This is a typical scene in the subtropical region of the southern Brazil.


Charts of selected cities with subtropical climates
| Los Angeles | ||||||||||||||||||||||||||||||||||||||||||||||||||||||||||||
|---|---|---|---|---|---|---|---|---|---|---|---|---|---|---|---|---|---|---|---|---|---|---|---|---|---|---|---|---|---|---|---|---|---|---|---|---|---|---|---|---|---|---|---|---|---|---|---|---|---|---|---|---|---|---|---|---|---|---|---|---|
| Climate chart (explanation) | ||||||||||||||||||||||||||||||||||||||||||||||||||||||||||||
| ||||||||||||||||||||||||||||||||||||||||||||||||||||||||||||
| ||||||||||||||||||||||||||||||||||||||||||||||||||||||||||||
| Atlanta | ||||||||||||||||||||||||||||||||||||||||||||||||||||||||||||
|---|---|---|---|---|---|---|---|---|---|---|---|---|---|---|---|---|---|---|---|---|---|---|---|---|---|---|---|---|---|---|---|---|---|---|---|---|---|---|---|---|---|---|---|---|---|---|---|---|---|---|---|---|---|---|---|---|---|---|---|---|
| Climate chart (explanation) | ||||||||||||||||||||||||||||||||||||||||||||||||||||||||||||
| ||||||||||||||||||||||||||||||||||||||||||||||||||||||||||||
| ||||||||||||||||||||||||||||||||||||||||||||||||||||||||||||
| Santiago de Chile | ||||||||||||||||||||||||||||||||||||||||||||||||||||||||||||
|---|---|---|---|---|---|---|---|---|---|---|---|---|---|---|---|---|---|---|---|---|---|---|---|---|---|---|---|---|---|---|---|---|---|---|---|---|---|---|---|---|---|---|---|---|---|---|---|---|---|---|---|---|---|---|---|---|---|---|---|---|
| Climate chart (explanation) | ||||||||||||||||||||||||||||||||||||||||||||||||||||||||||||
| ||||||||||||||||||||||||||||||||||||||||||||||||||||||||||||
| ||||||||||||||||||||||||||||||||||||||||||||||||||||||||||||
| São Paulo | ||||||||||||||||||||||||||||||||||||||||||||||||||||||||||||
|---|---|---|---|---|---|---|---|---|---|---|---|---|---|---|---|---|---|---|---|---|---|---|---|---|---|---|---|---|---|---|---|---|---|---|---|---|---|---|---|---|---|---|---|---|---|---|---|---|---|---|---|---|---|---|---|---|---|---|---|---|
| Climate chart (explanation) | ||||||||||||||||||||||||||||||||||||||||||||||||||||||||||||
| ||||||||||||||||||||||||||||||||||||||||||||||||||||||||||||
| ||||||||||||||||||||||||||||||||||||||||||||||||||||||||||||
| Rome | ||||||||||||||||||||||||||||||||||||||||||||||||||||||||||||
|---|---|---|---|---|---|---|---|---|---|---|---|---|---|---|---|---|---|---|---|---|---|---|---|---|---|---|---|---|---|---|---|---|---|---|---|---|---|---|---|---|---|---|---|---|---|---|---|---|---|---|---|---|---|---|---|---|---|---|---|---|
| Climate chart (explanation) | ||||||||||||||||||||||||||||||||||||||||||||||||||||||||||||
| ||||||||||||||||||||||||||||||||||||||||||||||||||||||||||||
| ||||||||||||||||||||||||||||||||||||||||||||||||||||||||||||
| Cairo | ||||||||||||||||||||||||||||||||||||||||||||||||||||||||||||
|---|---|---|---|---|---|---|---|---|---|---|---|---|---|---|---|---|---|---|---|---|---|---|---|---|---|---|---|---|---|---|---|---|---|---|---|---|---|---|---|---|---|---|---|---|---|---|---|---|---|---|---|---|---|---|---|---|---|---|---|---|
| Climate chart (explanation) | ||||||||||||||||||||||||||||||||||||||||||||||||||||||||||||
| ||||||||||||||||||||||||||||||||||||||||||||||||||||||||||||
| ||||||||||||||||||||||||||||||||||||||||||||||||||||||||||||
| Cape Town | ||||||||||||||||||||||||||||||||||||||||||||||||||||||||||||
|---|---|---|---|---|---|---|---|---|---|---|---|---|---|---|---|---|---|---|---|---|---|---|---|---|---|---|---|---|---|---|---|---|---|---|---|---|---|---|---|---|---|---|---|---|---|---|---|---|---|---|---|---|---|---|---|---|---|---|---|---|
| Climate chart (explanation) | ||||||||||||||||||||||||||||||||||||||||||||||||||||||||||||
| ||||||||||||||||||||||||||||||||||||||||||||||||||||||||||||
| ||||||||||||||||||||||||||||||||||||||||||||||||||||||||||||
| New Delhi | ||||||||||||||||||||||||||||||||||||||||||||||||||||||||||||
|---|---|---|---|---|---|---|---|---|---|---|---|---|---|---|---|---|---|---|---|---|---|---|---|---|---|---|---|---|---|---|---|---|---|---|---|---|---|---|---|---|---|---|---|---|---|---|---|---|---|---|---|---|---|---|---|---|---|---|---|---|
| Climate chart (explanation) | ||||||||||||||||||||||||||||||||||||||||||||||||||||||||||||
| ||||||||||||||||||||||||||||||||||||||||||||||||||||||||||||
| ||||||||||||||||||||||||||||||||||||||||||||||||||||||||||||
| Hong Kong | ||||||||||||||||||||||||||||||||||||||||||||||||||||||||||||
|---|---|---|---|---|---|---|---|---|---|---|---|---|---|---|---|---|---|---|---|---|---|---|---|---|---|---|---|---|---|---|---|---|---|---|---|---|---|---|---|---|---|---|---|---|---|---|---|---|---|---|---|---|---|---|---|---|---|---|---|---|
| Climate chart (explanation) | ||||||||||||||||||||||||||||||||||||||||||||||||||||||||||||
| ||||||||||||||||||||||||||||||||||||||||||||||||||||||||||||
| ||||||||||||||||||||||||||||||||||||||||||||||||||||||||||||
See also
References
External links
- Study Shows Ocean “Deserts” are Expanding from NOAA, March 5, 2008
- Expanding tropics 'a threat to millions' from The Independent, Dec. 3, 2007