
Châtenay, Isère
Châtenay | |
|---|---|
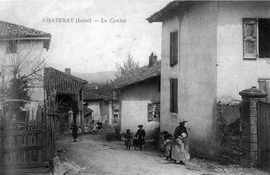 The centre of Châtenay in 1920 | |
Location of Châtenay  | |
 Châtenay  Châtenay | |
| Coordinates: 45°19′18″N 5°13′48″E / 45.3217°N 5.23°E | |
| Country | France |
| Region | Auvergne-Rhône-Alpes |
| Department | Isère |
| Arrondissement | Vienne |
| Canton | Bièvre |
| Government | |
| • Mayor (2014–2020) | Pierre Tortosa |
| Area 1 | 4.62 km2 (1.78 sq mi) |
| Population (2021)[1] | 434 |
| • Density | 94/km2 (240/sq mi) |
| Time zone | UTC+01:00 (CET) |
| • Summer (DST) | UTC+02:00 (CEST) |
| INSEE/Postal code | 38093 /38980 |
| Elevation | 324–548 m (1,063–1,798 ft) (avg. 385 m or 1,263 ft) |
| 1 French Land Register data, which excludes lakes, ponds, glaciers > 1 km2 (0.386 sq mi or 247 acres) and river estuaries. | |
Châtenay is a commune in the Isère department in southeastern France.
Population
| Year | Pop. | ±% |
|---|---|---|
| 1800 | 450 | — |
| 1821 | 484 | +7.6% |
| 1831 | 592 | +22.3% |
| 1841 | 536 | −9.5% |
| 1851 | 507 | −5.4% |
| 1861 | 479 | −5.5% |
| 1872 | 448 | −6.5% |
| 1881 | 424 | −5.4% |
| 1891 | 443 | +4.5% |
| 1901 | 410 | −7.4% |
| 1911 | 400 | −2.4% |
| 1921 | 337 | −15.7% |
| 1931 | 302 | −10.4% |
| 1946 | 275 | −8.9% |
| 1954 | 283 | +2.9% |
| 1962 | 251 | −11.3% |
| 1968 | 266 | +6.0% |
| 1975 | 277 | +4.1% |
| 1982 | 301 | +8.7% |
| 1990 | 281 | −6.6% |
| 1999 | 303 | +7.8% |
| 2011 | 436 | +43.9% |
See also
References
- ^ "Populations légales 2021" (in French). The National Institute of Statistics and Economic Studies. 28 December 2023.
Wikimedia Commons has media related to Châtenay (Isère).
This Isère geographical article is a stub. You can help Wikipedia by expanding it. |