Amarillo metropolitan area: Difference between revisions
Magioladitis (talk | contribs) m clean up using AWB (12084) |
Rescuing 1 sources and tagging 0 as dead. #IABot (v1.2.4) |
||
| Line 38: | Line 38: | ||
==Demographics== |
==Demographics== |
||
As of the [[census]]<ref name="GR2">{{cite web|url=http://factfinder2.census.gov|publisher=[[United States Census Bureau]]|accessdate=2008-01-31|title=American FactFinder}}</ref> of 2000, there were 226,522 people, 85,272 households, and 58,753 families residing within the MSA. The racial makeup of the MSA was 79.64% [[White (U.S. Census)|White]], 5.70% [[African American (U.S. Census)|African American]], 0.77% [[Native American (U.S. Census)|Native American]], 1.73% [[Asian (U.S. Census)|Asian]], 0.03% [[Pacific Islander (U.S. Census)|Pacific Islander]], 10.02% from [[Race (United States Census)|other races]], and 2.11% from two or more races. [[Hispanic (U.S. Census)|Hispanic]] or [[Latino (U.S. Census)|Latino]] of any race were 19.08% of the population. |
As of the [[census]]<ref name="GR2">{{cite web|url=http://factfinder2.census.gov |publisher=[[United States Census Bureau]] |accessdate=2008-01-31 |title=American FactFinder |deadurl=yes |archiveurl=https://web.archive.org/web/20130911234518/http://factfinder2.census.gov |archivedate=2013-09-11 |df= }}</ref> of 2000, there were 226,522 people, 85,272 households, and 58,753 families residing within the MSA. The racial makeup of the MSA was 79.64% [[White (U.S. Census)|White]], 5.70% [[African American (U.S. Census)|African American]], 0.77% [[Native American (U.S. Census)|Native American]], 1.73% [[Asian (U.S. Census)|Asian]], 0.03% [[Pacific Islander (U.S. Census)|Pacific Islander]], 10.02% from [[Race (United States Census)|other races]], and 2.11% from two or more races. [[Hispanic (U.S. Census)|Hispanic]] or [[Latino (U.S. Census)|Latino]] of any race were 19.08% of the population. |
||
The median income for a household in the MSA was $37,671 and the median income for a family was $44,696. Males had a median income of $31,710 versus $22,686 for females. The [[per capita income]] for the MSA was $18,327. |
The median income for a household in the MSA was $37,671 and the median income for a family was $44,696. Males had a median income of $31,710 versus $22,686 for females. The [[per capita income]] for the MSA was $18,327. |
||
Revision as of 23:30, 10 October 2016

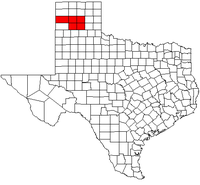
The Amarillo Metropolitan Statistical Area is a metropolitan area in the Texas Panhandle that covers four counties - Armstrong, Carson, Potter, and Randall. As of the 2010 census, the MSA had a population of 249,881 (though a July 1, 2011 estimate placed the population at 253,823).[1]
Counties
Communities
Places with more than 15,000 people
- Amarillo (Principal city)
Places with 1,000 to 15,000 people
Places with 500 to 1,000 people
- Groom
- Happy (partial)
- Lake Tanglewood
- Skellytown
Places with fewer than 500 people
Unincorporated places
Demographics
As of the census[2] of 2000, there were 226,522 people, 85,272 households, and 58,753 families residing within the MSA. The racial makeup of the MSA was 79.64% White, 5.70% African American, 0.77% Native American, 1.73% Asian, 0.03% Pacific Islander, 10.02% from other races, and 2.11% from two or more races. Hispanic or Latino of any race were 19.08% of the population.
The median income for a household in the MSA was $37,671 and the median income for a family was $44,696. Males had a median income of $31,710 versus $22,686 for females. The per capita income for the MSA was $18,327.
See also
- List of cities in Texas
- List of museums in the Texas Panhandle
- Texas census statistical areas
- List of Texas metropolitan areas
References
- ^ "Metropolitan and Micropolitan Statistical Areas". 2011 Population Estimates. United States Census Bureau, Population Division. July 1, 2011. Retrieved November 26, 2012.
- ^ "American FactFinder". United States Census Bureau. Archived from the original on 2013-09-11. Retrieved 2008-01-31.
{{cite web}}: Unknown parameter|deadurl=ignored (|url-status=suggested) (help)


