
Marshall County, West Virginia
Marshall County | |
|---|---|
 Marshall County Courthouse | |
 Location within the U.S. state of West Virginia | |
 West Virginia's location within the U.S. | |
| Coordinates: 39°52′N 80°40′W / 39.87°N 80.67°W | |
| Country | |
| State | |
| Founded | March 12, 1835 |
| Seat | Moundsville |
| Largest city | Moundsville |
| Area | |
| • Total | 312 sq mi (810 km2) |
| • Land | 305 sq mi (790 km2) |
| • Water | 6.7 sq mi (17 km2) 2.2% |
| Population | |
| • Estimate (2015) | 31,978 |
| • Density | 106/sq mi (41/km2) |
| Time zone | UTC−5 (Eastern) |
| • Summer (DST) | UTC−4 (EDT) |
| Congressional district | 1st |
| Website | www |
Marshall County is a county in the U.S. state of West Virginia. At the 2010 census, the population was 33,107.[1] Its county seat is Moundsville.[2] With its southern border at the Mason-Dixon line, it forms the base of the Northern Panhandle of West Virginia.
Marshall County is part of the Wheeling, WV-OH Metropolitan Statistical Area.
Marshall County is home to the largest conical burial mound in North America, at Moundsville.[3] Marshall County was formed in 1835[4] from Ohio County by act of the Virginia Assembly. In 1852, on Christmas Eve, workers completed the Baltimore & Ohio railroad at Rosby's Rock in Marshall County.[5] It is home to the New Vrindaban community of Hare Krishnas, and Prabhupada's Palace of Gold.
History
It was named in honor of John Marshall, Chief Justice of the United States Supreme Court, who died in 1835.[6]
Geography
According to the U.S. Census Bureau, the county has a total area of 312 square miles (810 km2), of which 305 square miles (790 km2) is land and 6.7 square miles (17 km2) (2.2%) is water.[7]
Major Highways
 U.S. Highway 250
 West Virginia Route 2
 West Virginia Route 86
 West Virginia Route 88
 West Virginia Route 891
Adjacent Counties
- Ohio County (north)
- Washington County, Pennsylvania (northeast)
- Greene County, Pennsylvania (east)
- Wetzel County (south)
- Monroe County, Ohio (southwest)
- Belmont County, Ohio (northwest)
National protected area
Demographics
| Census | Pop. | Note | %± |
|---|---|---|---|
| 1840 | 6,937 | — | |
| 1850 | 10,138 | 46.1% | |
| 1860 | 12,997 | 28.2% | |
| 1870 | 14,941 | 15.0% | |
| 1880 | 18,840 | 26.1% | |
| 1890 | 20,735 | 10.1% | |
| 1900 | 26,444 | 27.5% | |
| 1910 | 32,388 | 22.5% | |
| 1920 | 33,681 | 4.0% | |
| 1930 | 39,831 | 18.3% | |
| 1940 | 40,189 | 0.9% | |
| 1950 | 36,893 | −8.2% | |
| 1960 | 38,041 | 3.1% | |
| 1970 | 37,598 | −1.2% | |
| 1980 | 41,608 | 10.7% | |
| 1990 | 37,356 | −10.2% | |
| 2000 | 35,519 | −4.9% | |
| 2010 | 33,107 | −6.8% | |
| 2016 (est.) | 31,793 | [8] | −4.0% |
| U.S. Decennial Census[9] 1790–1960[10] 1900–1990[11] 1990–2000[12] 2010–2015[1] | |||
2000 census
At the census[13] of 2000, there were 35,519 people, 14,207 households, and 10,101 families residing in the county. The population density was 116 people per square mile (45/km²). There were 15,814 housing units at an average density of 52 per square mile (20/km²). The racial makeup of the county was 98.40% White, 0.43% Black or African American, 0.11% Native American, 0.25% Asian, 0.03% Pacific Islander, 0.12% from other races, and 0.67% from two or more races. 0.64% of the population were Hispanic or Latino of any race.
There were 14,207 households out of which 29.50% had children under the age of 18 living with them, 56.80% were married couples living together, 10.80% had a female householder with no husband present, and 28.90% were non-families. 25.60% of all households were made up of individuals and 12.90% had someone living alone who was 65 years of age or older. The average household size was 2.44 and the average family size was 2.91.
In the county, the population was spread out with 22.80% under the age of 18, 7.30% from 18 to 24, 27.10% from 25 to 44, 26.40% from 45 to 64, and 16.30% who were 65 years of age or older. The median age was 40 years. For every 100 females there were 94.80 males. For every 100 females age 18 and over, there were 91.60 males.
The median income for a household in the county was $30,989, and the median income for a family was $39,053. Males had a median income of $31,821 versus $19,053 for females. The per capita income for the county was $16,472. About 12.40% of families and 16.60% of the population were below the poverty line, including 24.30% of those under age 18 and 11.30% of those age 65 or over. 0% of those under age 18 and 11.30% of those age 65 or over.
2010 census
As of the 2010 United States Census, there were 33,107 people, 13,869 households, and 9,359 families residing in the county.[14] The population density was 108.4 inhabitants per square mile (41.9/km2). There were 15,918 housing units at an average density of 52.1 per square mile (20.1/km2).[15] The racial makeup of the county was 98.0% white, 0.5% black or African American, 0.4% Asian, 0.1% American Indian, 0.1% from other races, and 0.9% from two or more races. Those of Hispanic or Latino origin made up 0.8% of the population.[14] In terms of ancestry, 26.2% were German, 17.6% were Irish, 13.0% were English, 9.6% were American, 7.0% were Polish, and 6.6% were Italian.[16]
Of the 13,869 households, 28.0% had children under the age of 18 living with them, 51.4% were married couples living together, 11.5% had a female householder with no husband present, 32.5% were non-families, and 28.0% of all households were made up of individuals. The average household size was 2.35 and the average family size was 2.85. The median age was 44.3 years.[14]
The median income for a household in the county was $34,419 and the median income for a family was $43,482. Males had a median income of $41,193 versus $26,585 for females. The per capita income for the county was $21,064. About 13.9% of families and 18.0% of the population were below the poverty line, including 26.5% of those under age 18 and 9.8% of those age 65 or over.[17]
Politics
| Year | Republican | Democratic |
|---|---|---|
| 2016[18] | 72.4% 9,565 | 21.9% 2,894 |
| 2012 | 62.8% 8,135 | 34.6% 4,484 |
| 2008 | 55.4% 7,759 | 42.8% 5,996 |
| 2004 | 56.5% 8,516 | 42.7% 6,435 |
| 2000 | 50.8% 6,859 | 44.5% 6,000 |
| 1996 | 32.4% 4,460 | 51.1% 7,045 |
| 1992 | 29.3% 4,463 | 48.0% 7,298 |
| 1988 | 46.0% 6,793 | 53.5% 7,903 |
| 1984 | 51.8% 8,615 | 47.8% 7,947 |
| 1980 | 45.6% 7,252 | 49.2% 7,832 |
| 1976 | 43.7% 6,705 | 56.3% 8,641 |
| 1972 | 63.2% 10,966 | 36.8% 6,378 |
| 1968 | 42.5% 7,252 | 49.5% 8,449 |
| 1964 | 34.4% 6,175 | 65.6% 11,757 |
| 1960 | 49.9% 9,147 | 50.1% 9,197 |
| 1956[19] | 57.8% 10,223 | 42.2% 7,463 |
| 1952 | 51.6% 9,271 | 48.4% 8,689 |
| 1948 | 46.2% 6,986 | 52.8% 7,989 |
| 1944 | 52.1% 7,800 | 47.9% 7,174 |
| 1940 | 51.2% 9,324 | 48.8% 8,900 |
| 1936 | 46.2% 7,967 | 53.3% 9,198 |
| 1932 | 47.4% 7,416 | 51.1% 7,994 |
| 1928 | 65.2% 9,204 | 33.9% 4,785 |
| 1924 | 55.6% 7,413 | 35.3% 4,710 |
| 1920 | 58.2% 7,208 | 39.9% 4,814 |
Marshall County was usually Democratic between the New Deal and Bill Clinton, after having previously been a Unionist and Republican county since the Civil war. Like all of West Virginia, since 2000 it has been won by increasing margins Republicans George W. Bush, John McCain, Mitt Romney, and Donald Trump.
Communities
- Benwood
- Cameron
- Glen Dale
- McMechen
- Moundsville (county seat)
- Wheeling (mostly in Ohio County)
See also
- Burches Run Wildlife Management Area
- Cecil H. Underwood Wildlife Management Area
- Dunkard Fork Wildlife Management Area
- National Register of Historic Places listings in Marshall County, West Virginia
References
- ^ a b "State & County QuickFacts". United States Census Bureau. Archived from the original on July 14, 2011. Retrieved January 10, 2014.
{{cite web}}: Unknown parameter|deadurl=ignored (|url-status=suggested) (help) - ^ "Find a County". National Association of Counties. Retrieved 2011-06-07.
- ^ http://www.wvculture.org/museum/GraveCreekmod.html
- ^ "Archived copy". Archived from the original on 2001-09-23. Retrieved 2013-02-04.
{{cite web}}: Unknown parameter|deadurl=ignored (|url-status=suggested) (help)CS1 maint: archived copy as title (link) - ^ Marshall County Historical Society. History of Marshall County, West Virginia. Marceline, Mo., Walsworth, 1984.975.416 M367m.
- ^ Gannett, Henry (1905). The Origin of Certain Place Names in the United States. U.S. Government Printing Office. p. 200.
- ^ "2010 Census Gazetteer Files". United States Census Bureau. August 22, 2012. Retrieved July 30, 2015.
- ^ "Population and Housing Unit Estimates". Retrieved June 9, 2017.
- ^ "U.S. Decennial Census". United States Census Bureau. Retrieved January 10, 2014.
- ^ "Historical Census Browser". University of Virginia Library. Retrieved January 10, 2014.
- ^ "Population of Counties by Decennial Census: 1900 to 1990". United States Census Bureau. Retrieved January 10, 2014.
- ^ "Census 2000 PHC-T-4. Ranking Tables for Counties: 1990 and 2000" (PDF). United States Census Bureau. Retrieved January 10, 2014.
- ^ "American FactFinder". United States Census Bureau. Retrieved 2011-05-14.
- ^ a b c "DP-1 Profile of General Population and Housing Characteristics: 2010 Demographic Profile Data". United States Census Bureau. Retrieved 2016-04-03.
- ^ "Population, Housing Units, Area, and Density: 2010 - County". United States Census Bureau. Retrieved 2016-04-03.
- ^ "DP02 SELECTED SOCIAL CHARACTERISTICS IN THE UNITED STATES – 2006-2010 American Community Survey 5-Year Estimates". United States Census Bureau. Retrieved 2016-04-03.
- ^ "DP03 SELECTED ECONOMIC CHARACTERISTICS – 2006-2010 American Community Survey 5-Year Estimates". United States Census Bureau. Retrieved 2016-04-03.
- ^ "Dave Leip's Election Atlas Results Marshall County West Virginia". Retrieved 6 December 2016.
- ^ Scammon, Richard M. (compiler); America at the Polls: A Handbook of Presidential Election Statistics 1920-1964; pp. 494-498 ISBN 0405077114
Places adjacent to Marshall County, West Virginia | ||||||||||||||||
|---|---|---|---|---|---|---|---|---|---|---|---|---|---|---|---|---|
| ||||||||||||||||
Municipalities and communities of Marshall County, West Virginia, United States | ||
|---|---|---|
| Cities | 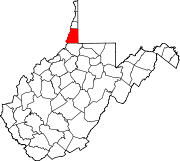 | |
| Unincorporated communities |
| |
| Ghost towns | ||
| Footnotes | ‡This populated place also has portions in an adjacent county or counties | |
The northern panhandle of West Virginia | ||
|---|---|---|
| Counties |  | |
| Communities | ||
| Casinos | ||
| College and Universities | ||
| Entertainment and Shopping | ||
| Historic Sites | ||
| Other Attractions | ||
| Parks | ||