
Talk:Timeline of the COVID-19 pandemic in January 2020
| This is the talk page for discussing improvements to the Timeline of the COVID-19 pandemic in January 2020 article. This is not a forum for general discussion of the article's subject. |
Article policies
|
| Find medical sources: Source guidelines · PubMed · Cochrane · DOAJ · Gale · OpenMD · ScienceDirect · Springer · Trip · Wiley · TWL |
| Archives: 1, 2 |
| The subject of this article is controversial and content may be in dispute. When updating the article, be bold, but not reckless. Feel free to try to improve the article, but don't take it personally if your changes are reversed; instead, come here to the talk page to discuss them. Content must be written from a neutral point of view. Include citations when adding content and consider tagging or removing unsourced information. |
| Material from 2019–20 Wuhan coronavirus outbreak was split to Timeline of the 2019–20 Wuhan coronavirus outbreak on 23 January 2020. The former page's history now serves to provide attribution for that content in the latter page, and it must not be deleted so long as the latter page exists. Please leave this template in place to link the article histories and preserve this attribution. The former page's talk page can be accessed at Talk:2019–20 Wuhan coronavirus outbreak. |
| Material from Timeline of the 2019–20 Wuhan coronavirus outbreak in December 2019 – January 2020 was split to Timeline of the 2019–20 Wuhan coronavirus outbreak in February 2020 on 8 February 2020. The former page's history now serves to provide attribution for that content in the latter page, and it must not be deleted so long as the latter page exists. Please leave this template in place to link the article histories and preserve this attribution. The former page's talk page can be accessed at Talk:Timeline of the 2019–20 Wuhan coronavirus outbreak in December 2019 – January 2020. |
| This article is of interest to the following WikiProjects: | ||||||||||||||||||||||||||||||||||||||||||||||||||||||||||||||||||||||||||||||
Please add the quality rating to the {{WikiProject banner shell}} template instead of this project banner. See WP:PIQA for details.
Please add the quality rating to the {{WikiProject banner shell}} template instead of this project banner. See WP:PIQA for details.
Please add the quality rating to the {{WikiProject banner shell}} template instead of this project banner. See WP:PIQA for details.
Please add the quality rating to the {{WikiProject banner shell}} template instead of this project banner. See WP:PIQA for details.
Please add the quality rating to the {{WikiProject banner shell}} template instead of this project banner. See WP:PIQA for details.
| ||||||||||||||||||||||||||||||||||||||||||||||||||||||||||||||||||||||||||||||


| This article is written in British English, which has its own spelling conventions (colour, travelled, centre, defence, artefact, analyse) and some terms that are used in it may be different or absent from other varieties of English. According to the relevant style guide, this should not be changed without broad consensus. |
What's the source for the 4,475 infected number?
It doesn't seem to be https://gisanddata.maps.arcgis.com/apps/opsdashboard/index.html#/bda7594740fd40299423467b48e9ecf6 (numbers don't match) or http://www.nhc.gov.cn/xcs/yqtb/list_gzbd.shtml (the numbers don't match).
--190.189.120.70 (talk) 01:44, 28 January 2020 (UTC)
- for up to the minute current numbers, I look at bnonews.com SailBelow (talk) 06:42, 29 January 2020 (UTC)
Possible plot with regressions
I am considering adding this log-linear plot of confirmed cases and deaths versus time. The close linear fit for confirmed cases suggests the epidemic is growing exponentially.

Galerita (talk) 02:25, 28 January 2020 (UTC)
- If you keep it updated, it's a great addition. --Eric1212 (talk) 04:14, 28 January 2020 (UTC)
- Great!--Ifwest (talk) 16:59, 28 January 2020 (UTC)
- What is the rationale for starting the plots with January 16th? SailBelow (talk) 04:06, 29 January 2020 (UTC)
- The confirmed cases are continuous starting from 16 January and the update of the deaths from 2 to 3 (on 19 January) occurs from news reports cited in the body of the article. I also wanted to illustrate the "exponential phase", but I'm also considering the best way to present the data.
- Galerita (talk) 00:41, 30 January 2020 (UTC)
- If you keep it updated, it's a great addition. --Eric1212 (talk) 04:14, 28 January 2020 (UTC)
- Also, the plot should extend some days (about a week) into the future. On any given day, there are people who are newly infected. They are starting in their incubation phase and are unknowingly sick. After their incubation phase, they will become symptomatic and start to feel sick. Only at that point would they pursue a diagnosis and become a 'confirmed case'. Thus on any given day, there exists a week's backlog of infected patients. Extending the plot into the future by a week would show the anticipated number of new cases.SailBelow (talk) 06:40, 29 January 2020 (UTC)
- Extrapolating beyond the data is dangerous. It assumes the the current rate of exponential growth will continue into the future, which is doubtful. I'm also trying to balance presentation of statistics with original research.
- Galerita (talk) 00:41, 30 January 2020 (UTC)
I get semi-log coefficients of:
 log10(deaths)    = 0.18145 * x + 0.63971  (R^2 = 0.988)
 log10(confirmed) = 0.17784 * x + 1.51956  (R^2 = 0.995)
Growth is about 18% per day for deaths and confirmed cases. — Preceding unsigned comment added by AndyFroncioni (talk • contribs) 17:00, 28 January 2020 (UTC)
Andy Froncioni (talk) 17:01, 28 January 2020 (UTC)
- I'm using R and my regressions are in log_e. If growth is 18% that means 1.18^4 = 1.94 i.e less than 2. So doubling time would be less than 2 days. Look at the trend in cases and deaths on https://en.wikipedia.org/wiki/Timeline_of_the_2019%E2%80%9320_Wuhan_coronavirus_outbreak#Cases_Statistics Doubling time is clearly about 2 days or less. I get similar R^2 values to you.
- Galerita (talk) 01:02, 30 January 2020 (UTC)
From my experience during the SARS epidemic, the data for deaths will be more accurate and more timely.
Andy Froncioni (talk) 17:17, 28 January 2020 (UTC)
- I think that's basically correct, especially for a slow moving epidemic. There appear to be a shortage of testing kits, so confirmed cases are affected by how fast suspected cases can be tested. Provided deaths are correctly attributed to coronavirus they are a better indicator of the long-term trend of the epidemic, but they lag cases by approximately 10 days, which appears to the average time between becoming a confirmed case and dying, i.e the average survival from diagnosis. Also it is likely that some earlier deaths were attributed to pneumonia. So on balance "confirmed cases" are a better leading indicator of the growth of the epidemic at the moment. I put both on the plot to give the best compromise.
- Galerita (talk) 00:55, 30 January 2020 (UTC)
Epidemic & Pandemic/PHEIC Sections
I have taken the liberty of collapsing the Epidemic section, labeled as such, as it was becoming cumbersome and shall become more so. That's the nature of the beast; it's a time line of a very complicated, volatile, global event. Lots of moving parts.
We should soon have maps soon of confirmed cases and deaths -I suggest that we place them every other day, or perhaps weekly, depending on how comprehensive we want to be. kencf0618 (talk) 16:32, 28 January 2020 (UTC)
- Labeling the entire thing as pandemic phase is inappropriate since it has only recently become an epidemic. It would be better and more accurate to relabel it as "Chronology".--Colin dm (talk) 17:37, 28 January 2020 (UTC)
- It's an epidemic now. If and when that status changes (which dependent on any official announcement by the WHO), we'll need a new section accordingly savvy? kencf0618 (talk) 18:10, 28 January 2020 (UTC)
- Labeling the entire thing as pandemic phase is inappropriate since it has only recently become an epidemic. It would be better and more accurate to relabel it as "Chronology".--Colin dm (talk) 17:37, 28 January 2020 (UTC)
Formatting suboptimal
On the desktop end, a graph is shown at the left of the page and makes the whole article misaligned. I can't quite figure out how to fix that though.
Rethliopuks (talk) 08:57, 29 January 2020 (UTC)
Future projections in cases
Not sure who added the future projections to the case chart, but I am opposed to doing that. Disease progression can be very unpredictable and reporting projected future totals has a lot of potential to confuse readers. Dragons flight (talk) 09:13, 29 January 2020 (UTC)
- Seems that they have already been removed. Dragons flight (talk) 09:55, 29 January 2020 (UTC)
Maps regarding the measures taken in Hong Kong / Map Taskforce
Hi!
- Is there any map(s) that transmits the measures taken in Hong Kong, for example about the ports and checkpoints that are closed?
- And what about other maps of other regions?
- Is someone able to create them on a .svg basis?
- Are there open-source maps related to travel restrictions and/or quarantines in effect?
- Can we get together a map taskforce for this?
I do not have the knowledge required to create them but I am able to do some research and collect data for the map creators/MapTaskForce :)
What do you think about it?
Thank you. FranciscoMMartins (talk) 14:30, 29 January 2020 (UTC)
We should (re)move the table
A better way to show the number of cases would be a graph. The tables are huge and take up almost a full page. --Colin dm (talk) 16:36, 29 January 2020 (UTC)
- You removed the table that showed 5 metrics (suspected/confirmed/severe cases, deaths, recovered) and replaced it with a chart that just shows 1 metric (confirmed cases). You lost 4 metrics in the process. Unless you can add charts that show all 5 metrics, you should reinstate the table. Mbevand (talk) 18:18, 29 January 2020 (UTC)
- Unfortunately you seem to have removed the main chart without debate. Someone has obviously done a lot of work on creating and maintaining it. I would add that graphs are not necessarily a "better way"; some readers are more visual, while others feel more at home with organised statistics. I suggest that this change be reverted Theeurocrat (talk) 17:39, 29 January 2020 (UTC)
- I second this guy. I concede the table was ungainly, but the data itself was more meaningful than the chart by itself. talk) 12:49, 29 January 2020 (EDT) — Preceding unsigned comment added by 192.226.62.169 (talk)
- more specifically, please re-instate the table called "Case Chronology in Mainland China", last present [here](https://en.wikipedia.org/w/index.php?title=Timeline_of_the_2019%E2%80%9320_Wuhan_coronavirus_outbreak&direction=prev&oldid=938180946). Cordially yours, Lord Dinklebert von Stubbins, esq. — Preceding unsigned comment added by 192.226.62.169 (talk) 18:14, 29 January 2020 (UTC)
- I agree; I think the table makes it a lot easier to understand the growth of the outbreak and works much better than a chart. In addition, we should definitely make the viewing area more than 8 rows tall. I understand it must become limited at some point, but I don't think 8 is the right amount. I think 40 would look a lot more fitting, considering the aspect ratio of most screens. The size of them shouldn't really matter in my mind, as I think this article is more technical, and as such, should be more oriented to those doing intensive research, for whom taller tables would help a lot. --Jake M Blueshoes317 (talk) 02:04, 30 January 2020 (UTC)
The charts and table were the whole reason I kept checking this page daily. Please reinstate! Where else can I get the same data equally accessible? Henrik.levkowetz (talk) 18:02, 29 January 2020 (UTC)
- Sorry, clearly the community consensus on this matter was against me, so I'll reinstate the charts.--Colin dm (talk) 18:28, 29 January 2020 (UTC)
- No worries. To be clear, I think most people just care about this small table: https://imgur.com/a/GPw9383 We (at least I) don't care about the per-province data in the other larger tables. Mbevand (talk) 18:38, 29 January 2020 (UTC)
- OK I'll only add back that one.--Colin dm (talk) 19:29, 29 January 2020 (UTC)
- Agreed re: provincial table. Those ones were a hot mess. Maybe if this thing continues to grow exponentially those tables will add more value. But for now the one you're revived ought to suffice. Thanks a ton, and don't forget to do the vampire sneeze! — Preceding unsigned comment added by 192.226.62.169 (talk) 18:51, 29 January 2020 (UTC)
- I plan to fish back these tables and put them into templates. 👍🏻 Yug (talk) 19:22, 29 January 2020 (UTC)
- Thank you for putting it back in - my question, the data was specific to China, is there anyway to expand the numbers in the table (even going forward) to be global numbers?Whaleyjosh (talk) 21:12, 29 January 2020 (UTC)
- Soft reminder... The table we here discussed and then removed were added via Revision 2020-01-29T07:48:12 and other edits, by user:Rethliopuks. When removing large edit-works, please remember to quickly identify via the article's history and notify the main author. While your rationals to remove these overly detailled tables are legit, Rethliopuks invested time and skills for the community. Remember to take 5~10 minutes to thanks the main autho, ask his/her input in the discussion. Politely and positively notify such helpful editors is healthy for all of us. Yug (talk) 21:24, 29 January 2020 (UTC)
- PS:
 Done, Rethliopuks data and formating has been fished back and moved to templates {{2019-20 Wuhan coronavirus data/China medical cases}}, {{2019-20 Wuhan coronavirus data/China medical cases by province}}, accessible via the root template {{2019-nCoV}}. Seems a good solution to save this valuable structured data ! :D Yug (talk) 21:44, 29 January 2020 (UTC)
- Thank you for putting it back in - my question, the data was specific to China, is there anyway to expand the numbers in the table (even going forward) to be global numbers?Whaleyjosh (talk) 21:12, 29 January 2020 (UTC)
- Provincial data are becoming more meaningful as the cases spread. It is really important to for many people to be able to understand how which parts of China are faring. In my mind I think of it like a EU by-country data table; yes, for a hypothetical epidemic in the EU, EU-wide numbers are probably the most helpful for non-EU citizens such as a Brazilian, considering the Schengen area and EU free movement of persons, but national data contain important information too. As another example, for the same 7000 cases, 6000 in Hubei and 650 in the surrounding provinces is very different from 4000 in Hubei and 2500 in Southeastern coastal provinces and the direct municipalities. Rethliopuks (talk) 02:11, 30 January 2020 (UTC)
- I plan to fish back these tables and put them into templates. 👍🏻 Yug (talk) 19:22, 29 January 2020 (UTC)
- Agreed re: provincial table. Those ones were a hot mess. Maybe if this thing continues to grow exponentially those tables will add more value. But for now the one you're revived ought to suffice. Thanks a ton, and don't forget to do the vampire sneeze! — Preceding unsigned comment added by 192.226.62.169 (talk) 18:51, 29 January 2020 (UTC)
Fishing back provincial data !
Hoy ! I think Rethliopuks data and formating has value ! So I fished them back and store these data into templates {{2019-20 Wuhan coronavirus data/China medical cases}}, {{2019-20 Wuhan coronavirus data/China medical cases by province}}. This template will be accessible via the root template associated with that topic. Yug (talk) 21:24, 29 January 2020 (UTC)
- Done, visible in the "Data and figures" row of {{2019-nCoV}}. Yug (talk) 21:37, 29 January 2020 (UTC)
Cases Statistics
I really appreciate this page and check it daily. I think there is a typo on the table of confirmed cases for Jan. 29--it says 7771 but the graphic above it shows 7711 so I checked the Chinese reference and it says 7711 there. I am not an editor and don't want to mess anything up so I'm just letting the editors know. Jamgypsy (talk) 01:33, 30 January 2020 (UTC)
A broken reference
Reference [34] is broken, it has ref name=12 but no other reference uses it.--Adûnâi (talk) 06:48, 30 January 2020 (UTC)
Flags on links
Flags are not supposed to be added to links to countries outside of tables. It isn't standard practice on Wikipedia and adds nothing of value to the article.--Colin dm (talk) 21:59, 30 January 2020 (UTC)
Table Captions?
The table captions can be improved by defining what is meant by the column names. Released being released from quarantine? Or released from the hospital? Recover reporting needs a reference and definition. Plabs (talk) 22:00, 30 January 2020 (UTC)
One section for the days events, with subsections?
How do you feel about the two different sections: Outbreak Chronology and Reactions Chronology? Would it be better one section per day and sub section for each? That way only have to look at one section for the days events. What do think? Daniel.Cardenas (talk) 00:30, 31 January 2020 (UTC)
- I'd second this. The current organisation is going to get progressively more awkward as days pass. However, I wonder if it is at all possible to hide sections so that if you want to, you can focus on a complete chronology of just one of the parts. Rethliopuks (talk) 14:19, 31 January 2020 (UTC)
Mainland China section
I have just split up the original chronology section to create a dedicated section for mainland China. This is similar to how the section for outside MC got created. Many issues still need to be resolved re: the two sections.
- My idea of what content belongs to which sections is roughly follows:
- Chronology: any event belonging to, or not itself belonging to but significantly affecting, the disease itself.
- inside MC: any event related to the outbreak but in nature not an event caused by the disease itself but human actors in mainland China.
- I have left some material in both sections because I couldn't decide how best to organise it. Please also rearrange any material as you see fit.
The split is beneficial for clarity of reading and information input and organisation, although some splitting of the medical situation from the human response might mean the reader needs to cross-reference (more now; not just for oMC events) within this article. It is now clearer as well what content has been covered by the article. As one example, in the former format, the 28 January subsection has several paragraphs of content. Now it appears that this article does not contain any MC responses on that date.
Rethliopuks (talk) 14:11, 31 January 2020 (UTC)
Separate Months
The months should be delineated in some way. kencf0618 (talk) 17:39, 1 February 2020 (UTC)
Very recent news sources/content from Xinhuanews.com
- Hello!
- I send you some links for some news posted recently on Xinhuanews.com [English]. Is anyone interested in using them or a couple as sources for new content on the article?
- Is anyone interested in using them or a couple of them as sources for new content on the article?
- Can you suggest/send us more sources on other news agencies from the P.R.C./Taiwan?
- "During video calls to medical supplies manufacturing enterprises, Li asked about their production and extended greetings to the employees who work during the holiday. He also stressed the importance of ensuring the supply of daily necessities for the public."
- "Pan said that the PBOC will provide relending funds of 300 billion yuan to national banks and local banks in the worst-hit regions, which will then grant credit support at favorable interest rates to key manufacturers of medical supplies and daily necessities."
- Int'l community provides aid to China to support anti-epidemic efforts
- Builldings illuminated with slogans to cheer up Wuhan
- First batch of charter flights brings back 199 stranded Hubei residents
- China's Anhui opens psychological service hotline
- "Source: Xinhua| 2020-01-31 21:02:21|Editor: Xiaoxia|"In face of the outbreak of pneumonia caused by the novel coronavirus, Anhui Province has organized a psychological aid medical team and started a 24-hour hot line to help those affected by the epidemic. (Xinhua/Huang Bohan)"
- "Crimes including fabricating coronavirus-related information that may lead to panic among the public, making up and spreading rumors about the virus, sabotaging the implementation of the law and endangering public security will be strictly cracked down upon to ensure the epidemic prevention and control work is conducted in an orderly way, the circular said. It also stressed harshly punishing illegal hunting of wildlife under state protection, as well as improving inspection and quarantine measures for fresh food and meat products. "
- "China has found effective ways of treating critically ill patients who are affected by the novel coronavirus (2019-nCoV), renowned Chinese epidemiologist Li Lanjuan told Xinhua. [...] The "two balances" refer to maintaining water electrolytes, acid-base balance and micro-ecological balance, Li said. "The treatment of critically ill patients is of great significance. Only by lowering the mortality rate can we allay the fears of the public," she said.""
- "A growing number of Chinese provinces and cities including Heilongjiang, Shandong, Guizhou, Hebei, Hunan, Shanghai and Xi'an have taken similar measures by asking enterprises, except those involved in key sectors, not to resume their work earlier than at midnight on Feb. 9, in a move to reduce crowds and prevent the spread of the coronavirus outbreak."
- "In the northwestern Chinese city of Xi'an, local authorities have asked enterprises to arrange their production flexibly, while employees were encouraged to work at home."
- "According to the provincial government of central China's Hunan on Friday, primary and secondary schools and kindergartens shall not start their spring semesters earlier than Feb. 17, and colleges and universities shall not resume class earlier than Feb. 24."
- "Local authorities also said that all kinds of schools (including training institutions) in Hunan are not allowed to organize any form of offline teaching, training or collective activities."
- "Source: Xinhua| 2020-02-01 21:25:28|Editor: Xiaoxia"
- "Workers make protective suits at a workshop of a company in Harbin, northeast China's Heilongjiang Province, Feb. 1, 2020. Resuming production on Jan. 26, the company's first batch of 400 protective suits has passed through acceptance check and will be put into use. (Photo by Zhang Tao/Xinhua)"
- ::1st coronavirus-infected patient in Changsha cured
- ::premier stresses containing source of infection
- ::Chinese premier stresses ensuring medical supplies in fighting epidemic
- ::China imposes no additional tariffs on coronavirus prevention supplies from U.S.
- ::China grants tax preferences to import of donated supplies for virus control
- ::Chinese city sacks 6 officials over poor performance in anti-coronavirus effort
- ::Roundup: World leaders speak highly of, support China's anti-epidemic efforts
- ::Chinese FM talks with New Zealand deputy PM over novel coronavirus epidemic
- "Noting that World Health Organization (WHO) Director-General Tedros Adhanom Ghebreyesus has spoken highly of China's strong measures against the epidemic and expressed confidence in China's victory, Wang pointed out that the WHO believes that the Chinese actions have gone well beyond the requirements by the International Health Regulations and recommendations by the WHO, and that the WHO disfavors imposing travel or trade restrictions on China."
- "Wang expressed his belief that New Zealand will fully respect WHO's important recommendations, maintain normal exchanges and economic and trade cooperation between the two countries, and firmly support China in preventing and controlling the epidemic."
- "Peters said he understands and respects China's position and believes that it is necessary to maintain normal exchanges and personnel flows, adding that New Zealand will continue to communicate and coordinate with China to properly respond to the challenge of the epidemic."
- ::Taiwan confirms 10th novel coronavirus pneumonia case
- ::Interview: China sets new global standard in epidemic control, says former WHO chief
- ::Economic Watch: China's manufacturing activities remain stable in January
- ::Three drugs fairly effective on novel coronavirus at cellular level
- "The three drugs are Remdesivir, Chloroquine and Ritonavir. They are now under relevant procedures to gain approval for clinical use, said Hubei Daily on Wednesday."
- ::China's Hubei reports 1,032 new confirmed cases of novel coronavirus
- ::Coronavirus prevention situation remains stable in 40,000 elderly care institutions: official
- ::China sees more patients recover from novel coronavirus pneumonia
- ::Commentary: In all-out coronavirus fight, China deserves credit, support
- ::China reports over 2,600 deaths from infectious diseases in December
- Any idea on how to better format this list, please?
- FranciscoMMartins (talk) 23:23, 1 February 2020 (UTC)
WHO Situation Reports
https://www.who.int/emergencies/diseases/novel-coronavirus-2019/situation-reports/
The deadline is 10:00 a.m.; Geneva is UTC+1 (CET), and UTC+2 (CEST) for Daylight Saving Time.
Have fun reconciling the figures.
kencf0618 (talk) 03:12, 2 February 2020 (UTC)
Better section hierarchy needed
As the days pass, the table of contents keeps on growing. I think we should consider adding additional section headers for each month (December, January, etc.), then keep subsections as they currently are. We can then use {{TOC limit}} to hide all the specific days. Bobbychan193 (talk) 09:11, 2 February 2020 (UTC)
- I agree with this 100%, it's getting unwieldy to the point of absurdity. Bobbychan193 (talk), are you going to go ahead and execute this? Andrew Englehart (talk) 22:57, 3 February 2020 (UTC)
- You or anyone can go ahead and do it. Bobbychan193 (talk) 23:04, 3 February 2020 (UTC)
- I've placed the collapse top & bottom templates to bracket the appropriate sections. kencf0618 (talk)
- @Kencf0618: The decision to conceal article content needs to be reversed, in accordance with MOS:COLLAPSE. @Bobbychan193: If the article is getting unwieldy, then content should be split out to separate articles, per WP:TOOLONG. EP111 (talk) 03:05, 5 February 2020 (UTC)
- I've placed the collapse top & bottom templates to bracket the appropriate sections. kencf0618 (talk)
- Yes, I've come across this protocol before. Offhand I don't know which is the largest timeline on Wikipedia, but there needs to be one-stop shopping for this timeline (which is bound to become one of the lengthier ones). Arguably it's the exception to the rule, but I'll let consensus figure it out. kencf0618 (talk) 15:42, 5 February 2020 (UTC)
- @Kencf0618: I'd suggest just splitting out the reactions sections, to a separate article, as an initial measure. The outbreak chronology should stay as one article, for the time being. When the chronology gets long enough, it'll probably be necessary to split it into separate three-month-long articles, with this article being a collection of
{{main}}templates. EP111 (talk) 10:12, 6 February 2020 (UTC)
- @Kencf0618: I'd suggest just splitting out the reactions sections, to a separate article, as an initial measure. The outbreak chronology should stay as one article, for the time being. When the chronology gets long enough, it'll probably be necessary to split it into separate three-month-long articles, with this article being a collection of
- Yes, I've come across this protocol before. Offhand I don't know which is the largest timeline on Wikipedia, but there needs to be one-stop shopping for this timeline (which is bound to become one of the lengthier ones). Arguably it's the exception to the rule, but I'll let consensus figure it out. kencf0618 (talk) 15:42, 5 February 2020 (UTC)
Misleading entry in case statistics table, D/(D+R), and D/C
The D/(D+R) entry in the case statistics table is very misleading in the sense that it is often interpreted as an estimate for mortality. This is only true if the time delay between infection and death (deltaT_D) is equal to the delay between infection and "recovery" (deltaT_R) e.g. for a given illness, if deltaT_R is considerably longer than deltaT_D then D/(D+R) will be much larger than the actual mortality % and may never even tend fast enough to the real mortality value. As a side note, it would seem appropriate to give the actual definition of "recovered case" as used by the (Chinese) medical officials: does recovered mean no more symptoms ? Undetectable levels of the virus ? ... TheRightKindOfDoctor (talk) 18:27, 2 February 2020 (UTC)
- @TheRightKindOfDoctor: I removed the addition of meaningless columns. As for the "Recovered (cumulative)", it comes from the NHC source "累计治愈出院" which means "Cumulative cured/recovered discharge".―― Phoenix7777 (talk) 21:38, 2 February 2020 (UTC)
- @TheRightKindOfDoctor: You are almost right in your assessment. D/(D+R) should not be interpreted as a real estimate for mortality. However, D/(D+R) will trend towards the real mortality value over time, especially when the infection rate growth slows down.--AAAAA (talk) 00:37, 3 February 2020 (UTC)
- @Phoenix7777: I don't think they are meaningless parameters. They help assess the severity (or not) of the outbreak--AAAAA (talk) 00:37, 3 February 2020 UTC)
- @AAAAA: I am sorry to have to insist but D/(D+R) is being misused by others (elsewhere and on FB). It seems a shame that Wikipedia would unwantingly serve as a means to propagate disinformation. D/(D+R) does not show in any way the severity of an outbreak e.g. a below 1% mortality rate with a long recovery time will still show a very high D/(D+R) for months. Even with 9x more recoveries than deaths (this will eventually be the case) D/(D+R) will still be at 10%, regardless of actual mortality rate. Only at the very end of the outbreak will D/(D+R) equate to the mortality ... therefore D/(D+R) truly is meaningless during the outbreak ! TheRightKindOfDoctor (talk) 07:08, 3 February 2020 (UTC)
- @TheRightKindOfDoctor: Let's say the mortality rate is 1% and the recovery time is 2 weeks. Once there are no new infections, after 2 weeks the recoveries should be 99X the deaths. At that time, the D/(D+R) should be equal to the real mortality rate. I understand your point, but on the other side of the argument, many people see 361 Deaths and 17,205 infected and calculated mortality rate of 2.1% and think this outbreak is not scary. Considering 15% of the initial 41 patients have died, seems that mortality rate on this one is about that 15%, unless they find a new treatment. I understand 41 is a low sample size. In any case, I still think D/(D+R) is a good trend indicator. --AAAAA (talk) 15:40, 3 February 2020 (UTC)
- @AAAAA: @TheRightKindOfDoctor: Regarding the initial 41 cases (Jan 2nd) reviewed January 24th paper in the The Lancet. Three weeks later (Jan 22nd) 7 were still hospitalized, 28 had been discharged, and 6 had died. D/(D+R) = 6/(6+28)=18%. I'm not optimistic that 82% (100%-18%) of the 7 unrecovered will recover, so I'd take 18% to be on the low side for this cohort. In the intitial phase of an epidemic, D/(D+R) is a known overestimator, and D/C is a known underestimator. See for example, https://medicalsciences.stackexchange.com/questions/21001/what-is-a-sophisticated-estimate-of-the-2019-ncov-fatality-rate . As is suggested in that link, I suggest a timecourse graph be added to the page. The graph would show the timecourse curves for the estimators D/C and D/(D+R), as well as annotated individual data points, such as (x,y) = (Jan 22, 18%). SailBelow (talk) 18:51, 7 February 2020 (UTC)
- @SailBelow: I agree that we should show the graphs. I don't know how to add graphs that automatically update when the numbers are updated. I would add graphs for: Daily Increase in Confirmed, D/(D+R), D/C (Deaths/Confirmed), (D+R)/C or Resolved/Confirmed. Also... the discussion you quote mentions this "Since both of the naive estimators will yield the same result when the epidemic is over, I suppose one could track both, and extrapolate the curves to where they will meet." Yes, both D/(D+R) and D/C will be exactly the same when the outbreak is over and every single case has been resolved. However, if the daily increase remains high, the D/C will keep being depressed for a long time so it won't really help too much. If days to resolve is for example 15 and daily increase is on average 15%, the number of confirmed cases is 1.15^15-1, which is over 8 times the number of resolved cases. That will keep D/C very low for a long time and that's what we are seeing now. While the D/(D+R) number has been dropping every day, D/C has been steady at 2%. What is sad is that the WHO and the media keep insisting that the risk of death is "Low" at 2% and that's extremely misleading.--AAAAA (talk) 14:13, 8 February 2020 (UTC)
IMO this number should be removed because it is too prone to misinterpretation. If anyone really desires the number for personal, one can calculate it by themselves using the other data present in table. Džuris (talk) 15:52, 3 February 2020 (UTC)
- @Džuris: There are many tables in Wikipedia that have ratios calculated from the data. I think it's not a bad idea to provide more information. Interpretation should be left to the users. I still think that's a good indicator. It's obviously not the real mortality rate. As TheRightKindOfDoctor mentioned above, there's probably a good delta between the average time from diagnosis to death and the average time from diagnosis to recovery. Once that data is available, another column could be created using the deaths data with n days prior to the recovered data (n being the difference in days between death and recovery). I calculated the numbers with a 7d delta (just a guesstimate) and the rate is around 18-19% for the last 4 days. What is currently misinterpreted by most people and even the media is that they use the Deaths/Infected ratio, which is currently 2.1%, and disregard this serious disease as "low mortality". Based on the current numbers, if a new treatment is not found, seems that the real mortality rate is definitely much higher than 2%... possibly as high as 15%. Also, as days pass, the D/(D+R) will keep declining and should trend towards the real mortality rate.
- There is nothing useful that can be interpreted from that data right at this moment. We can include it at a later time, but just not now. Orangewarning (talk) 12:27, 5 February 2020 (UTC)
- @AAAAA: You got something to say, say it here for everyone to discuss. Don't put it in my talk page. Anyway, I'll just address your concerns here. You said that the 2% figure is far from the truth. What is the truth? Because D/(D+R) is equally far from the "truth" too. Now as for whether or not people think that the virus is a big deal, the inclusion of D/(D+R) or CFR for that matter, is not going to change anyone's opinions. The average joe wants someone to tell them what the mortality rate is, they don't know what CFR or D/(D+R) means. If the person knows what it means, then they are not going to be "misled" by the 2% figure in the first place. While you believe that the final CFR will be 8-15%, I would like to remind you that wikipedia articles are meant to be impartial and your edits should not be motivated by what you believe facts to be. While I understand your worries over people not taking this virus seriously, ultimately wikipedia is not a health bulletin, it is not the tool for letting people know how they should or should not act. There are more efficient ways to do it. Honestly, most people won't even be looking at this table. I'm not censoring anything, I'm just removing useless information. And no, I do not work for the chinese government, or any government for that matter. Anyway. I'm just gonna leave it up since you so insist but I still want to reiterate that there is no point in cluttering the table right now. Orangewarning (talk) 11:11, 6 February 2020 (UTC)
- @Orangewarning: Sorry for writing to you in your talk page. I don't know why did I do that in the first place. Yes, D/(D+R) is far from the truth right now, but it is not an invented number... it's just a ratio calculated using numbers currently in the table. About changing people's opinions: I disagree with you. Before I started looking at the numbers of the table and making my own conclusions, I had spoken (by chance) with the Doctor in charge of infections diseases for a large state hospital and she told me that "the fatality rate seems to be low and stable at 2% so not too much worry". And after analyzing the numbers and figuring out that the final CFR will be substantially more than that, it got me worried. And even more that such a Doctor, the WHO and all the media keep thinking that the real CFR is 2% when it's definitely not. Now... about me believing that the final CFR will be 8-15% or whatever, I don't see what's the problem... I didn't post that in the article itself... only here in the talk page. Finally, I appreciate your offer to "leave it up". I think that in a few more days the D/(D+R) will start to stabilize and show something close to the final CFR. Thank you.--AAAAA (talk) 15:02, 7 February 2020 (UTC)
- @AAAAA: You got something to say, say it here for everyone to discuss. Don't put it in my talk page. Anyway, I'll just address your concerns here. You said that the 2% figure is far from the truth. What is the truth? Because D/(D+R) is equally far from the "truth" too. Now as for whether or not people think that the virus is a big deal, the inclusion of D/(D+R) or CFR for that matter, is not going to change anyone's opinions. The average joe wants someone to tell them what the mortality rate is, they don't know what CFR or D/(D+R) means. If the person knows what it means, then they are not going to be "misled" by the 2% figure in the first place. While you believe that the final CFR will be 8-15%, I would like to remind you that wikipedia articles are meant to be impartial and your edits should not be motivated by what you believe facts to be. While I understand your worries over people not taking this virus seriously, ultimately wikipedia is not a health bulletin, it is not the tool for letting people know how they should or should not act. There are more efficient ways to do it. Honestly, most people won't even be looking at this table. I'm not censoring anything, I'm just removing useless information. And no, I do not work for the chinese government, or any government for that matter. Anyway. I'm just gonna leave it up since you so insist but I still want to reiterate that there is no point in cluttering the table right now. Orangewarning (talk) 11:11, 6 February 2020 (UTC)
Dear :@AAAAA:, maybe you can have a look at a web resource on epidemiology. You will see that deaths/cases (CFR) is commonly used (https://en.wikipedia.org/wiki/Case_fatality_rate). Why is it not in the stats table ? Why is D/(D+R) there when nobody in the field uses it ? The average death rate of nCoV is not 15% because it is highly dependent on the age distribution of those initial 41 patients (see for example SARS age-specific CFR (Hong Kong): 0-24 0% (n=0), 25-44 6% (n=29), 45-64 15% (n=35), 65+ 52% (n=87) ) and it's not even close to ANY of the last 12 values of D/(D+R). Alas, in just a few more days, there will have been 500 deaths and ~ 25000 cases (CFR IS quite stable at 2%) but despite about 1250 predicted recoveries, D/(D+R) will still give a rather nonsensical/confusing 28%: from 57.8% to 28% in 1 week ... what does it mean to the average reader ? Bottom line: such (mis)interpretations should NOT be left to the users, not to mention click-bait articles ! TheRightKindOfDoctor (talk) 22:40, 3 February 2020 (UTC)
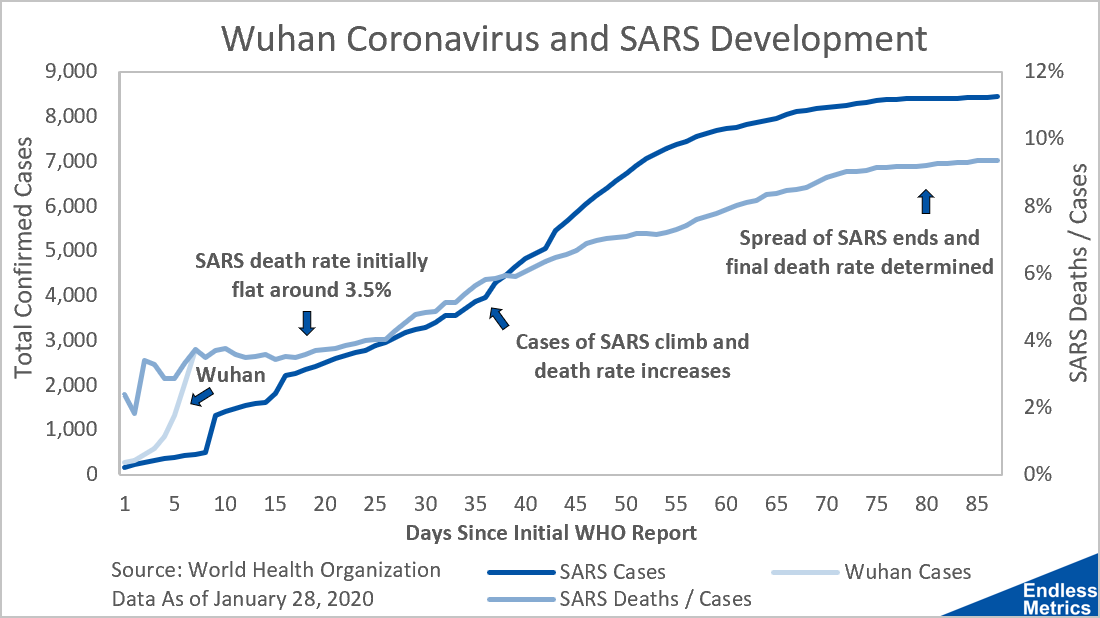
- @TheRightKindOfDoctor: If you read the article you mentioned (https://en.wikipedia.org/wiki/Case_fatality_rate) closely, the example calculation states: "Assume 9 deaths among 100 people in a community all diagnosed with the same disease. This means that among the 100 people formally diagnosed with the disease, 9 died and 91 recovered. The CFR, therefore, would be 9%." This example is assuming that the disease run its course and there was a final outcome. So in the sample, 100 (D+R), 9 (D) and 91 (R), CFR = D/(D+R). So... the article actually SUPPORTS the current calculation of D/(D+R). The article then states "If some of the cases have not yet resolved (either died or recovered) at the time of analysis, this could lead to bias in estimating the CFR." And I agree... there is bias right now, but that bias will be reduced each day. Stating that the CFR is "quite stable at 2%" is incorrect and very misleading. This table is an example of how the media misunderstands it. It's comparing the CURRENT ratio of Deaths/Confirmed Cases (about 2%) with the FINAL ratio of Deaths/Total Cases of Sars. If you look at this chart, you will see that the CFR of SARS was close to 10%, where initially it was wrongly calculated as 3.5%. I just added a note to the CFR Column Title: "CFR = Case Fatality Rate. This number should only be considered final once every person diagnosed with the disease has either died or recovered". If you have a suggestion to improve the note, let me know. --AAAAA (talk) 13:26, 4 February 2020 (UTC)
Agree with removing D/(D+R). It does not seem to be common epidemiological description, and seems particularly likely to be misleading at this point. If you want a hint as to why, just note that it's value has changed from 55% to 33% in a week. It takes people longer to recover than to die, so R is a particularly lagging indicator. CFR is also potentially problematic when reported early in an outbreak, but at least that one is fairly standard (and widely reported) and has also been more stable (only going from 2.2% to 2.0% during the last week). Dragons flight (talk) 11:47, 6 February 2020 (UTC)
- @Dragons flight: I think exactly the opposite is true. The "standard" is reporting 2% that that's FAR AWAY from reality. I estimate that right now the CFR is around 10%. The media is parroting the 2% and that gives comfort to most people, when it's a complete LIE when you are talking about confirmed cases growth of 15%-20% daily. and seems it it's taking about 10-15 days on average from diagnosis to resolution (death or recovery). 1.15^15 is over 8. This means that by the time people have died or recovered, when you calculate what people are wrongly calling CFR it gives you the death rate of people infected 10-15 days before and divides is by a mass of people that is 8 times as large that has 7 times the unresolved cases. 2% gives people a false sense of comfort. And even if the real CFR is now 10%, the deaths/confirmed will keep giving that low 2% if the confirmed cases keep growing at 15% or more per day. That's really bad. On the other hand, the D/(D+R) of the resolved cases will keep going down with time, even if the confirmed growth is 15%, and will trend towards the real CFR. It's good to see that it goes down every day, and also is a reminder of how serious this pandemic is.--AAAAA (talk) 23:37, 6 February 2020 (UTC)
- Your concerns are reasonable, but I think you are missing some details. In overwhelmed Hubei province, where most of the deaths have occurred, I think you'll find the delays between the onset of symptoms and the laboratory confirmation of the diagnosis are actually eating up a majority of the time between the onset of symptoms and death for many of the cases. So while you are right to be concerned that deaths lag confirmed cases, I would suggest that you are overestimating the impact of that lag.
- Using a 9 day delta(days between average diagnosis to recovery minus days between average diagnosis to deach), we get these D/(D+R) ratios in the last few days: 11.1% 10.5% 11.2% 10.6% 10.3% 9.9%. Using a 10 day delta we get these: 7.1% 7.9% 8.1% 8.2% 8.4% 7.9%. Using a 11 day delta we get these: 4.9% 5.0% 6.1% 5.9% 6.5% 6.4%. And using a 12 day delta we get these: 2.7% 3.5% 3.8% 4.4% 4.6% 4.9%. Based on these numbers I now estimate that the final CFR is probably around 6%.--AAAAA (talk) 14:32, 7 February 2020 (UTC)
- Your concerns are reasonable, but I think you are missing some details. In overwhelmed Hubei province, where most of the deaths have occurred, I think you'll find the delays between the onset of symptoms and the laboratory confirmation of the diagnosis are actually eating up a majority of the time between the onset of symptoms and death for many of the cases. So while you are right to be concerned that deaths lag confirmed cases, I would suggest that you are overestimating the impact of that lag.
- However, the question of whether CFR is a good metric is rather separate to the question of whether D/D+R is a good one. Which I don't think it is given the dynamics currently at play and the very high D/D+R numbers. (BTW, you say that D/D+R will keep going down if the case growth stays at 15%, but that's not true. While cases are growing exponentially, then D and R also grow exponentially, albeit with a lag, and D/D+R will be a constant.) Dragons flight (talk) 00:40, 7 February 2020 (UTC)
- I agree with your first sentence, but I think that naming Deaths/Confirmed as Case Fatality Rate with most cases unresolved is extremely misleading. CFR only makes sense once every case has been resolved. And regarding your statement about the D/(D+R) will be a constant as time passes, you are wrong. First, you can empirically see that the number has gone down every day since Jan 27th. Second, I think you can agree that the Final CFR and the Final D/(D+R) will be equal once every case has been resolved. At such time 100% of Confirmed Cases will have either Died or Recovered, so Final CFR = Final D/ConfirmedCases = Final D/(Died+Recovered). So D/(D+R) will keep going down until it reaches the final CFR, in an asymptotic fashion. But the "daily CFR" that the WHO and all the media keep repeating (2%), could remain at that constant number for a long while, giving a false sense of security. And that's VERY WRONG.--AAAAA (talk) 14:32, 7 February 2020 (UTC)
- However, the question of whether CFR is a good metric is rather separate to the question of whether D/D+R is a good one. Which I don't think it is given the dynamics currently at play and the very high D/D+R numbers. (BTW, you say that D/D+R will keep going down if the case growth stays at 15%, but that's not true. While cases are growing exponentially, then D and R also grow exponentially, albeit with a lag, and D/D+R will be a constant.) Dragons flight (talk) 00:40, 7 February 2020 (UTC)
- During a period of true exponential growth one can show mathematically that both CFR and D/(D+R) would be expected remain constant (assuming a constant mortality rate, and constant lags, etc.). They converge to the same value, but the question is which (if either) should be reported now, when we are far from the end of the outbreak. I don't see much argument for preferring the consistently high estimator of D/(D+R). Dragons flight (talk) 18:08, 7 February 2020 (UTC)
- @AAAAA: You do realize that with a statement such as "I cannot begin to understand how bad can the 'epidemiologists' and the 'scientific community' be." you have lost ALL credibility ? CFR is strictly defined ... there is no true of false CFR. Whether people (readers, politicians, journalists, you,.. etc) understand or not the meaning of CFR is NOT a valid reason for you (or anyone) to try to modify its definition or for you to invent a "new/better" indicator than what the scientific community uses. D/(D+R) is to be removed ASAP. Adding CFR is, on the other hand, completely open to debate. TheRightKindOfDoctor (talk) 16:33, 7 February 2020 (UTC)
- Why is it so bad to criticize the "scientific community"? So scientists are never wrong? Wikipedia itself was strongly criticized by scientists and scholars, especially at the beginning. Look at it now. What I can tell you with 100% accuracy is that the final CFR of an outbreak can only be defined once every single confirmed case has been resolved (either died or recovered). Calculating a CFR in the meantime is extremely misleading. In an outbreak with a high daily increase and long resolution term, the quantity of unresolved cases will severely depress the daily calculated CFR, so it's USELESS... absolutely USELESS. And not only useless but it's misleading as many people in the world might make life or death decisions based on how "comfortable" or worried they are with such CFR. A 2% CFR makes too many people too comfortable and that's WRONG!--AAAAA (talk) 14:32, 7 February 2020 (UTC)
A Matter of Usage
I understand "overtake" to mean "to catch up to, as in a race," and "take over" to mean "take control of." Thus, in the clause reading, "Wuhan's Epidemic Prevention and Control Headquarters[450] arranged for Jointown Pharmaceutical to overtake the warehouse management of Wuhan Red Cross...," it seems the intention is to say, "Wuhan's Epidemic Prevention and Control Headquarters[450] arranged for Jointown Pharmaceutical to take over the warehouse management of Wuhan Red Cross...." I think the page is protected, so I leave it to someone else to decide whether the text should be changed.
Thank you, to everyone involved in maintaining this very useful page.
--2600:1700:10:A020:3876:4727:8E4C:2CEF (talk) 00:31, 3 February 2020 (UTC)
Extrapolation
Regarding projections about the future course of the outbreak, please consider the following curve which uses only data from the "confirmed cases" table:

where t represents days since 15 January 2020. You will find c agrees well with the data. Additionally, this formula predicts no new cases after 23 February. Civilization will not end: very good news! — Preceding unsigned comment added by 184.155.206.191 (talk) 23:49, 3 February 2020 (UTC)
- Original research. kencf0618 (talk) 00:09, 4 February 2020 (UTC)
- @Kencf0618: If your formula is correct and there are no new cases after Feb 23, have you calculated how many people would have been infected by then? And assuming that for example by Mar 15 all confirmed cases have been resolved (died or recovered), have you calculated the final death toll? Can you calculate it? --AAAAA (talk) 15:46, 4 February 2020 (UTC)
The fit seems to be diverging from the number of current suspected cases, it is already 15% off 1 or 2 data points down the line, so it can probably be used for interpolation but is not necessarily that good at predicting the number of suspected cases in the future. If the current growth continues, we will know for sure in 2-3 days if the number of suspected cases surpasses the predicted 30000 or not.178.83.152.198 (talk) 11:31, 5 February 2020 (UTC)
- @178.83.152.198: But isn't the formula about the confirmed cases? If daily growth stays at 15% there will be 500,000 infected before the end of February--AAAAA (talk) 23:41, 6 February 2020 (UTC)
"New confirmed cases of coronavirus in mainland China by provincial divisions" numbers are wrong
Hey, these numbers are definitely wrong, not only from the third of February but also from the second of February. The ones with the second of February don't match the ones from the WHO and the ones from the third of February can also not be true, according to this official report by the Chinese government, we have new 890 cases outside of Hubei: http://www.nhc.gov.cn/xcs/yqfkdt/202002/bfebf84fb88248e4a4eba61295e5882b.shtml
I guess the Hong Kong, Taiwan and Macau numbers are included too but even if you substract them you shouldnt't have less than 880. Would be very nice if only the numbers of the situation report of the WHO are used, or none at all, since it can be very confusing and dangerous. It suggests that the numbers outside of Hubei are decreasing while they are not. Thanks. — Preceding unsigned comment added by 130.83.136.149 (talk) 11:06, 4 February 2020 (UTC)
New error in case statistics table.
Case fatality ratio (CFR) is not equal to D/(D+R), unless the outbreak is finished (no new cases). CFR is well defined and used in the medical/scientific community as (Number of deaths)/(Number of CONFIRMED cases). CFR definition is in general not to be modified to include potential or suspected cases. Unsurprisingly, D/(D+R) is not commonly used in the scientific community (I have failed to find one scientific article that uses it) e.g. 2019-nCoV is neither 63.9% nor 51.6 nor 40.2% lethal and neither is its lethality changing that much over a week ! In contrast, CFR has been from 2.35% down to 2.08% during the past week. CFR should at least have a column of its own. — Preceding unsigned comment added by TheRightKindOfDoctor (talk • contribs) 14:52, 4 February 2020 (UTC)
- @TheRightKindOfDoctor: I agree that CFR is not equal to D/(D+R) unless the outbreak is finished. AND ALSO every single case has to be resolved. Even if there are no new cases, the final and correct CFR cannot be calculated just when there are no new cases, as there's some time in which the current confirmed cases have not been resolved. Also, it seems that D/(D=R) is not commonly used in the scientific community, and I find that incredible. More incredible is to tell the public that the CFR is only 2% when in reality it seems to be 10% right now. If you have a rate of growth of confirmed cases of 15% or more and 15 days average to "resolve" a case, you are talking about a group of unresolved confirmed cases of 7X (1.15^15-1) the quantity of resolved cases. So the deaths/confirmed ratio will obviously be much lower than the real CFR ratio. I honestly never analyzed these numbers before, and now that I did I cannot begin to understand how bad can the "epidemiologists" and the "scientific community" be. I understand the politicians, as they always lie to "keep calm". But scientists should know better! The D/(D+R) might not be "commonly used" but I think in a pandemic with this parameters, it is useful. It will keep coming down and eventually will approach the real CFR, even if the confirmed growth rate keeps being high. The Deaths/Confirmed ratio will keep being artificially depressed as long as the daily growth is high and only show the true figure when the growth tapers off substantially. I think that's VERY BAD!--AAAAA (talk) 00:03, 7 February 2020 (UTC)
- Should we remove the numbers though? I feel like whether it's CFR or D/(D+R), it's not exactly relevant information at this point in time. Orangewarning (talk) 11:42, 5 February 2020 (UTC)
- See above discussion. The column should be removed.―― Phoenix7777 (talk) 11:51, 5 February 2020 (UTC)
- @Orangewarning: CFR is a standard well defined indicator in epidemiology/medicine i.e. "Case fatality rate measures the severity of the disease that causes death" (typical use and definition https://www.sciencedirect.com/topics/medicine-and-dentistry/case-fatality-rate and the very nice didactic definition from https://www.britannica.com/science/case-fatality-rate). CFR is different from mortality rate, attack rate, etc and it assumes nothing about the onset/delay until death or survival/recovery. Bottom line: D/(D+R) should DEFINITELY be removed and MAYBE the CFR indicator could be added although (1) it is very easy to find elsewhere, (2) its relevance is arguable this early in the outbreak ... as you pointed out.TheRightKindOfDoctor (talk) 13:47, 8 February 2020 (UTC)
- @Orangewarning: :@Phoenix7777: :@TheRightKindOfDoctor: I agree that CFR is not equal to D/(D+R) unless the outbreak is finished. AND ALSO every single case has to be resolved. Even if there are no new cases, the final and correct CFR cannot be calculated just when there are no new cases, as there's some time in which the current confirmed cases have not been resolved. Also, it seems that D/(D=R) is not commonly used in the scientific community, and I find that incredible. More incredible is to tell the public that the CFR is only 2% when in reality it seems to be 10% right now. Imagine you get infected and you get told that only 2% die... you might be worried but think that only the old and frail people will die. But then every 1 of 10 people actually die. Surprise! I am sure you wouldn't like that. If you have a rate of growth of confirmed cases of 15% or more and 15 days average to "resolve" a case, you are talking about a group of unresolved confirmed cases of 7X (1.15^15-1) the quantity of resolved cases. So the deaths/confirmed ratio will obviously be much lower than the real CFR ratio. I honestly never analyzed these numbers before, and now that I did I cannot begin to understand how bad can the "epidemiologists" and the "scientific community" be. I understand the politicians, as they always lie to "keep calm". But scientists should know better! The D/(D+R) might not be "commonly used" but I think in a pandemic with this parameters, it is useful. And if "the Scientific Community" has not used it yet, then they should start doing so. Calculating CFR as Deaths/Confirmed is very misleading to the public. I actually think it's CRIMINAL to mislead the public in this way. The Deaths/Confirmed ratio will keep being artificially depressed as long as the daily growth is high and only show the true figure when the growth tapers off substantially. I think that's VERY BAD! The D/(D+R)will keep coming down and eventually will approach the real CFR, even if the confirmed growth rate keeps being high. Please let D/(D+R) stay. Be patient... it will get closer to the real CFR every day.--AAAAA (talk) 00:03, 7 February 2020 (UTC)
Chinese citations
I'm seeing a lot of Chinese citations here, which is great unless you don't know Chinese. Someone bilingual should pair each one with a corresponding English citation (which granted would be quite a job). Curiously, I see that this article's language box has to date Czech, Persian, Portuguese, Thai, Turkish, and Vietnamese, but not Chinese. kencf0618 (talk) 17:06, 5 February 2020 (UTC)
新型冠状病毒(2019-nCoV)according to WHO. kencf0618 (talk) 18:24, 5 February 2020 (UTC)
Should we report that the official case numbers fit R=0.9999 with a quadratic curve?
Since January 27th 2020: https://twitter.com/evdefender/status/1225408294585393153
Case Fatality Rate (CFR) seemed to have been fitted to 2.2%, then 2.1%, then 2.0% for a few days.
E.g. It's probably a model, and not actual case statistics. :(
Henk Poley (talk) 15:01, 6 February 2020 (UTC)
- That thread is crap. You fit 5 or 8 points slowly increasing points with 3 free parameters? Of course, you can get an excellent fit. That's not an appropriate use of statistics, his conclusions are misleading. It certainly isn't appropriate for Wikipedia. Dragons flight (talk) 15:14, 6 February 2020 (UTC)
- Thanks for your opinion. 27 Jan. to 6 Feb. is more like 10 points, btw - Henk Poley (talk) 15:29, 6 February 2020 (UTC)
- I've look at Adjusted R-squared for p=3 and n=10. Which calculates to: 1-(1-0.9999) * ((10-1)/(10-3-1)) = 0.99985 - Henk Poley (talk) 15:54, 6 February 2020 (UTC)
Henk, here is an example. I generated 10 random numbers from a normal distribution with mean = 500 and standard deviation = 100:
| Day | 1 | 2 | 3 | 4 | 5 | 6 | 7 | 8 | 9 | 10 |
| Random Value | 540 | 275 | 455 | 408 | 393 | 455 | 377 | 495 | 580 | 449 |
| Cumulative | 540 | 814 | 1269 | 1678 | 2071 | 2526 | 2904 | 3399 | 3978 | 4428 |
| y = 98.02*D^2 + 328.07*D + 178.81 | 512 | 876 | 1255 | 1652 | 2066 | 2499 | 2952 | 3427 | 3924 | 4445 |
After fitting the quadratic function, I get a correlation, R = 0.9996.
Obviously, a highly significant fit, right? Well, no. Those are just some random numbers with the added effect of transforming the numbers into a cumulative form. Dragons flight (talk) 20:33, 6 February 2020 (UTC)
- @Dragons flight: It all points at the numbers being manipulated by the Chinese Government. But... it is INCORRECT to call it CFR. CFR can ONLY be calculated when the disease has finally run its course. The media and epidemiologists are doing a disservice by repeating that CFR is 2%. Real CFR right now seems o be close to 10% --AAAAA (talk) 23:44, 6 February 2020 (UTC)
- Thanks for the reply. One other checkmark on that you shouldn't do statistics if you don't understand what you are doing. (But where do you get the experience?) Henk Poley (talk) 05:23, 7 February 2020 (UTC)
- @AAAAA: Do you realize that with a statement such as "I cannot begin to understand how bad can the 'epidemiologists' and the 'scientific community' be." you have lost ALL credibility ?!! CFR is strictly defined ... there is no true of false CFR. Whether people (readers, politicians, journalists, you,.. etc) understand or not the meaning of CFR is NOT a valid reason for you (or anyone) to try to modify its definition or for you to invent a "new/better" indicator than what the scientific community uses. D/(D+R) is to be removed ASAP. Adding CFR is, on the other hand, completely open to debate. TheRightKindOfDoctor (talk) 16:33, 7 February 2020 (UTC)
- @TheRightKindOfDoctor: CFR cannot be true or correct unless the outbreak has finished and every confirmed cases resolved (either died or recovered).--AAAAA (talk) 20:34, 8 February 2020 (UTC)
- @AAAAA:. I really dont know if you actually don't understand all this or if it's something else ? Let me try again: CFR is NOT what you seem to think it is. CFR = D(dt)/C(dt) is well defined at ALL time points of an outbreak. NO it is not "true" of "false" depending on what YOU think or believe it should be or on what values YOU think it should take. CFR is NOT the "probability of death" because it is the CASE FATALITY RATIO (or rate, or risk, whatever one prefers). Trivially, only at the the end, when all are either back home or 6 feet under, does CFR match the average probability of death ... that does NOT mean that CFR is FALSE or WRONG or should not be used during an outbreak. (to be continued in the "== 2019-02-07: Proposal for mortality graph with under-estimator curve, over-estimator curve, and early data ==" talk section). TheRightKindOfDoctor (talk) 21:28, 8 February 2020 (UTC)
- @TheRightKindOfDoctor: OK. You win. CFR is whatever you say and whatever people believe it is. But what I find really bad is that the WHO and the media promote the sense that the "Risk of Death" is low because the CFR is currently low. And that's what really bothers me. I think that the worst thing you can do on any situation is LIE to the people. The people have the right to know what's going on, so they can make the best decisions for them and their families. Showing only the CFR, which I think you can agree that it could be a under-estimator, will give a false sense of security to the people of the world. That's not good.--AAAAA (talk) 23:46, 8 February 2020 (UTC)
- @TheRightKindOfDoctor when AAAAA says the CFR is false he is indicated his belief that the numbers are falsified.
- @AAAAA If the numbers are false, then we don't know either the numerator or denominator. The CFR can be higher or lower. What we do know, I think you will agree, is that the CFR outside of china is very low. So one could be of the opinion that CFR is over estimated and the risk is lower than you are implying. Daniel.Cardenas (talk) 23:56, 8 February 2020 (UTC)
- @Daniel.Cardenas Alas no ! AAAAA thinks doctors, scientists, WHO, etc ... are all lying to the public by using the CFR indicator. The discussion was not on the reliability/quality of the data provided by China (yes, I'm excluding the possibility of fake data), but on CFR. CFR is NOT whatever I say @AAAAA, it's simply defined in every textbook on epidemiology you can find. TheRightKindOfDoctor (talk) 00:14, 9 February 2020 (UTC)
Airlines, Border Closings, and Universities
I haven't seen the numbers on any of these. A lot of heavy institutions are responding to the Wuhan coronavirus (there were no border closings or massive disruption to travel or trade during the Swine Flu pandemic). kencf0618 (talk) 15:19, 6 February 2020 (UTC)
2019-02-07: Proposal for mortality graph with under-estimator curve, over-estimator curve, and early data
In the intitial phase of an epidemic, D/(D+R) is a known over-estimator, and D/C is a known under-estimator. See for example, https://medicalsciences.stackexchange.com/questions/21001/what-is-a-sophisticated-estimate-of-the-2019-ncov-fatality-rate . As is suggested in that link, I suggest a timecourse graph be added to the page. The graph would show the timecourse curves for the estimators D/C and D/(D+R), as well as annotated individual data points, such as (x,y) = (Jan 22, 18%) (that data point is for the first 41 cases as of Jan 22nd as detailed in the Jan 24th case-review paper in The Lancet) SailBelow (talk) 18:57, 7 February 2020 (UTC)
- Dear @SailBelow:, I have generated some data that "simulates" an ongoing outbreak with a given death/recovery probability and the possibility to include a different time delay between case -> death and case -> recovery. With this data, I made a timecourse of both D/C and D/(D+R). The usefulness of one vs. the other is quite obvious. I will try to provide the graphs here as soon as possible.TheRightKindOfDoctor (talk) 20:40, 7 February 2020 (UTC)
- @TheRightKindOfDoctor:, Awesome, looking forward to it !
- @TheRightKindOfDoctor: I also look forward to you publishing the graphs. I don't know how to make the graphs update automatically with the numbers. I would suggest graphs for D/(D+R), Daily Increase in Confirmed, and Total Resolved/Confirmed (Resolved = D+R).--AAAAA (talk) 14:18, 8 February 2020 (UTC)

@SailBelow: Data was generated using the error function (erf), a 20% probability of death and a time delay for recovery compared to death (these parameter values were chosen to make the different plots easy to visualise - as opposed to a more realistic 2% probability of death).
- Left plot: stacked graphs of deaths, ill and recovered (very similar to https://en.wikipedia.org/wiki/2015_Middle_East_respiratory_syndrome_outbreak_in_South_Korea#/media/File:2015_MERS_Cases_in_South_Korea.svg where the envelope of the graph is equal to the total cumulated cases).
- Right plot: timecourse of both CFR (D/C) and D/(D+R) computed from the synthetic data: which do you prefer ;-) ? TheRightKindOfDoctor (talk) 13:49, 8 February 2020 (UTC)
- @TheRightKindOfDoctor: You mentioned "The usefulness of one vs. the other is quite obvious". And "a more realistic 2% probability of death". I believe that D/(D+R) will asymptotically converge to the real (final) CFR, while D/C will be greatly affected by the daily increase. If the daily increase is high and the days to resolution is high, D/C will be "depressed" until the daily increase is substantially reduced. This means that for a long time it could show a very low number. Your graph doesn't show that. In your graph the D/C rises slightly at the beginning and stays stable until the end. That's not what happens when you have a high daily increase in confirmed cases a long time from diagnosis to resolution. I will try to work on a graph later, using 10% average daily increase and 15 days average time from diagnosis to resolution--AAAAA (talk) 14:30, 8 February 2020 (UTC)

- The graph on the right is a simulation using the following parameters: 40 Initial Confirmed, 65% Initial Daily Increase in Confirmed Cases (Increase on 2nd day from fist day), 7% Daily Reduction in the Daily Increase Rate, 10% Real CFR (constant), 10 Average Days to Death from time of Diagnosis, 20 Average Days to Recovery from time of Diagnosis. You can see that the D/C (Deaths/Confirmed), wrongly called CFR while the outbreak is not finished, keeps going up over time until it converges with D/(D+R) unlike the plot created by User:TheRightKindOfDoctor, which seems to stabilize pretty quickly, and doesn't seem right.--AAAAA (talk) 18:41, 8 February 2020 (UTC)
- Look at the evolution of D/C in the SARS cases The D/C was "stable" for some time... and then... surprise!... started to climb and ended up 3 times higher than originally thought. Same thing will most likely happen with this outbreak. At some point it will start to climb steadily and then converge with the D/(D+R). Based on current numbers, seems that something over 6%. I initially thought it would be between 8-15% but numbers now seem to indicate that the final CFR will be around 6% --AAAAA (talk) 20:31, 8 February 2020 (UTC)
- I've seen that figure, which seems to be sourced to someone's blog. I've also seen this figure [1] which appeared in the Canadian Medical Association Journal and gives a very different impression. Dragons flight (talk) 23:39, 8 February 2020 (UTC)

- @AAAAA:. Hello again ... So what do we have here ? D/C vs. D/(D+R) graphs. What does mine and yours have in common despite the different initial "simulation" parameters ? They both show that D/(D+C) is a "lazy" indicator that spends almost half of the outbreak with values that are between 10 and 70 points above the ab initio parameter (10% in your case, 20% in mine). What seems right or not to you is irrelevant when all one needs is to look at the current data D/C vs. D/(D+R) graph: same conclusion ! TheRightKindOfDoctor (talk) 22:56, 8 February 2020 (UTC)
- @TheRightKindOfDoctor: I have a question for you: Based on the current data available, what do you estimate (or guesstimate) that the final CFR will be? Do you really think that the finaly CFR will be about 2%, the same as it is now? --AAAAA (talk) 23:52, 8 February 2020 (UTC)
- @AAAAA:. I'm a scientist. Scientists typically work to improve measurements / data collection. Why would anyone waste their time "guesstimating" when there are many real-life things that can alter the course of this outbreak, like mutations or a treatment (that would change the progression of CFR) or a bias in the data from running out of diagnose kits, or from receiving much faster new "speed-tests" (that also would change the progression of CFR). CFR has been equal to approx. 2% +/-1 for some time now (2% is not low, 0.1 is). CFR when combined with the number of cases, is a reliable indicator of the severity of this outbreak. CFR is just a measure ... and that's it - it's time to accept that don't you think ? TheRightKindOfDoctor (talk) 00:58, 9 February 2020 (UTC)
- @AAAAA:. Hello again ... So what do we have here ? D/C vs. D/(D+R) graphs. What does mine and yours have in common despite the different initial "simulation" parameters ? They both show that D/(D+C) is a "lazy" indicator that spends almost half of the outbreak with values that are between 10 and 70 points above the ab initio parameter (10% in your case, 20% in mine). What seems right or not to you is irrelevant when all one needs is to look at the current data D/C vs. D/(D+R) graph: same conclusion ! TheRightKindOfDoctor (talk) 22:56, 8 February 2020 (UTC)

- For illustration purposes, I used 50% final CFR in the simulation. Please look at how similar it looks compared to the SARS CFR chart Also, you can notice that if final CFR was 50%, the under-estimator and over-estimator curves have similar degrees of "lazyness".--AAAAA (talk) 00:14, 9 February 2020 (UTC)
- @AAAAA:. 50 % !!! Nice try but the SARS exemple you provide shows a CFR equal to approx. 3.5% that goes up 6 points in 2.5 months ... that's almost nothing compared to how much D/(D+R) changes in a few days. TheRightKindOfDoctor (talk) 00:58, 9 February 2020 (UTC)
- @TheRightKindOfDoctor: Seems you misunderstood me. I didn't put 50% because I think that the final CFR of this outbreak is anything near that number. It was for illustration purposes. To show that the D/C curve has the same "look" of the D/(D+R) curve, and it's not almost straight as it seems to be in your simulation plot. Once more... I am not saying that D/(D+R) is anything near the final CFR. But it serves to show that D/C isn't the final CFR either. I found an interesting article in worldometer. It references an article in the American Academy of Epidemiology titled "Methods for Estimating the Case Fatality Ratio for a Novel, Emerging Infectious Disease". This article states "But while an epidemic is still ongoing, as it is the case with the current novel coronavirus outbreak, this formula (CFR=Deaths/Cases) is, at the very least, "naïve" and can be "misleading if, at the time of analysis, the outcome is unknown for a non negligible proportion of patients" --AAAAA (talk) 02:41, 9 February 2020 (UTC)
- @AAAAA:. I understand quite well, don't worry. I don't have time right now but ... spoiler alert: the worldometers bit about CFR is using specious arguments. For the AJOE article, I need more data and a bit of time to verify some stuff (that's the other thing scientists do: they double check everything they need to ;-). TheRightKindOfDoctor (talk) 19:31, 9 February 2020 (UTC)
- @AAAAA:. Concerning the in worldometer, it's a bit of a mixed bag of "good and no so good" statements. For example: (1) After explaining correctly why, during an outbrake, D/C is a "naïve" estimate of the CFR, it goes on to introduce CFR = deaths at day.x / cases at day.x-{T} (where T = average time period from case confirmation to death) and provides examples for T=7 and T=12 ... but forgets to mention that for T greater than 8, this method of calculation will gives values of CFR above 100% ... oops ! (2) After explaining that CFR would be better estimated if calculated as deaths/(deaths + recovered) because D/C is just "naïve and can be misleading" they get a CFR = 20% !!! Oh, no, what should we do ... quick, think of something ... I know, just take away 90% of all the data ... CFR=4.3% (...outside of mainland China): much better now, don't you think ? TheRightKindOfDoctor (talk) 12:59, 10 February 2020 (UTC)
2019-02-07 Proposal for reformating the page
- simplified Table of Contents:
- (NEW SECTION) Geographical timeline maps
- Time-histogram of cases and fatalities (orange and red histogram)
- (NEW SECTION)Semi-log plots of Daily and Cummulative Confirmed Cases in Mainland China
- Time-Table of Mainland China Cases (currently in TOC as Case Statistics)
- Highlights of Outbreak Chronology (move sub-TOC to that section)
- Events, reactions, and measures in mainland China (again, move sub-TOC to that section)
- Reactions and measures outside Mainland China (again, move sub-TOC to that section)
- (possible new section) Media Coverage
- remove the image of the virus, it is irrelevant to the timeline theme of this page.
- or, recaption it as an artistic image. The two people credited on CDC with the image are medical illustrators.
- or, if you know it is data based, state the source/type of data that is rendered and include "false-coloring" in caption
- move the (excellent) map "Date when first case..." to a new section
- move the (excellent) semi-log plots to a new section
- remove the global map "Dark red denotes country)
- or, explain the timeline relevance/nature of the data
- remove the media "Health Commission: 440 cases" (occurs twice on the page); "Infectious Disease Expert ..."; "Hong Kong confirms ..."
- or, move them to a new section
- or, explain their special importance
- move the (excellent) provincial-growth map (the animated map) to be alongside the first-case map
--SailBelow (talk) 21:56, 7 February 2020 (UTC)
- I suggest splitting the article where possible or reduce the content while reformatting the page as it has pointed out in Wikipedia:Teahouse#What_happened_that_the_refs_just_vanished_and_got_replaced_by_template_links? that the page is currently in Category:Pages_where_template_include_size_is_exceeded, which results in the Reflist and the Navbox templates not being shown properly. robertsky (talk) 02:38, 8 February 2020 (UTC)
- Update, I have broken up the article by month to get around techinical limitations. robertsky (talk) 03:49, 8 February 2020 (UTC)
Move discussion in progress
There is a move discussion in progress on Talk:2019 novel coronavirus which affects this page. Please participate on that page and not in this talk page section. Thank you. —RMCD bot 10:49, 9 February 2020 (UTC)
About the case statistics section size, let's try to reduce the size of the templates used
See new discussion in Talk:Timeline_of_the_2019–20_Wuhan_coronavirus_outbreak_in_February_2020#About_the_case_statistics_section_size,_let's_try_to_reduce_the_size_of_the_templates_used robertsky (talk) 07:32, 11 February 2020 (UTC)
Requested move 11 February 2020
| It has been proposed in this section that Timeline of the COVID-19 pandemic in January 2020 be renamed and moved to Timeline of the COVID-19 outbreak in December 2019 – January 2020. A bot will list this discussion on the requested moves current discussions subpage within an hour of this tag being placed. The discussion may be closed 7 days after being opened, if consensus has been reached (see the closing instructions). Please base arguments on article title policy, and keep discussion succinct and civil. Please use {{subst:requested move}}. Do not use {{requested move/dated}} directly. |
Timeline of the 2019–20 Wuhan coronavirus outbreak in December 2019 – January 2020 → Timeline of the COVID-19 outbreak in December 2019 – January 2020 – Virus has an official name by WHO 70.21.192.44 (talk) 21:57, 11 February 2020 (UTC)
- Comment This request move now resides in the 2019-nCoV talk page because this article will moved along with all articles retaining former names prior to WHO and ICTV announcement as COVID-19 and SARS-CoV 2. 36.76.229.147 (talk) 22:31, 11 February 2020 (UTC)
- Wikipedia controversial topics
- List-Class China-related articles
- Low-importance China-related articles
- List-Class China-related articles of Low-importance
- Wikipedia requested photographs in China
- WikiProject China articles
- List-Class Disaster management articles
- Low-importance Disaster management articles
- List-Class history articles
- Low-importance history articles
- WikiProject History articles
- List-Class medicine articles
- Low-importance medicine articles
- List-Class pulmonology articles
- Low-importance pulmonology articles
- Pulmonology task force articles
- Wikipedia requested images of medical subjects
- All WikiProject Medicine pages
- List-Class virus articles
- Low-importance virus articles
- Wikipedia requested images of viruses
- WikiProject Viruses articles
- Wikipedia articles that use British English
- Requested moves