1986 Arkansas gubernatorial election
| |||||||||||||||||
| |||||||||||||||||
 County results
Clinton: 50–60% 60–70% 70–80% | |||||||||||||||||
| |||||||||||||||||
| Elections in Arkansas |
|---|
 |
The 1986 Arkansas gubernatorial election was conducted on November 4, 1986, to elect the Governor of Arkansas.
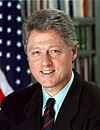
Incumbent Democratic Governor Bill Clinton stood for re-election. He had been elected in 1982 and re-elected in 1984, and sought a third consecutive term and fourth overall (Clinton had been first elected in 1978). His opponent was former Republican Governor Frank D. White, who was seeking to return to the office he had defeated Clinton for in the 1980 election.
Clinton had defeated former Governor Orval Faubus for the Democratic nomination, while White defeated former Lieutenant Governor Maurice Britt in the Republican primary.
Background
This was the first gubernatorial election following the enactment of a constitution amendment in 1984, that increased the office's term from two years to four years.[1]
Democratic primary
Clinton won the Democratic primary with 60.58% of the vote against Orval Faubus with 33.5% and W. Dean Goldsby with 5.92%.[2]
| Candidate | Votes | % |
|---|---|---|
| Bill Clinton (incumbent) | 315,397 | 60.58% |
| Orval Faubus | 174,402 | 33.50% |
| W. Dean Goldsby | 30,829 | 5.92% |
| Total votes | 520,628 | 100% |
Results by County
| County | Clinton | Faubus | Goldsby | Margin |
|---|---|---|---|---|
| Arkansas | 62.78% | 32.75% | 4.48% | 30.03% |
| Ashley | 60.74% | 34.34% | 4.92% | 26.40% |
| Baxter | 67.69% | 26.81% | 5.50% | 40.88% |
| Benton | 75.39% | 19.78% | 4.83% | 55.61% |
| Boone | 44.17% | 51.40% | 4.43% | 7.23% |
| Bradley | 61.20% | 34.77% | 4.03% | 26.43% |
| Calhoun | 55.29% | 38.91% | 5.80% | 16.38% |
| Carroll | 47.15% | 48.45% | 4.40% | 1.30% |
| Chicot | 76.06% | 18.67% | 5.27% | 57.39% |
| Clark | 65.48% | 29.30% | 5.23% | 36.18% |
| Clay | 57.86% | 34.30% | 7.85% | 23.56% |
| Cleburne | 48.63% | 46.07% | 5.31% | 2.56% |
| Cleveland | 42.46% | 53.89% | 3.66% | 11.43% |
| Columbia | 56.11% | 34.80% | 9.09% | 21.31% |
| Conway | 55.28% | 38.60% | 6.12% | 16.68% |
| Craighead | 63.29% | 28.74% | 7.98% | 34.55% |
| Crawford | 54.02% | 35.77% | 10.21% | 18.25% |
| Crittenden | 75.60% | 17.23% | 7.17% | 58.37% |
| Cross | 64.93% | 27.63% | 7.44% | 37.30% |
| Dallas | 56.82% | 38.68% | 4.51% | 18.14% |
| Desha | 70.94% | 24.93% | 4.14% | 46.01% |
| Drew | 63.46% | 33.31% | 3.23% | 30.15% |
| Faulkner | 52.91% | 39.19% | 7.90% | 13.72% |
| Franklin | 42.59% | 51.60% | 5.81% | 9.01% |
| Fulton | 54.64% | 33.50% | 11.86% | 21.14% |
| Garland | 62.74% | 32.77% | 4.49% | 29.97% |
| Grant | 46.86% | 49.12% | 4.01% | 2.26% |
| Greene | 62.83% | 27.55% | 9.62% | 35.28% |
| Hempstead | 60.85% | 32.40% | 6.75% | 28.45% |
| Hot Spring | 54.25% | 40.77% | 4.97% | 13.48% |
| Howard | 56.17% | 38.43% | 5.40% | 17.74% |
| Independence | 46.57% | 47.75% | 5.68% | 1.18% |
| Izard | 55.58% | 37.12% | 7.30% | 18.46% |
| Jackson | 58.65% | 36.35% | 5.00% | 22.30% |
| Jefferson | 68.76% | 26.15% | 5.09% | 42.61% |
| Johnson | 52.07% | 41.72% | 6.21% | 10.35% |
| Lafayette | 63.22% | 31.63% | 5.15% | 31.59% |
| Lawrence | 53.10% | 37.18% | 9.72% | 15.92% |
| Lee | 69.24% | 24.73% | 6.03% | 44.51% |
| Lincoln | 61.52% | 35.50% | 2.98% | 26.02% |
| Little River | 66.37% | 26.16% | 7.47% | 40.21% |
| Logan | 47.27% | 43.27% | 9.46% | 4.00% |
| Lonoke | 56.56% | 39.24% | 4.20% | 17.32% |
| Madison | 23.43% | 74.31% | 2.25% | 50.88% |
| Marion | 53.87% | 37.94% | 8.18% | 15.93% |
| Miller | 65.18% | 28.97% | 5.85% | 36.21% |
| Mississippi | 69.25% | 23.85% | 6.90% | 45.40% |
| Monroe | 61.58% | 34.79% | 3.63% | 26.79% |
| Montgomery | 51.68% | 42.44% | 5.88% | 9.24% |
| Nevada | 55.69% | 36.62% | 7.70% | 19.07% |
| Newton | No results | |||
| Ouachita | 64.69% | 29.97% | 5.34% | 34.72% |
| Perry | 50.26% | 44.43% | 5.31% | 5.83% |
| Phillips | 66.54% | 22.10% | 11.36% | 44.44% |
| Pike | 51.71% | 41.37% | 6.92% | 10.34% |
| Poinsett | 62.91% | 30.14% | 6.95% | 32.77% |
| Polk | 60.41% | 31.39% | 8.20% | 29.02% |
| Pope | 50.57% | 44.10% | 5.33% | 6.47% |
| Prairie | 47.61% | 48.05% | 4.34% | 0.44% |
| Pulaski | 70.79% | 25.78% | 3.43% | 45.01% |
| Randolph | 57.75% | 33.35% | 8.90% | 24.40% |
| St. Francis | 67.02% | 27.28% | 5.70% | 39.74% |
| Saline | 59.03% | 36.40% | 4.58% | 22.63% |
| Scott | 52.51% | 33.35% | 14.14% | 19.16% |
| Searcy | 54.95% | 41.55% | 3.50% | 13.40% |
| Sebastian | 60.36% | 32.63% | 7.02% | 27.73% |
| Sevier | 62.53% | 32.11% | 5.36% | 30.42% |
| Sharp | 57.75% | 34.64% | 7.61% | 23.11% |
| Stone | 42.86% | 51.10% | 6.03% | 8.24% |
| Union | 61.78% | 30.84% | 7.39% | 30.94% |
| Van Buren | 49.09% | 45.31% | 5.60% | 3.78% |
| Washington | 68.29% | 26.80% | 4.91% | 41.49% |
| White | 56.88% | 38.51% | 4.61% | 18.37% |
| Woodruff | 72.90% | 23.68% | 3.42% | 49.22% |
| Yell | 47.35% | 45.62% | 7.03% | 1.73% |

- 40%-50%
- 50%-60%
- 60%-70%
- 70%-80%
- 40%-50%
- 50%-60%
- 60%-70%
- 70%-80%
Result
Clinton won the election with almost 64% of the vote.
| Party | Candidate | Votes | % | ±% | |
|---|---|---|---|---|---|
| Democratic | Bill Clinton (incumbent) | 439,802 | 63.90% | +1.35% | |
| Republican | Frank D. White | 248,427 | 36.10% | −1.35% | |
| Total votes | 688,229 | 100.00 | |||
| Democratic hold | |||||
References
- ^ Moreland, Steed & Baker 1991, p. 144.
- ^ McCuen, Bill (1986). "Arkansas Election Results 1986" (PDF). Archived from the original (PDF) on November 9, 2022. Retrieved March 3, 2023.
- ^ "Arkansas Election Results 1986" (PDF). Arkansas Secretary of State. Retrieved October 29, 2016.
Works cited
- Moreland, Laurence; Steed, Robert; Baker, Tod, eds. (1991). The 1988 Presidential Election in the South: Continuity Amidst Change in Southern Party Politics. Praeger Publishers. ISBN 0275931455.


