1964 United States presidential election in Mississippi
| |||||||||||||||||||||||
| |||||||||||||||||||||||
 County Results
Goldwater 60-70% 70-80% 80-90% 90-100%
| |||||||||||||||||||||||
| Elections in Mississippi |
|---|
 |
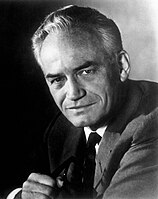
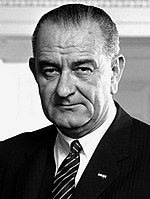
The 1964 United States presidential election in Mississippi was held on November 3, 1964, as part of the 1964 United States presidential election, which was held on that day throughout all fifty states and The District of Columbia. Voters chose seven electors, or representatives to the Electoral College, who voted for president and vice president.
The Republican Party nominee, Senator Barry Goldwater of Arizona, won Mississippi with a lopsided 74.28% margin of victory against the Democratic Party nominee, incumbent President Lyndon B. Johnson, making the state a staggering 97% more Republican than the national average. Goldwater was the first Republican to carry the Magnolia State since Reconstruction.
Background
In a state where fewer than ten percent of blacks were registered voters,[1] and an almost entirely white electorate had lost none of its hostility towards the Civil Rights Movement, President Johnson's policies, not only on civil rights but also his "War on Poverty", were anathema. Governor Paul B. Johnson Jr., though considered relatively liberal for such reforms as repealing statewide Prohibition, told Mississippians not to obey the Civil Rights Act when it became law in the middle of 1964, while it was clear from the time Johnson planned his legislation that Mississippi white Democrats resented federal intervention with the state's traditional racial policy.[2][3]
Neither Governor Johnson nor any other major state or federal politician offered President Johnson any support in his statewide campaign, which was left to the inexperienced Greenville lawyer Douglas Wynn.[4] Although Governor Johnson and four of five Congressmen were silent about supporting Goldwater, John Bell Williams did support the Republican[4] and left President Johnson's inexperienced and makeshift campaign team with no hope against the state's electorate. Over ninety percent of Mississippi's electorate viewed President Johnson as having done a bad job and 96.4 percent opposed the Civil Rights Act vis-à-vis only 54 percent in all antebellum slave states plus Oklahoma.[5] 87 percent of Mississippi voters, vis-à-vis 48 percent in the South as a whole, believed that President Johnson was failing at countering domestic Communism.[5] This concern with domestic Communism reflected the belief, widespread among Mississippi whites for over three decades, that civil rights activists were funded by Communist parties,[6] whether domestic or Soviet.[7]
Polls
Opinion polls in July amongst registered Mississippi voters giving their opinions of Johnson and Goldwater,[8] and by professional pollsters in August, both showed clearly that Johnson possessed no chance of keeping Mississippi in the Democratic column where it had solidly been since 1876.[9] This despite the fact that George Wallace – who would win the state as a third-party candidate in the following election – decided not to run in July, and plans to place unpledged Democratic electors on the ballot as had been done for the preceding two elections (and who would have been expected to support Wallace this time) were abandoned.[10]
In July, polling suggested Goldwater would receive ninety percent of Mississippi's vote,[11] but this fell to seventy in August[12] and to between sixty and sixty-five in October due to fears he would abolish the Rural Electrification Administration that had played an important role in developing Mississippi.[11] By the weekend before election day, University of California political scientist Peter H. Odegard believed Goldwater would win only Alabama[a] and Mississippi and had doubts even with those two.[13]
Vote
When the national Democratic Party previously took positions on civil rights viewed too radical, Mississippi's white population's extreme traditional hostility to the Republican Party caused the Magnolia State to elect "states' rights" Democrats and unpledged Democratic electors in 1948 and 1960 respectively. Despite their hostility to the "Republican" label in the past, Goldwater's support for "constitutional government and local self-rule"[14] meant that the absence from the ballot of such third parties mattered little. The Arizona Senator had been one of only six Republicans to vote against the Civil Rights Act,[15] and Goldwater's staunchly conservative policies, which alienated the traditional Northeastern Republican heartland to the point of completely abandoning the GOP,[16] were adequate for the small Mississippi electorate to almost unanimously support him over the "big government" Johnson. In addition to his unacceptable record on racial issues, Mississippi whites also felt that Johnson was doing a very bad job of keeping taxes and spending low.[5]
Amidst a landslide national defeat for Goldwater, he nonetheless defeated President Johnson by a margin of 74.28%, comparable to what had been predicted in the earliest polls and much greater than predicted immediately before the election. Over-representation of urban areas in polling was blamed for this discrepancy.[17] Goldwater's victory in Mississippi made him only the second Republican presidential nominee to carry the state as well as the first one since Ulysses S. Grant in 1872. His 87.14% in the popular vote made it his strongest state in the 1964 election.[18]
Goldwater won all of Mississippi's eighty-two counties, the most recent candidate to do so as of the 2020 presidential election, and won fifty-one with over ninety percent of the vote.[19] Even in the poor white northeastern hills where residual support for Johnson remained based on fear of Goldwater dismantling public works,[20] Goldwater exceeded sixty percent in every county.
Goldwater's percentage margin is the largest statewide percentage victory by any Republican presidential nominee since that party formed,[21] while no state has been won by so large a margin since. In seven counties, Goldwater received a larger proportion of the vote than any presidential nominee has subsequently received in one county.[b] As of the 2020 presidential election[update], this is the last election in which Claiborne County, Holmes County, and Jefferson County voted for a Republican presidential nominee.[22]
Results
| 1964 United States presidential election in Mississippi[19] | |||||
|---|---|---|---|---|---|
| Party | Candidate | Votes | Percentage | Electoral votes | |
| Mississippi Republican | Barry Goldwater | 356,528 | 87.14% | 7 | |
| National Democratic | Lyndon B. Johnson | 52,618 | 12.86% | 0 | |
| Totals | 409,146 | 100.00% | 7 | ||
| Voter turnout (Voting age) | 33.9% | ||||
Results by county
| County | Barry Morris Goldwater Mississippi Republican |
Lyndon Baines Johnson National Democratic |
Margin | Total votes cast | |||
|---|---|---|---|---|---|---|---|
| # | % | # | % | # | % | ||
| Adams | 5,900 | 84.37% | 1,093 | 15.63% | 4,807 | 68.74% | 6,993 |
| Alcorn | 3,377 | 63.79% | 1,917 | 36.21% | 1,460 | 27.58% | 5,294 |
| Amite | 2,742 | 96.38% | 103 | 3.62% | 2,639 | 92.76% | 2,845 |
| Attala | 4,409 | 94.37% | 263 | 5.63% | 4,146 | 88.74% | 4,672 |
| Benton | 934 | 79.83% | 236 | 20.17% | 698 | 59.66% | 1,170 |
| Bolivar | 4,680 | 86.49% | 731 | 13.51% | 3,949 | 72.98% | 5,411 |
| Calhoun | 3,224 | 91.64% | 294 | 8.36% | 2,930 | 83.29% | 3,518 |
| Carroll | 2,043 | 95.42% | 98 | 4.58% | 1,945 | 90.85% | 2,141 |
| Chickasaw | 3,138 | 91.83% | 279 | 8.17% | 2,859 | 83.67% | 3,417 |
| Choctaw | 2,096 | 93.32% | 150 | 6.68% | 1,946 | 86.64% | 2,246 |
| Claiborne | 1,226 | 93.59% | 84 | 6.41% | 1,142 | 87.18% | 1,310 |
| Clarke | 3,591 | 93.42% | 253 | 6.58% | 3,338 | 86.84% | 3,844 |
| Clay | 2,848 | 92.65% | 226 | 7.35% | 2,622 | 85.30% | 3,074 |
| Coahoma | 4,172 | 81.23% | 964 | 18.77% | 3,208 | 62.46% | 5,136 |
| Copiah | 4,506 | 94.96% | 239 | 5.04% | 4,267 | 89.93% | 4,745 |
| Covington | 3,033 | 88.55% | 392 | 11.45% | 2,641 | 77.11% | 3,425 |
| DeSoto | 2,928 | 86.40% | 461 | 13.60% | 2,467 | 72.79% | 3,389 |
| Forrest | 9,291 | 89.17% | 1,128 | 10.83% | 8,163 | 78.35% | 10,419 |
| Franklin | 2,211 | 96.05% | 91 | 3.95% | 2,120 | 92.09% | 2,302 |
| George | 2,797 | 92.04% | 242 | 7.96% | 2,555 | 84.07% | 3,039 |
| Greene | 1,845 | 89.52% | 216 | 10.48% | 1,629 | 79.04% | 2,061 |
| Grenada | 3,648 | 95.92% | 155 | 4.08% | 3,493 | 91.85% | 3,803 |
| Hancock | 2,550 | 62.95% | 1,501 | 37.05% | 1,049 | 25.89% | 4,051 |
| Harrison | 16,301 | 75.14% | 5,393 | 24.86% | 10,908 | 50.28% | 21,694 |
| Hinds | 36,831 | 87.93% | 5,058 | 12.07% | 31,773 | 75.85% | 41,889 |
| Holmes | 3,115 | 96.59% | 110 | 3.41% | 3,005 | 93.18% | 3,225 |
| Humphreys | 1,863 | 95.69% | 84 | 4.31% | 1,779 | 91.37% | 1,947 |
| Issaquena | 456 | 93.06% | 34 | 6.94% | 422 | 86.12% | 490 |
| Itawamba | 2,140 | 65.50% | 1,127 | 34.50% | 1,013 | 31.01% | 3,267 |
| Jackson | 11,357 | 82.73% | 2,371 | 17.27% | 8,986 | 65.46% | 13,728 |
| Jasper | 2,994 | 92.69% | 236 | 7.31% | 2,758 | 85.39% | 3,230 |
| Jefferson | 1,258 | 94.80% | 69 | 5.20% | 1,189 | 89.60% | 1,327 |
| Jefferson Davis | 2,351 | 90.91% | 235 | 9.09% | 2,116 | 81.83% | 2,586 |
| Jones | 12,123 | 85.95% | 1,981 | 14.05% | 10,142 | 71.91% | 14,104 |
| Kemper | 2,185 | 91.96% | 191 | 8.04% | 1,994 | 83.92% | 2,376 |
| Lafayette | 3,202 | 81.64% | 720 | 18.36% | 2,482 | 63.28% | 3,922 |
| Lamar | 3,372 | 90.99% | 334 | 9.01% | 3,038 | 81.98% | 3,706 |
| Lauderdale | 13,291 | 89.36% | 1,583 | 10.64% | 11,708 | 78.71% | 14,874 |
| Lawrence | 2,373 | 90.95% | 236 | 9.05% | 2,137 | 81.91% | 2,609 |
| Leake | 4,343 | 96.23% | 170 | 3.77% | 4,173 | 92.47% | 4,513 |
| Lee | 5,165 | 68.19% | 2,409 | 31.81% | 2,756 | 36.39% | 7,574 |
| Leflore | 5,589 | 93.63% | 380 | 6.37% | 5,209 | 87.27% | 5,969 |
| Lincoln | 6,750 | 93.92% | 437 | 6.08% | 6,313 | 87.84% | 7,187 |
| Lowndes | 6,135 | 92.01% | 533 | 7.99% | 5,602 | 84.01% | 6,668 |
| Madison | 3,283 | 92.90% | 251 | 7.10% | 3,032 | 85.80% | 3,534 |
| Marion | 5,469 | 91.55% | 505 | 8.45% | 4,964 | 83.09% | 5,974 |
| Marshall | 2,251 | 86.78% | 343 | 13.22% | 1,908 | 73.55% | 2,594 |
| Monroe | 5,627 | 85.10% | 985 | 14.90% | 4,642 | 70.21% | 6,612 |
| Montgomery | 3,181 | 95.53% | 149 | 4.47% | 3,032 | 91.05% | 3,330 |
| Neshoba | 5,431 | 94.88% | 293 | 5.12% | 5,138 | 89.76% | 5,724 |
| Newton | 4,735 | 95.21% | 238 | 4.79% | 4,497 | 90.43% | 4,973 |
| Noxubee | 1,980 | 96.59% | 70 | 3.41% | 1,910 | 93.17% | 2,050 |
| Oktibbeha | 3,795 | 90.68% | 390 | 9.32% | 3,405 | 81.36% | 4,185 |
| Panola | 4,002 | 90.65% | 413 | 9.35% | 3,589 | 81.29% | 4,415 |
| Pearl River | 4,009 | 84.51% | 735 | 15.49% | 3,274 | 69.01% | 4,744 |
| Perry | 1,775 | 86.42% | 279 | 13.58% | 1,496 | 72.83% | 2,054 |
| Pike | 6,418 | 92.20% | 543 | 7.80% | 5,875 | 84.40% | 6,961 |
| Pontotoc | 2,699 | 79.36% | 702 | 20.64% | 1,997 | 58.72% | 3,401 |
| Prentiss | 2,289 | 69.32% | 1,013 | 30.68% | 1,276 | 38.64% | 3,302 |
| Quitman | 2,065 | 86.01% | 336 | 13.99% | 1,729 | 72.01% | 2,401 |
| Rankin | 7,541 | 95.78% | 332 | 4.22% | 7,209 | 91.57% | 7,873 |
| Scott | 4,729 | 95.21% | 238 | 4.79% | 4,491 | 90.42% | 4,967 |
| Sharkey | 1,116 | 89.71% | 128 | 10.29% | 988 | 79.42% | 1,244 |
| Simpson | 4,949 | 94.81% | 271 | 5.19% | 4,678 | 89.62% | 5,220 |
| Smith | 4,045 | 94.44% | 238 | 5.56% | 3,807 | 88.89% | 4,283 |
| Stone | 1,776 | 90.84% | 179 | 9.16% | 1,597 | 81.69% | 1,955 |
| Sunflower | 4,127 | 94.27% | 251 | 5.73% | 3,876 | 88.53% | 4,378 |
| Tallahatchie | 3,126 | 92.46% | 255 | 7.54% | 2,871 | 84.92% | 3,381 |
| Tate | 2,390 | 89.41% | 283 | 10.59% | 2,107 | 78.83% | 2,673 |
| Tippah | 2,482 | 71.82% | 974 | 28.18% | 1,508 | 43.63% | 3,456 |
| Tishomingo | 1,934 | 66.44% | 977 | 33.56% | 957 | 32.88% | 2,911 |
| Tunica | 945 | 90.52% | 99 | 9.48% | 846 | 81.03% | 1,044 |
| Union | 2,939 | 70.38% | 1,237 | 29.62% | 1,702 | 40.76% | 4,176 |
| Walthall | 3,014 | 95.14% | 154 | 4.86% | 2,860 | 90.28% | 3,168 |
| Warren | 7,409 | 81.96% | 1,631 | 18.04% | 5,778 | 63.92% | 9,040 |
| Washington | 5,611 | 73.68% | 2,004 | 26.32% | 3,607 | 47.37% | 7,615 |
| Wayne | 3,539 | 92.77% | 276 | 7.23% | 3,263 | 85.53% | 3,815 |
| Webster | 2,884 | 92.41% | 237 | 7.59% | 2,647 | 84.81% | 3,121 |
| Wilkinson | 1,473 | 93.46% | 103 | 6.54% | 1,370 | 86.93% | 1,576 |
| Winston | 3,922 | 94.30% | 237 | 5.70% | 3,685 | 88.60% | 4,159 |
| Yalobusha | 2,385 | 90.20% | 259 | 9.80% | 2,126 | 80.41% | 2,644 |
| Yazoo | 4,801 | 95.92% | 204 | 4.08% | 4,597 | 91.85% | 5,005 |
| Totals | 356,528 | 87.14% | 52,618 | 12.86% | 303,910 | 74.28% | 409,146 |
References
- ^ Bullock, Charles S. and Gaddie, Ronald Keith; The Triumph of Voting Rights in the South, pp. 31-33 ISBN 0806185309
- ^ Crespino, Joseph; In Search of Another Country: Mississippi and the Conservative Counterrevolution, p. 206 ISBN 0691122091
- ^ Mitchell, Dennis J.; A New History of Mississippi; p. 453 ISBN 1617039764
- ^ a b 'Mississippi Ousts House Democrat: Goldwater Carries the State by Crushing Plurality'; The New York Times, November 4, 1964, p. 11
- ^ a b c Harris, Louis; 'Mississippi Vote Points Up Power Of Local Emotions: Johnson Job Ratings'; The New York Times, November 23, 1964, p. A2
- ^ Asch, Chris Myers; The Senator and the Sharecropper: The Freedom Struggles of James O. Eastland and Fannie Lou Hamer, p. 190 ISBN 0807878057
- ^ McGuire, Danielle L. and Dittmer, John; Freedom Rights: New Perspectives on the Civil Rights Movement, p. 125 ISBN 081313448X
- ^ 'State Editors Speak Out'; Holmes County Herald, July 30, 1964, p. 2
- ^ Davies, David Randall; The Press and Race: Mississippi Journalists Confront the Movement, p. 221 ISBN 1578063426
- ^ Rohler, Lloyd Earl; George Wallace: Conservative Populist, p. 40 ISBN 0313311196
- ^ a b McKee, Don; 'Governors See Barry Slipping In South as Conference Opens: Johnson Gains in Louisiana', The Washington Post, October 13, 1964, p. A@
- ^ Manly, Chesly; 'Goldwater Landslide Seen in Mississippi: Many in Office Believe He'll Poll Seventy Percent'; Chicago Tribune, August 12, 1964, pp. 1, 6
- ^ 'Expert Sees Barry Winning Just Ala., Miss.', The Boston Globe, November 1, 1964, p. 51
- ^ Katagiri, Yasuhiro; The Mississippi State Sovereignty Commission: Civil Rights and States' Rights, p. 203 ISBN 1604730080
- ^ Thernstrom, Stephan and Thernstrom, Abigail; America in Black and White: One Nation, Indivisible, p. 151 ISBN 1439129096
- ^ Donaldson, Gary; Liberalism's Last Hurrah: The Presidential Campaign of 1964; p. 190 ISBN 1510702369
- ^ Burnham, Walter Dean; 'American Voting Behavior and the 1964 Election', Midwest Journal of Political Science, Vol. 12, No. 1 (Feb., 1968), p. 34
- ^ "1964 Presidential Election Statistics". Dave Leip's Atlas of U.S. Presidential Elections. Retrieved 2018-03-05.
- ^ a b "1964 Presidential General Election Results – Mississippi". Retrieved June 9, 2016.
- ^ Phillips, Kevin P.; The Emerging Republican Majority, pp. 208, 210 ISBN 9780691163246
- ^ Thomas, G. Scott; The Pursuit of the White House: A Handbook of Presidential Election Statistics and History, p. 403 ISBN 0313257957
- ^ Sullivan, Robert David; ‘How the Red and Blue Map Evolved Over the Past Century’; America Magazine in The National Catholic Review; June 29, 2016
Notes
- ^ In Alabama, Goldwater was opposed by a slate of unpledged Democratic electors who would not have voted for President Johnson had they carried the state.
- ^ The highest percentage in any county in a presidential election since occurred in 2012 in King County, Texas, where Mitt Romney received 139 votes to Barack Obama's five.


