
Membership statistics of the Church of Jesus Christ of Latter-day Saints (United States)
This page shows membership statistics of The Church of Jesus Christ of Latter-day Saints within the United States.
- Official LDS Membership - Membership count on record provided by the Church of Jesus Christ of Latter-day Saints. These records include adults and children, and also include both active and less active members.
- From religious surveys - General religious surveys conducted within the United States. These surveyed U.S. adults about their religious beliefs.
Official LDS Membership
Membership reported by The Church of Jesus Christ of Latter-day Saints on January 1, 2016[1]
was used to determine the number of members in each state.[2][3][4] The United States Census Bureau July 1, 2015 population estimates was used as the basis for the general population.[5]
Maps
-
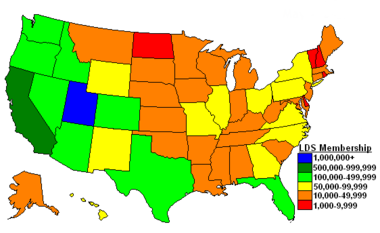 Official Latter-day Saint membership by state as of January 1, 2012
 -
 Percent of general population that are Latter-day Saints as of January 1, 2012
 -
 LDS Membership as Percentage of Population in 2000


Table
Each state link gives a brief history and additional membership information for that state.
| State | Membership | Population | % LDS | Stakes [6] | Districts [6] | Wards [7] | Branches [7] | Total Congregations | Missions | Temples | Family History Centers |
|---|---|---|---|---|---|---|---|---|---|---|---|
| Alabama | 36,874 | 4,858,979 | 0.75% | 7 | 42 | 33 | 77 | 1 | 1 | 40 | |
| Alaska | 33,649 | 738,432 | 4.55% | 8 | 55 | 28 | 86 | 1 | 1 | 15 | |
| Arizona | 418,959 | 6,828,065 | 6.13% | 102 | 719 | 86 | 844 | 6 | 5 | 66 | |
| Arkansas | 30,447 | 2,978,204 | 1.02% | 7 | 38 | 26 | 67 | 1 | 21 | ||
| California | 773,762 | 39,144,818 | 1.97% | 156 | 1,184 | 164 | 1,367 | 19 | 7 | 183 | |
| Colorado | 151,580 | 5,456,574 | 2.77% | 34 | 272 | 31 | 311 | 4 | 1 | 55 | |
| Connecticut | 15,752 | 3,590,886 | 0.43% | 3 | 28 | 5 | 35 | 9 | |||
| Delaware | 5,239 | 945,934 | 0.55% | 2 | 9 | 3 | 12 | 3 | |||
| District of Columbia | 2,624 | 672,228 | 0.39% | 2 | 1 | 3 | |||||
| Florida | 152,217 | 20,271,272 | 0.75% | 30 | 186 | 50 | 241 | 5 | 2 | 69 | |
| Georgia | 83,628 | 10,214,860 | 0.81% | 16 | 111 | 40 | 151 | 3 | 1 | 42 | |
| Hawaii | 73,740 | 1,431,603 | 5.15% | 16 | 124 | 11 | 138 | 1 | 2 | 25 | |
| Idaho | 437,106 | 1,654,930 | 26.41% | 127 | 999 | 82 | 1,117 | 4 | 4 | 63 | |
| Illinois | 56,920 | 12,859,995 | 0.44% | 12 | 93 | 34 | 130 | 3 | 2 | 36 | |
| Indiana | 44,071 | 6,619,680 | 0.66% | 11 | 68 | 31 | 100 | 1 | 1 | 29 | |
| Iowa | 27,675 | 3,123,899 | 0.88% | 7 | 41 | 28 | 69 | 1 | 30 | ||
| Kansas | 37,099 | 2,911,641 | 1.27% | 7 | 55 | 20 | 78 | 1 | 25 | ||
| Kentucky | 34,491 | 4,425,092 | 0.77% | 7 | 44 | 33 | 78 | 1 | 1 | 23 | |
| Louisiana | 29,772 | 4,670,724 | 0.63% | 6 | 34 | 19 | 54 | 1 | 1 | 13 | |
| Maine | 10,966 | 1,329,328 | 0.82% | 2 | 17 | 10 | 26 | 11 | |||
| Maryland | 43,387 | 6,006,401 | 0.72% | 8 | 67 | 14 | 81 | 2 | 1 | 13 | |
| Massachusetts | 27,055 | 6,794,422 | 0.39% | 4 | 39 | 13 | 52 | 1 | 1 | 12 | |
| Michigan | 44,206 | 9,922,576 | 0.44% | 8 | 1 | 62 | 33 | 94 | 2 | 1 | 41 |
| Minnesota | 32,321 | 5,489,594 | 0.58% | 8 | 52 | 23 | 76 | 1 | 1 | 24 | |
| Mississippi | 21,770 | 2,992,333 | 0.72% | 4 | 28 | 16 | 44 | 1 | 16 | ||
| Missouri | 69,454 | 6,083,672 | 1.14% | 17 | 111 | 37 | 152 | 2 | 2 | 46 | |
| Montana | 49,597 | 1,032,949 | 4.80% | 11 | 83 | 41 | 123 | 1 | 1 | 48 | |
| Nebraska | 24,855 | 1,896,190 | 1.31% | 4 | 40 | 20 | 60 | 1 | 1 | 18 | |
| Nevada | 182,125 | 2,890,845 | 6.30% | 37 | 300 | 28 | 330 | 3 | 2 | 29 | |
| New Hampshire | 8,246 | 1,330,608 | 0.61% | 3 | 15 | 4 | 19 | 1 | 6 | ||
| New Jersey | 33,352 | 8,958,013 | 0.37% | 6 | 37 | 24 | 63 | 1 | 18 | ||
| New Mexico | 69,896 | 2,085,109 | 3.35% | 14 | 95 | 47 | 143 | 2 | 1 | 31 | |
| New York | 81,132 | 19,795,791 | 0.40% | 16 | 1 | 90 | 59 | 150 | 4 | 2 | 53 |
| North Carolina | 83,829 | 10,042,802 | 0.83% | 17 | 119 | 35 | 154 | 2 | 1 | 46 | |
| North Dakota | 11,195 | 756,927 | 1.47% | 3 | 12 | 9 | 22 | 1 | 1 | 7 | |
| Ohio | 60,971 | 11,613,423 | 0.52% | 13 | 99 | 26 | 126 | 3 | 1 | 42 | |
| Oklahoma | 47,044 | 3,911,338 | 1.20% | 8 | 63 | 23 | 88 | 2 | 1 | 26 | |
| Oregon | 153,633 | 4,028,977 | 3.81% | 35 | 253 | 50 | 306 | 3 | 2 | 65 | |
| Pennsylvania | 51,336 | 12,802,503 | 0.40% | 12 | 80 | 26 | 111 | 2 | 42 | ||
| Rhode Island | 4,034 | 1,056,298 | 0.38% | 6 | 2 | 8 | 1 | ||||
| South Carolina | 39,894 | 4,896,146 | 0.81% | 6 | 53 | 15 | 68 | 1 | 1 | 19 | |
| South Dakota | 10,422 | 858,469 | 1.21% | 2 | 1 | 10 | 23 | 34 | 11 | ||
| Tennessee | 49,576 | 6,600,299 | 0.75% | 11 | 74 | 28 | 105 | 2 | 2 | 30 | |
| Texas | 341,022 | 27,469,114 | 1.24% | 69 | 3 | 488 | 132 | 635 | 8 | 4 | 111 |
| Utah | 2,040,178 | 2,995,919 | 68.09% | 579 | 1 | 4,589 | 327 | 4,971 | 9 | 16 | 152 |
| Vermont | 4,596 | 626,042 | 0.73% | 1 | 8 | 4 | 12 | 6 | |||
| Virginia | 94,528 | 8,382,993 | 1.12% | 20 | 164 | 33 | 197 | 3 | 36 | ||
| Washington | 284,631 | 7,170,351 | 3.96% | 59 | 475 | 68 | 549 | 7 | 3 | 79 | |
| West Virginia | 16,959 | 1,844,128 | 0.91% | 4 | 25 | 12 | 36 | 1 | 14 | ||
| Wisconsin | 26,161 | 5,771,337 | 0.45% | 6 | 42 | 26 | 68 | 1 | 24 | ||
| Wyoming | 67,680 | 586,107 | 11.54% | 17 | 137 | 18 | 157 | 37 |
Territories
| State | Membership | Population | % LDS | Stakes [6] | Districts [6] | Wards [7] | Branches [7] | Total Congregations | Missions | Temples |
|---|---|---|---|---|---|---|---|---|---|---|
| American Samoa | 16,149 | 54,343 | 29.71% | 4 | 31 | 5 | 36 | |||
| Guam | 2,295 | 161,785 | 1.41% | 1 | 4 | 4 | 1 | |||
| Northern Mariana Islands | 793 | 52,344 | 1.51% | 1 | 1 | |||||
| Puerto Rico | 23,191 | 3,474,182 | 0.66% | 5 | 27 | 14 | 41 | 1 | ||
| Virgin Islands (US) | 599 | 103,574 | 0.57% | 2 | 2 |
From religious surveys
The American Religious Identification Survey (ARIS) 2001 was based on a random digit-dialed telephone survey of 50,281 American adults in the continental U.S.[8] Its findings are found on the map below on the left.
The Pew Forum on Religion & Public Life published a survey of 35,556 adults living in the United States that was conducted in 2007.[9] These results are found on the map below on the right. Note: some less populated states were combined in this survey. These include:Montana-Wyoming,D.C.-Maryland, North & South Dakota, New Hampshire-Vermont, and Connecticut-Rhode Island.
Maps
 |
.PNG) |
2007 Pew Forum on Religion & Public Life
The 2007 Pew Forum on Religion & Public Life survey, conducted by Princeton Survey Research Associates International (PSRAI), found 1.7% of the U.S. adult population self identified themselves as Mormon.[10] The table below lists a few significant findings, from the survey, about Mormons.
| Demographic[10] | Mormons (U.S.) | U.S. Avg. |
|---|---|---|
| Married | 71% | 54% |
| Divorced or separated | 9% | 12% |
| 3 or more children at home | 21% | 9% |
| Weekly (or more) Attendance at Religious Services | 76% | 39% |
See also
References
- ^ Mormon Newsroom Facts and Statistics, 2015
- ^ "LDS Church News - Almanac". Retrieved 14 February 2015.
- ^ "United States - LDS Statistics and Church Facts - Total Church Membership". www.mormonnewsroom.org. Retrieved 14 February 2015.
- ^ Deseret News Church Almanac, 2013.
- ^ U.S. Census Bureau - Population Division. "State Totals: Vintage 2012 - U.S Census Bureau". Retrieved 14 February 2015.
- ^ a b c d LDS Stake & Ward Web Site Search.
- ^ a b c d "LDS Maps". Retrieved 14 February 2015.
- ^ "The Graduate Center, CUNY - Page Not Found". Retrieved 14 February 2015.
{{cite web}}: Cite uses generic title (help) - ^ "Religion in American Culture -- Pew Forum on Religion & Public Life". Retrieved 14 February 2015.
- ^ a b Portrait of Mormons in the U.S., Pew Forum on Religion & Public Life, July 24, 2009
The Church of Jesus Christ of Latter-day Saints statistical information | ||
|---|---|---|
| Worldwide membership | ||
| Statistics by geography | ||
The Church of Jesus Christ of Latter-day Saints in North America | |||||||||||||
|---|---|---|---|---|---|---|---|---|---|---|---|---|---|
| Countries/ Territories |  | ||||||||||||
| Temples |
| ||||||||||||
| |||||||||||||