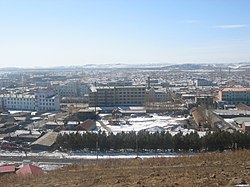
Oroqen Autonomous Banner
Appearance
Oroqen Banner
鄂伦春旗 • ᠣᠷᠴᠣᠨ ᠤᠬᠣᠰᠢᠭᠤ | |
|---|---|
| Oroqen Autonomous Banner 鄂伦春自治旗 ᠣᠷᠴᠣᠨ ᠤᠥᠪᠡᠷᠲᠡᠭᠡᠨᠵᠠᠰᠠᠬᠤᠬᠣᠰᠢᠭᠤ | |
 | |
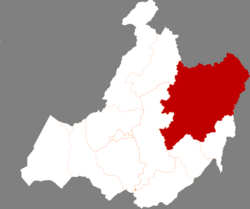
 Location in Hulunbuir | |
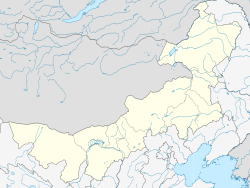
| Coordinates: 50°35′N 123°43′E / 50.583°N 123.717°E | |
| Country | People's Republic of China |
| Region | Inner Mongolia |
| Prefecture-level city | Hulunbuir |
| Area | |
| • Total | 60,378 km2 (23,312 sq mi) |
| Population (2020) | |
| • Total | 174,023 |
| • Density | 2.9/km2 (7.5/sq mi) |
| Time zone | UTC+8 (China Standard) |
Oroqen Autonomous Banner (Mongolian: ᠣᠷᠴᠣᠨ ᠤ ᠥᠪᠡᠷᠲᠡᠭᠡᠨ ᠵᠠᠰᠠᠬᠤ ᠬᠣᠰᠢᠭᠤ, Orčon-u öbertegen jasaqu qosiɣu, Mongolian Cyrillic: Орчон өөртөө засах хошуу; Simplified Chinese: 鄂伦春自治旗, Pinyin: Èlúnchūn Zìzhìqí) is an autonomous banner that lies directly south of the urban district of Hailar in the prefecture-level city of Hulunbuir.[1] It covers an area of 60,378 square kilometres (23,312 sq mi). As of the 2010 census[update], there were 223,752 inhabitants with a population density of 4.84 inhabitants per km2. Its capital is the town of Alihe (阿里河镇).[2] It includes Ganhe (甘河), Dayangshu (大杨树), Jiwen (吉文) but excludes the Jiagedaqi and Songling Districts.


Ethnic groups in Oroqen Autonomous Banner, 2000 census
| Nationality | Population | Percentage |
|---|---|---|
| Han | 257,861 | 88.28% |
| Mongols | 12,045 | 4.12% |
| Manchu | 8,743 | 2.99% |
| Daur | 6,379 | 2.18% |
| Evenks | 3,155 | 1.08% |
| Oroqen | 2,050 | 0.7% |
| Hui | 1,038 | 0.36% |
| Korean | 633 | 0.22% |
| Xibe | 54 | 0.02% |
| Russians | 37 | 0.01% |
| Others | 102 | 0.04% |
Climate
| Climate data for Oroqen Autonomous Banner (1981−2010) | |||||||||||||
|---|---|---|---|---|---|---|---|---|---|---|---|---|---|
| Month | Jan | Feb | Mar | Apr | May | Jun | Jul | Aug | Sep | Oct | Nov | Dec | Year |
| Record high °C (°F) | −0.7 (30.7) |
6.4 (43.5) |
18.4 (65.1) |
29.0 (84.2) |
34.8 (94.6) |
40.5 (104.9) |
37.2 (99.0) |
36.0 (96.8) |
31.9 (89.4) |
26.5 (79.7) |
13.6 (56.5) |
0.4 (32.7) |
40.5 (104.9) |
| Mean daily maximum °C (°F) | −14.2 (6.4) |
−8.1 (17.4) |
−0.1 (31.8) |
10.3 (50.5) |
18.9 (66.0) |
24.4 (75.9) |
25.7 (78.3) |
23.9 (75.0) |
17.9 (64.2) |
8.2 (46.8) |
−5.2 (22.6) |
−14.0 (6.8) |
7.3 (45.1) |
| Daily mean °C (°F) | −22.0 (−7.6) |
−17.4 (0.7) |
−8.4 (16.9) |
2.8 (37.0) |
10.9 (51.6) |
16.8 (62.2) |
19.3 (66.7) |
16.9 (62.4) |
9.7 (49.5) |
0.5 (32.9) |
−12.6 (9.3) |
−21.0 (−5.8) |
−0.4 (31.3) |
| Mean daily minimum °C (°F) | −27.9 (−18.2) |
−24.7 (−12.5) |
−16.2 (2.8) |
−4.4 (24.1) |
2.4 (36.3) |
9.2 (48.6) |
13.5 (56.3) |
11.3 (52.3) |
3.3 (37.9) |
−5.6 (21.9) |
−18.4 (−1.1) |
−26.3 (−15.3) |
−7.0 (19.4) |
| Record low °C (°F) | −40.3 (−40.5) |
−39.6 (−39.3) |
−31.8 (−25.2) |
−21.7 (−7.1) |
−8.4 (16.9) |
−4.2 (24.4) |
1.7 (35.1) |
−1.3 (29.7) |
−7.9 (17.8) |
−23.6 (−10.5) |
−34.3 (−29.7) |
−40.2 (−40.4) |
−40.3 (−40.5) |
| Average precipitation mm (inches) | 3.7 (0.15) |
2.6 (0.10) |
6.7 (0.26) |
20.3 (0.80) |
34.7 (1.37) |
98.2 (3.87) |
175.9 (6.93) |
128.1 (5.04) |
52.3 (2.06) |
19.6 (0.77) |
9.1 (0.36) |
6.9 (0.27) |
558.1 (21.98) |
| Average relative humidity (%) | 69 | 64 | 56 | 52 | 51 | 70 | 80 | 80 | 73 | 62 | 67 | 72 | 66 |
| Source: China Meteorological Data Service Center[3] | |||||||||||||
References
- ^ Naeher, Carsten; Stary, Giovanni; Weiers, Michael (2002). Proceedings of the First International Conference on Manchu-Tungus Studies, Bonn, August 28-September 1, 2000: Trends in Tungusic and Siberian linguistics. Otto Harrassowitz Verlag. pp. 112–113. ISBN 978-3-447-04628-2.
- ^ Cope, Lida (2014-06-03). Applied Linguists Needed: Cross-disciplinary Networking in Endangered Language Contexts. Routledge. p. 75. ISBN 978-1-317-97805-3.
- ^ 中国地面气候标准值月值(1981-2010) (in Simplified Chinese). China Meteorological Data Service Center. Retrieved 24 November 2022.

