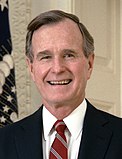
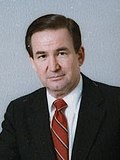
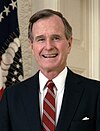
1992 Republican Party presidential primaries
| |||||||||||||||||||
2,209 delegates to the Republican National Convention 1,105 delegate[1] votes needed to win | |||||||||||||||||||
|---|---|---|---|---|---|---|---|---|---|---|---|---|---|---|---|---|---|---|---|
| |||||||||||||||||||
| |||||||||||||||||||
The 1992 Republican presidential primaries and caucuses were a series of electoral contests taking place within all 50 U.S. states and the District of Columbia occurring between February 18 to June 9, 1992. Sanctioned by the Republican Party, these elections are designed to select the 2,277 delegates to send to the national convention in Houston, Texas from August 17 to August 20, 1992, who selected the Republican Party's nominee for President of the United States in the 1992 election, incumbent president George H. W. Bush. The delegates also approved the party platform and vice-presidential nominee.
Primary race overview
President George H. W. Bush was challenged by conservative commentator Pat Buchanan, and during the early counting of the votes at the New Hampshire primary, it appeared that the President might actually lose. However, Buchanan faded by the end of the evening, and Bush won all the rest of the primaries. Bush's margins in many of the primaries were not as large as expected, and led to the rise of Ross Perot as an independent candidate.
Republican Louisiana State Representative and former Ku Klux Klan leader David Duke also ran in a number of primaries, but he did not receive any delegates. Former Governor Harold Stassen of Minnesota also made a quixotic bid for support in the Minnesota primary, winning enough votes to entitle him to one delegate, but was later denied his single vote by machinations at the Minnesota Republican Party's 1992 state convention.
New Hampshire primary
As Buchanan's candidacy relied heavily on a strong showing in the New Hampshire primary, President Bush made New Hampshire a focal point in his reelection bid. However, New Hampshire still remained a pivotal base for Buchanan's Primary campaign.
Because Bush was widely perceived to have broken his "read my lips" pledge, Buchanan found support in the economically battered and conservative state of New Hampshire. Making Bush's tax-hikes a central theme of his campaign, Buchanan enjoyed healthy grass-roots support despite lagging behind the President in pre-primary polling.
Bush countered the threat posed by Buchanan by touring New Hampshire himself. He memorably told an audience at an Exeter town hall: "Message: I care".[2] Some sources claim that this was the result of Bush mistakenly reading a cue card aloud.[3]
On Primary night, President Bush carried New Hampshire with 53% of the vote. Buchanan finished second with 38% of the vote.[4]
The rest of the race
Despite many in the Bush campaign attempting to push Buchanan out of the race, the strong showing made the Buchanan campaign hope for an outpouring of campaign contributions which galvanized the campaign into making efforts to pull out strong showings such as in the Georgia primary.
Despite an impressive showing, Buchanan's campaign never attracted serious opposition to President Bush in most contests. Most of Buchanan's "victories" were larger-than-expected showings that were still considered landslide Bush wins by most in the media. Still, the fact that Buchanan received more than two million votes nationwide prognosticated trouble for Bush in the general election.
Candidates
Nominee
Primary candidates
-
Former Presidential Advisor Pat Buchanan of Virginia
-
Comedian Pat Paulsen
-
Retired engineer Jack Fellure of West Virginia
Campaign finance
| Candidate | Campaign committee | |||||||
|---|---|---|---|---|---|---|---|---|
| Raised | Total contrib. | Ind. contrib. | Pres. pub. funds | Spent | ||||
| George H. W. Bush[a][5] | $104,974,415.00 | $31,802,276.00 | $31,711,102.00 | $65,898,513.00 | $107,637,852.00 | |||
| Pat Buchanan[6] | $14,933,082.00 | $7,232,943.00 | $7,206,793.00 | $5,351,770.00 | $14,591,679.00 | |||
| David Duke[7] | $372,146.00 | $221,854.00 | $221,945.00 | $0.00 | $457,449.00 | |||
| Jack Fellure[8] | $46,748.00 | $1,260.00 | $1,425.00 | $0.00 | $47,559.00 | |||
Results
| Date[9][10] | State/territory | Calculated delegates[11] | Type | Popular vote or equivalent | Estimated delegates | ||||
|---|---|---|---|---|---|---|---|---|---|
George H. W. Bush |
Pat Buchanan |
Other |
George H. W. Bush 1992 presidential campaign | Pat Buchanan 1992 presidential campaign | Other | ||||
| P | P | P | P | ||||||
| Feb 10 | Iowa | 0 | Caucus | No preference poll taken due to cancellation.[12] | Non-binding caucus with no delegates allocated. | ||||
| Feb 18 | New Hampshire | 23 | Primary | 92,271 (53.20%) | 65,106 (37.54%) | 3,779 (2.34%)[13] | 14 | 9 | 0 |
| Feb 19 | South Dakota | 22 | Primary | 30,964 (69.32%) | (Not on ballot) | 13,707 (30.68%)[b][14] | 14 | 0 | 5[c][15] |
| Mar 3 | Colorado | 37 | Primary | 132,049 (68.16%) | 58,730 (30.31%) | 2,957 (1.53%)[16] | 26 | 11 | 0[16] |
| Maryland | 42 | Primary | 168,898 (69.91%) | 72,701 (30.09%) | 0 (0.00%)[16] | 42 | 0 | 0[16] | |
| Georgia | 52 | Primary | 291,905 (64.30%) | 162,085 (35.70%) | 0 (0.00%)[17] | 52 | 0 | 0[16] | |
| Mar 7 | South Carolina | 36[18] | Primary | 99,558 (66.89%) | 38,247 (25.70%) | 11,035 (7.41%)[19] | 36 | 0 | 0 |
| Mar 10 | Florida | 99 | Primary | 607,522 | 285,074 | 0 | 67 | 32 | 0 |
| Louisiana | 41 | Primary | 83,747 | 36,526 | 14,841 | 25 | 11 | 5 | |
| Massachusetts | 40 | Primary | 176,868 | 74,797 | 24,182 | 28 | 12 | 0 | |
| Mississippi | 34 | Primary | 111,794 | 25,891 | 17,023 | 25 | 6 | 4 | |
| Oklahoma | 38 | Primary | 151,612 | 57,933 | 8,176 | 27 | 11 | 0 | |
| Rhode Island | 16 | Primary | 9,853 | 4,967 | 816 | 11 | 5 | 0 | |
| Tennessee | 49 | Primary | 178,216 | 54,585 | 12,849 | 38 | 11 | 0 | |
| Texas | 124 | Primary | 556,280 | 190,572 | 50,294 | 92 | 32 | 0 | |
| Mar 17 | Illinois | 88 | Primary | 634,588 | 186,915 | 9,637 | 68 | 20 | 0 |
| Michigan | 74 | Primary | 301,948 | 112,122 | 35,063 | 54 | 20 | 0 | |
| Mar 24 | Connecticut | 38 | Primary | 66,356 | 21,815 | 11,475 | 29 | 9 | 0 |
| Apr 5 | Puerto Rico | 20 | Primary | 260,200 | 1,031 | 2,104 | 20 | 0 | 0 |
| Apr 7 | Kansas | 31 | Primary | 132,131 | 31,494 | 49,571 | 21 | 5 | 0 |
| Minnesota | 34 | Primary | 84,841 | 32,094 | 15,821 | 25 | 9 | 0 | |
| New York | 103 | N/A | 1 | 0 | 0 | 103 | 0 | 0 | |
| Wisconsin | 37 | Primary | 364,507 | 78,516 | 39,225 | 30 | 7 | 0 | |
| Apr 28 | Pennsylvania | 92 | Primary | 774,865 | 233,912 | 0 | 71 | 21 | 0 |
| May 5 | District of Columbia | 13 | Primary | 4,265 | 970 | 0 | 11 | 2 | 0 |
| Delaware | 20 | Caucus | 1 | 0 | 0 | 20 | 0 | 0 | |
| Indiana | 52 | Primary | 374,666 | 92,949 | 0 | 42 | 10 | 0 | |
| North Carolina | 59 | Primary | 200,387 | 55,420 | 27,764 | 46 | 13 | 0 | |
| May 10 | Montana | 20 | Primary | 65,176 | 10,701 | 15,098 | 14 | 2 | 3 |
| May 12 | Nebraska | 27 | Primary | 156,346 | 25,847 | 9,905 | 23 | 4 | 0 |
| West Virginia | 19 | Primary | 99,994 | 18,067 | 6,096 | 16 | 3 | 0 | |
| May 19 | Oregon | 25 | Primary | 203,957 | 57,730 | 42,472 | 17 | 5 | 3 |
| Washington | 37 | Primary | 86,839 | 13,273 | 29,543 | 25 | 4 | 8 | |
| May 26 | Arkansas | 31 | Primary | 45,590 | 6,551 | 2,742 | 27 | 4 | 0 |
| Idaho | 23 | Primary | 73,297 | 15,167 | 27,038 | 15 | 3 | 5 | |
| Kentucky | 38 | Primary | 75,371 | 0 | 25,748 | 28 | 0 | 10 | |
| Jun 2 | Alabama | 41 | Primary | 122,703 | 12,588 | 29,830 | 33 | 0 | 8 |
| California | 203 | Primary | 1,587,369 | 568,892 | 0 | 149 | 54 | 0 | |
| New Jersey | 63 | Primary | 240,535 | 46,432 | 0 | 53 | 10 | 0 | |
| New Mexico | 27 | Primary | 55,522 | 7,871 | 23,574 | 19 | 0 | 8 | |
| North Dakota | 20 | Primary | 39,863 | 0 | 7,945 | 17 | 0 | 3 | |
| Ohio | 85 | Primary | 716,766 | 143,687 | 0 | 71 | 14 | 0 | |
| Date | State/territory | P | Type | Bush | Buchanan | Other | P | P | P |
| Calculated delegates | Popular vote or equivalent | Bush delegates | Buchanan delegates | Other delegates | |||||
Statewide
| George Bush | Pat Buchanan | Unpledged | David Duke | Ross Perot | Pat Paulsen | Maurice Horton | Harold Stassen | Jack Fellure | ||
|---|---|---|---|---|---|---|---|---|---|---|
| February 18 | New Hampshire | 53.20% | 37.54% | - | - | - | 0.35% | - | 0.12% | 0.02% |
| February 25 | South Dakota | 69.32% | - | 30.68% | - | - | - | - | - | - |
| March 3 | Colorado | 67.51% | 30.03% | - | - | - | - | - | - | - |
| March 3 | Georgia | 64.30% | 35.70% | - | - | - | - | - | - | - |
| March 3 | Maryland | 70.15% | 29.85% | - | - | - | - | - | - | - |
| March 7 | South Carolina | 66.89% | 25.70% | - | 7.09% | - | - | - | - | - |
| March 10 | Florida | 68.06% | 31.94% | - | - | - | - | - | - | - |
| March 10 | Louisiana | 61.98% | 27.03% | - | 8.85% | - | 0.88% | - | - | - |
| March 10 | Massachusetts | 65.58% | 27.73% | 3.76% | 2.06% | - | - | - | - | - |
| March 10 | Mississippi | 72.26% | 16.74% | - | 10.62% | - | - | - | - | - |
| March 10 | Oklahoma | 69.64% | 26.61% | - | 2.61% | - | - | - | - | - |
| March 10 | Rhode Island | 63.02% | 31.77% | 2.84% | 2.09% | - | - | - | - | - |
| March 10 | Tennessee | 72.55% | 22.22% | 2.04% | 3.14% | - | - | - | - | - |
| March 10 | Texas | 69.78% | 23.91% | 3.51% | 2.54% | - | - | - | - | - |
| March 17 | Illinois | 76.35% | 22.49% | - | - | - | - | 1.16% | - | - |
| March 17 | Michigan | 67.23% | 24.96% | 5.30% | 2.38% | - | - | - | - | - |
| March 24 | Connecticut | 66.71% | 21.93% | 9.06% | 2.31% | - | - | - | - | - |
| April 7 | Kansas | 61.98% | 14.77% | 16.63% | 1.80% | - | 2.40% | - | - | - |
| April 7 | Minnesota | 63.91% | 24.18% | 3.08% | - | 2.68% | - | - | 3.07% | - |
| April 7 | Wisconsin | 75.59% | 16.28% | 1.81% | 2.67% | - | - | - | 0.79% | - |
| April 28 | Pennsylvania | 76.71% | 23.16% | - | - | 0.14% | - | - | - | - |
| May 5 | D.C. | 81.47% | 18.53% | - | - | - | - | - | - | - |
| May 5 | Delaware | ?% | ?% | - | - | - | - | - | - | - |
| May 5 | Indiana | 80.12% | 19.88% | - | - | - | - | - | - | - |
| May 5 | North Carolina | 70.67% | 19.54% | 9.79% | - | - | - | - | - | - |
| May 10 | Montana | 71.64% | 11.76% | 16.60% | - | - | - | - | - | - |
| May 12 | Nebraska | 81.39% | 13.46% | - | 1.46% | - | - | - | - | - |
| May 12 | West Virginia | 80.54% | 14.55% | - | - | - | - | - | - | 4.91% |
| May 19 | Washington | 66.98% | 10.24% | - | 1.16% | 19.61% | - | - | - | - |
| May 19 | Oregon | 67.06% | 18.98% | - | 2.19% | - | - | - | - | - |
| May 26 | Idaho | 63.46% | 13.13% | 23.41% | - | - | - | - | - | - |
| May 26 | Kentucky | 74.54% | - | 25.46% | - | - | - | - | - | - |
| May 27 | Arkansas | 83.08% | 11.94% | 4.98% | - | - | - | - | - | - |
| June 2 | Alabama | 74.31% | 7.62% | 18.07% | - | - | - | - | - | - |
| June 2 | California | 73.62% | 26.38% | - | - | - | - | - | - | - |
| June 2 | Ohio | 83.30% | 16.70% | - | - | - | - | - | - | - |
| June 2 | New Jersey | 77.52% | 14.97% | - | - | 7.51% | - | - | - | - |
| June 2 | New Mexico | 63.84% | 9.05% | 27.11% | - | - | - | - | - | - |
| June 9 | North Dakota | 83.38% | - | - | - | 8.06% | 8.56% | - | - | - |
Nationwide
Popular vote result:[20]
- George H. W. Bush (inc.) - 9,199,463 (72.84%)
- Pat Buchanan - 2,899,488 (22.96%)
- David Duke - 287,383 (2.28%)
- Unpledged delegates - 119,115 (0.94%)
- Ross Perot - 56,136 (0.44%)
- Pat Paulsen - 10,984 (0.09%)
- Maurice Horton - 9,637 (0.08%)
- Harold Stassen - 8,099 (0.06%)
- Jack Fellure - 6,296 (0.05%)
See also
Notes
References
- ^ "Race for the nomination". Chicago Tribune. 11 March 1992. Archived from the original on 21 May 2019 – via Newspapers.com.
- ^ Dowd, Maureen (16 January 1992). "THE 1992 CAMPAIGN: REPUBLICANS; Immersing Himself in Nitty-Gritty, Bush Barnstorms New Hampshire". The New York Times.
- ^ NG Archived 2012-09-28 at the Wayback Machine
- ^ "Past New Hampshire Primary Election Results".
- ^ "STASSEN, HAROLD E."
- ^ "BUCHANAN, PATRICK J."
- ^ "DUKE, DAVID E."
- ^ "FELLURE, LOWELL JACKSON".
- ^ https://www.newspapers.com/clip/31773163/chicago_tribune/
- ^ "1992 Presidential Primary Calendar".
- ^ "Election calendar at a glance". The Times Leader. 14 February 1992. Archived from the original on 21 May 2019 – via Newspapers.com.
- ^ "THE 1992 CAMPAIGN: Iowa; HARKIN DOMINATES STATE'S CAUCUSES". The New York Times. 11 February 1992. Archived from the original on 16 January 2018 – via Newspapers.com.
- ^ "1992 New Hampshire Republican primary results". Archived from the original on 2017-12-13.
- ^ "1992 South Dakota Republican primary results". Archived from the original on 2019-05-14.
- ^ "Primary notes Delegate numbers set for parties". Argus-Leader. 26 February 1992. p. 3. Archived from the original on 21 May 2019 – via Newspapers.com.
- ^ a b c d e "Republican primaries March 3". Hartford Courant. 5 March 1992. p. 6. Archived from the original on 21 May 2019 – via Newspapers.com.
- ^ "1992 Georgia Republican primary full results".
- ^ "South Carolina Republican delegate count". Arizona Republic. 8 March 1992. p. 6. Archived from the original on 21 May 2019 – via Newspapers.com.
- ^ "1992 South Carolina Republican primary full results".
- ^ Our Campaigns - US President - R Primaries Race - Feb 01, 1992


