This is an archive of past discussions. Do not edit the contents of this page. If you wish to start a new discussion or revive an old one, please do so on the current talk page.
Given the collapse in polling of UKIP and Change UK, I think July 1 would be a most appropriate time to restart the table without their results given in their own columns. I would also move Plaid Cymru and SNP, not only for low polling particularly with PC, but because their national results are very much irrelevant and instead should be considered with the perspective of polling results in Wales and Scotland respectively. Onetwothreeip (talk) 09:03, 27 June 2019 (UTC)
I agree, though would keep SNP and PC. --Comment by Selfie City (talk about my contributions) 14:48, 27 June 2019 (UTC)
I'd keep CHUK and UKIP but not SNP and PC, for reasons I've already given in the last discussion. Mélencron (talk) 16:06, 27 June 2019 (UTC)
I'd prefer to remove SNP/PC over ChUK and UKIP as the former are often grouped together or excluded entirely from headline voting intentions while the latter are often listed (albeit with recent low proportions). Filinovich (talk) 16:10, 27 June 2019 (UTC)
But almost no one supports Change UK and UKIP anymore. They are little more than minor parties. (To be clear, as of June 30 I do not mean that we should remove them from past tables; they should just not be added in current or future tables.) --Comment by Selfie City (talk about my contributions) 16:23, 27 June 2019 (UTC)
If we remove Plaid Cymru and the SNP from the table, it should be throughout. Their noise-level national VI figures aren't new. I'd also support a new table that doesn't include Change UK and UKIP in principle—I'd be interested to see whether reliable sources have changed how they report headline figures. We should take our lead from those (though all else being equal, I support your proposal with the addition of removing PC/SNP figures from the UK/GB tables throughout). Ralbegen (talk) 17:05, 27 June 2019 (UTC)
I'm going to preface by noting that all pollsters still report results for all parties in their tables. That having been said, here's a table of pollsters (listed in reverse chronological order from most to least recent) for which parties mentions from the presentation of results for their most recent poll. Those with only pre-Euros numbers are listed below the dark bar.
Removing a party with 35 seats and potentially more makes absolutely no sense. If the argument is that they are not national then neither are labour or conservative - think Northern Ireland. If the argument is that theey are a small persentage then do not include ChUK, Ukip and any others that poll low. Be consistent - not partial.--Subsea (talk) 08:21, 1 July 2019 (UTC)
Significant numbers of users will continue to want separate listing for SNP and PC. I don't understand why separate listing would present serious inconvenience to users who do not want this information. Francis Waring (talk) 13:41, 1 July 2019 (UTC)
To clarify, I would remove SNP and PC columns for the entire national polling table, and start a new table without UKIP and ChUK columns. We could make that new table right now using existing data, but we can at least start it at July 1. Onetwothreeip (talk) 21:58, 27 June 2019 (UTC)
I'd prefer changes happen at year end. UKIPs disappearance has only been a month long, and surely nothing has changed since the decision to include SNP&PC? What's different with those now? CUK should probably not have been added in first place, and a good example of why we should wait longer before making changes. 86.183.35.158 (talk) 16:03, 28 June 2019 (UTC)
Well, Change UK could have done a lot better than it did. Those of us who made the tables couldn’t have predicted it’s performance. --Comment by Selfie City (talk about my contributions) 16:26, 28 June 2019 (UTC)
We should follow RS (so thanks to Mélencron for table). I also note that opinion polling tables for other countries often include large numbers of parties.
Looking at that table, we should drop Plaid Cymru (although we'll need footnotes for when the SNP figures is actually an SNP+PC figure). I can see an argument for dropping UKIP and ChUK, but pollsters are still persisting in highlighting them, so we need to too... at least for now. Happy for this to be watched closely and to move to excluding them when we see some more pollsters drop them (as seems likely will come in time). Bondegezou (talk) 16:29, 28 June 2019 (UTC)
I would also prefer changes to happen at the end of the year, but the middle of the year is the second best option. If UKIP or ChUK come back we could always restore the column.
The decisions to include SNP and PC were made differently. SNP was included because they were polling at a level similar to other minor parties that we were including at the time, but this was surely a mistake given the context of SNP polling. Plaid Cymru was introduced after barely any discussion because some of its results were combined into SNP. We can undo both of these actions.
Given that Change UK was polling above 10% multiple times, I have no regrets that we included them in the table. Onetwothreeip (talk) 22:05, 28 June 2019 (UTC)
Although there are other polling articles that have wider tables, this is normally because of seat projections and not reported polling responses, particularly where there is proportional representation. We should consider how polling organisations are presenting their information, but we are by no means bound by that and we can choose to display information the way we think is best for an encyclopaedia. I think we can agree this article should be simpler to read than what polling organisations publish. Onetwothreeip (talk) 22:05, 28 June 2019 (UTC)
I looked at some other polling tables and counted columns for parties with "reported polling responses". I am excluding seat projections. I looked at the European Union for roughly comparable democracies:
Austria: 7
Belgium: Flanders 8 and Wallonia 9 (+ 2 summary columns for those in government vs. out)
Bulgaria: 9
Croatia: 15 + undecided
Cyprus: 10
Czechia: 13 (+ 2 summary columns for those in government vs. out)
OK, bored now. It is apparent that many other polling tables on Wikipedia happily support large numbers of columns. With SNP, Plaid, ChUK and UKIP, we're on 10. This is comparable with the above. I don't see any design argument that we need to reduce.
Most countries use PR of some sort, which is weakly associated with higher numbers of effective parties. Greece only uses a hybrid, semi-PR system, so I looked at that as well: 14 party columns. India, using FPTP, only has 3 columns, and the US only 2. But it's not the voting system that matters: it's the number of parties having an impact. There are only two significant parties in the US; there are more in the UK.
I suggest we are bound to reflect how reliable sources present information, as per WP:BALANCE, WP:NPOV and WP:RS. I do not agree that "this article should be simpler to read than what polling organisations publish", at least not simpler than the summary level Mélencron looked at in the analysis above. Not showing a party is taking a position on that party's significance and we must be neutral. Bondegezou (talk) 16:21, 29 June 2019 (UTC)
I also agree that Wikipedia should reflect how RS treat which parties to include and also be given due weight, and that I don't agree with the editing philosophy in general of removing columns on the basis of how low some party happens to be polling, as long as they are still being included in most polls and their results are being reported on. For now, that situation does not appear to have changed with either UKIP or CHUK, and the only basis on which they should be removed is if pollsters stop prompting them entirely. The SNP/Plaid case is ambiguous (and I've argued both ways in the past) but I currently lean towards exclusion/retaining values in "others", because it is basically not possible for there to be significant movements in their vote share without massive changes in polling in either Scotland or Wales, though pollsters are mixed in whether to list them or not in their summaries (though all but one the most frequent pollsters do not do so). Mélencron (talk) 17:04, 29 June 2019 (UTC)
I think from Melencron's table above (thank you!) it looks like there's an RS case to remove SNP and PC from the tables (into the "other" column). I think it's also worth noting that the three most prolific political pollsters (YouGov, Opinium and Survation) don't include SNP/PC in their write-ups. Ralbegen (talk) 17:55, 29 June 2019 (UTC)
Okay, here's a summary of positions in this discussion so far[chart redacted from public view by SelfieCity due to concerns over canvassing]. @Absolutelypuremilk, Chessrat, Jontel, and TedEdwards:, as participants in past discussions as to whether to add parties, would you care to offer any input here? I think there's a fairly clear consensus to remove one or both of SNP/Plaid right now, but still divided on whether to remove UKIP/CHUK in the future. Mélencron (talk) 18:43, 29 June 2019 (UTC)
I'm happy to remove both SNP and Plaid. I think UKIP & CHUK should be removed at the end of the year, given that they were polling pretty highly earlier on in the year that's notable in itself. In contrast SNP & PC have been pretty steady throughout the whole Parliament. Absolutelypuremilk (talk) 18:47, 29 June 2019 (UTC)
One the basis that PC/ SNP are regional parties with inevitably low poll ceilings at national level, I would support putting them in All others at national level, but broken out for their own areas. CHUK and UKIP had a past which may be of interest to some. I think for now it would be helpful to locate the columns of the four major parties next to each other on the left, followed by the Greens, followed by CHUK and UKIP. That moves them out of the way. Perhaps, then, we can have a rule of dropping national parties from the table after a certain period of less than 5% scores. Jontel (talk) 19:19, 29 June 2019 (UTC)
As far as I'm concerned, the SNP is polling above CUK/UKIP, and Plaid is polling at the same level as them, so I'd support removing either all of them or none of them. It would look odd to have a table where parties on 0%/1% are included in the main columns, but a party on 4% (the SNP) is relegated to "others". My preferred solution would be new table on July 1 with only the five main parties by polling (Con, Lab, LD, Brexit, Green) in, leaving the current table for January to June as-is. Second-best option would be just continuing with the current table/columns. Chessrat(talk, contributions) 21:54, 29 June 2019 (UTC)
I really want to make it absolutely clear that this is about removing UKIP and ChUK from future tables, not tables that have previously existed. If we are to remove UKIP and ChUK by the end of the year, we might as well make a new table starting July 1 2019 which is surely the most natural way to split these tables after by calendar year. I don't mind whether or not we remove the SNP/PC data from already existing tables, but it's at least easier to set a new policy going forward. I think we can at least set up a new table format starting in July to see how it works. If the UKIP/ChUK parties make a resurgence in the polls, we could always create those columns again.
@Bondegezou and Mélencron: Counting how many columns other articles have is surely WP:OTHERSTUFFEXISTS. Those articles may very well be doing them wrong, and the United Kingdom general election polling series is the most prestigious we have. The main difference of course is the proportional representation. I agree that we should present information as reliable sources do, but when it's only polling that is giving any notice of UKIP or Change UK, that strongly indicates that they are unimportant parties on the basis of the non-polling media. Whatever poll results that we perceive as low are highly correlated to how the media considers those parties in importance. When we look at how reliable sources treat these parties, we should be looking at the entire news media landscape, not just polling organisations which take a statistical view. Onetwothreeip (talk) 02:51, 30 June 2019 (UTC)
@Mélencron: Just to be clear, I don't think that the case to remove UKIP/Change UK from future tables is here yet, though like others in the thread I think it's something to keep an eye on. So I'm a yes for that column for now. Ralbegen (talk) 10:45, 30 June 2019 (UTC)
Okay, thanks for clarifying. I think I agree that it's probably something that can be done in the future, but it hasn't been that long since the Euros yet and most pollsters are still including both of them, but I wouldn't be surprised if they get dropped by pollsters eventually if it's clear either/both have become nonentities or are not capable of standing candidates everywhere. Given the current views in this discussion, an outright majority seems to support removing columns for SNP/Plaid, so I'll probably take a look at that later – it should probably take a couple of hours or a little more to check for any potential errors. Mélencron (talk) 12:41, 30 June 2019 (UTC)
Absolutely astonished to see that the SNP and Plaid Cymru have been removed and lumped into an "others" category. This is plainly perverse given that the SNP in particular routinely poll significantly higher than two of the parties that have not been removed (UKIP and Change UK). I discovered a reference in the edit history to the supposed "strong consensus" in favour of removing the SNP and Plaid - well, please regard this contribution as weakening that "consensus". Nobody in this discussion has yet offered a single credible reason for removing the SNP while parties with far less support are not removed. The only plausible explanation for such a self-evidently irrational decision being rammed through is unthinking Anglocentricity. I'm not going to get involved in a flame war, but I look forward to this decision being reversed, as it inevitably must be sooner or later. Sofia9 (talk) 23:31, 30 June 2019 (UTC)
I fully agree there's a greater argument for including the SNP than for including UKIP+Change UK, and the former but not the latter being removed is... odd. There should be consistency in whether parties with minor polling results are included or not. Chessrat(talk, contributions) 01:59, 1 July 2019 (UTC)
Sofia9 This probably should have been explained better. SNP and Plaid Cymru polling results will remain in tables for results in Scotland and Wales respectively. There is no conspiracy to minimise the Scottish and Welsh sentiments of United Kingdom politics. Is this honestly a serious contribution to the discussion? It's actually in the interests of the SNP and Plaid Cymru for their polling results to be more clearly displayed in the regional tables, since 40% of Scotland is a more notable figure than 4% of Britain. Ralbegen I agree that we shouldn't remove UKIP and Change UK from the table, it's just about making a new table and not including them in that one. The new table can come into effect for results after July 1 2019. Onetwothreeip (talk) 08:54, 1 July 2019 (UTC)
I don't think that anybody's made a convincing RS-based case to create a new table excluding UKIP and Change UK yet, sorry. I think if Survation and Opinium stop including them in their result write-ups, that'd be a good time to stop including them. Ralbegen (talk) 09:07, 1 July 2019 (UTC)
Ralbegen Reliable sources are largely disregarding UKIP and Change UK. The only sources that are showing any regard for those parties are the polling organisations. I don't think anybody has argued that the results for UKIP and ChUK should be removed from the table altogether, just placed into the others column. Onetwothreeip (talk) 09:39, 1 July 2019 (UTC)
Which reliable sources? Media sponsors in their write-ups of the polling they've commissioned and other media coverage of polling? From Mélencron's excellent table of pollsters' presentations of results, only YouGov and NCP don't include them. If you look over newspaper coverage of polling results and it's clear that the Conservatives, Labour, Liberal Democrats, Green Party and the Brexit Party have their polling results covered substantially more than Change UK and UKIP, please present those results here and I'll happily be part of a consensus to start a new table which doesn't include columns for them. I think we have to follow reliable sources, so that has to be the bar. Ralbegen (talk) 09:59, 1 July 2019 (UTC)
The usual reliable sources such as newspapers and television news. Very little coverage of UKIP and Change UK, and almost no coverage of their polling results. The actual polling organisations are of course going to publish their own results, but that's not surprising. I could find you examples but just from memory I can remember news stories about Brexit Party leading in the polls, but I don't think there have been any stories focused on UKIP polling at 1% or 0%. Onetwothreeip (talk) 11:15, 1 July 2019 (UTC)
Five-column version mockup
If you came here because someone asked you to, or you read a message on another website, please note that this is not a majority vote, but instead a discussion among Wikipedia contributors. Wikipedia has policies and guidelines regarding the encyclopedia's content, and consensus (agreement) is gauged based on the merits of the arguments, not by counting votes.
However, you are invited to participate and your opinion is welcome. Remember to assume good faith on the part of others and to sign your posts on this page by adding ~~~~ at the end.
I've made a quick demonstration of what a five-column version of the table would look like for June. (Of course, if people did decide on this option, it would make more sense to start from July rather than June). Chessrat(talk, contributions)
Oppose Restore the SNP and Plaid Cymru. Sofia9 (talk) 23:35, 30 June 2019 (UTC)
Oppose. Restore SNP. Perverse to exclude a party that is the third largest in the House of Commons. Jmorrison230582 (talk) 06:34, 1 July 2019 (UTC)
Oppose. The SNP might be marginal in the minds of the collective anglosphere, but they are still the third largest party at Westminster and have a membership comparable to the Conservative party. Strange decision to limit the data in this way. SymonBanMacaulay (talk) 07:13, 1 July 2019 (UTC) — Note: An editor has expressed a concern that SymonBanMacaulay (talk • contribs) has been canvassed to this discussion.
Oppose. As above - if these are England only polls then fine, but to lump the 40% or whatever of Scottish SNP respondents into other is very misleading. There is no strong reason for reducing the number of columns. Btljs (talk) 07:18, 1 July 2019 (UTC)
Oppose.Restore the SNP and Plaid Cymru. It makes no sense to remove the SNP which currently holds 35 seats, and Plaid which holds more seats than either UKIP or Change UK.DACN (talk) 07:20, 1 July 2019 (UTC) — Note: An editor has expressed a concern that DACN (talk • contribs) has been canvassed to this discussion.
Oppose. Restore SNP. How can the UK's third largest party by seats and probably second largest party by members be classed as 'other'? This is embarrassing on the world stage. I would have thought that an opinion poll page should cover all opinion and any party that polls any figures should be included to give a full picture. There might be a new party formed next week that grows in popularity over the next 10 years. This page should reflect that and show the rise over time, otherwise the page is pointless. Crepusculous (talk) 08:27, 1 July 2019 (UTC) — Note: An editor has expressed a concern that Crepusculous (talk • contribs) has been canvassed to this discussion.
Oppose. Restore SNP. As the UK's third largest party by seats, the SNP are an important part of the story of opinion polling for the next UK general election. 91.151.10.54 (talk) 08:14, 1 July 2019 (UTC) — Note: An editor has expressed a concern that 91.151.10.54 (talk • contribs) has been canvassed to this discussion.
Support of course. Where did these these !votes in two hours from editors I've never seen before come from? Did some Scottish National Party forum get notified of this?
The proposed table does not include UKIP or Change UK, so there's no argument there. The polling tables for Scotland still include SNP, so the 40% of Scotland responding with support for SNP is very much represented on this article, but the 4% of Britain that does so is not particularly useful or relevant. It would actually be more misleading to have the SNP column in the main table, as its political influence is much greater than what any other political party with 4% of the national vote would have. The multiple instance of an argument about members is also quite suspicious, but also irrelevant. Onetwothreeip (talk) 08:54, 1 July 2019 (UTC)
"Editors I've never seen before". I've been an editor on here for many years, including on polling related articles. As for the substance of your argument: "its political influence is much greater than what any other political party with 4% of the national vote would have". Well that's tough. MPs are elected by constituency, and there are 59 in Scotland. As the SNP are currently the leading party in Scotland, they are likely to win most of those 59 seats. You might not like the electoral system that the UK has, but that's the reality of the position. In the Canadian federal election polling article that the Bloc Quebecois are included in the federal polls, even though they are a a "regional" party who presently control 10 seats in the Canadian House and are polling about ~5% for Canada as a whole. So where's the consistency? Jmorrison230582 (talk) 09:03, 1 July 2019 (UTC)
Likewise, the polling article for this year's Spanish election includes several "regional" (mainly Catalan) parties. The biggest of which got 3.9% of the vote (ERC). What rationale is being used for excluding the SNP? Jmorrison230582 (talk) 09:11, 1 July 2019 (UTC)
Your username is actually familiar to me, so I don't claim that I haven't seen you before. We're not accountable to how the Canadian and Spanish articles are designed, but I've argued that the Spanish polling articles should have fewer columns. The polling tables aren't about how many seats the party has, if any. It would be more reasonable to have a column for SNP in a table of seat projections rather than proportion of votes. I think we could have a column where SNP and Plaid are combined, but what's most important is that UKIP and Change UK columns are not restored upon making a new table starting with July results, so I would also agree to a table proposal that only omitted those two parties. Onetwothreeip (talk) 09:17, 1 July 2019 (UTC)
NO changes should be made unless the is consensus to change.
ATM the is NO to change, so dont change. ~ BOD ~ TALK 09:24, 1 July 2019 (UTC)
Are you saying that the RS-based discussion above isn't a consensus because a bunch of canvassed !votes have appeared? Responding to off-wiki partisan canvassing as if it's legitimate consensus-building rewards disruptive behaviour. There are editors with valuable contributions to make who weren't involved in the discussion above, including those who disagree with the proposed changes, like you, and those contributions are really valuable. But we should bear no heed to comments made following instructions on a blog post. Ralbegen (talk) 09:51, 1 July 2019 (UTC)
No, i cant speak for others. I have not involved in discussion above due to having very limited time due to external personal life issues, and i am afraid i am unable to respond further atm. ~ BOD ~ TALK 10:20, 1 July 2019 (UTC)
Like 182 others i watch this page. I would like to know what this accusation of canvasing is based on. More importantly my main concerns are ~ firstly that the discussion, both above the Five-column version mockup, together with the equally valid shorter responses & votes below it has only taken place over only 4 days, and that changes were being made without giving other editors sufficient time to contribute. Secondly I 'strongly oppose' the removal of the SNP from the main table (because not only that they are currently the 3rd largest party in parliament, they may could very possibly also have a significant role in any existing or future minority government situation. I also think it is too early to remove the other parties. ~ BOD ~ TALK 16:05, 1 July 2019 (UTC)
@Bodney: The accusation of canvassing is due to this publication of this blog post telling people to come and object, with instructions about how to do so, followed by a lot of activity opposing the changes, including from SPAs and single-purpose IPs. Ralbegen (talk) 07:47, 6 July 2019 (UTC)
Oppose Removal of SNP and Plaid Cymru from main table as per above. Onetwothreeip Wikipedia is open to all interested editors, this page does not belong to anyone. Lets have a proper RfC. ~ BOD ~ TALK 09:14, 1 July 2019 (UTC)
Bodney This page is not owned by any editor or by a group of editors either. Onetwothreeip (talk) 09:21, 1 July 2019 (UTC)
Correct, I am very glad you agree with me Onetwothreeip. This discussion only started on the 27th June, that is only 4 days ago. Big changes like removing the 3rd largest party from these tables, should only be made after a reasonable period of time, so that all interested editors, even those who have not been involved in the discussion previously may add their responses. Sudden changes make a page unstable. ~ BOD ~ TALK 14:08, 1 July 2019 (UTC)
Oppose I believe any party that is polled regularly should be included. It's not like there are too many columns anyway compared to other countries. --Gbuvn (talk) 09:17, 1 July 2019 (UTC)
Somebody has engaged in inappropriate WP:CANVASsing behaviour on a political blog, which explains some of the recent activity on this Talk page. Ralbegen (talk) 09:23, 1 July 2019 (UTC)
Clearly what should happen now is that the !votes should be withdrawn and this should be reverted to a simple discussion. I gave support to this proposal in the face of blatant canvassing but there are certainly potential changes that could be made to this proposal. It seems to be the good faith act of SelfieCity that scared somebody and turned what should have been a discussion into a survey. Onetwothreeip (talk) 09:30, 1 July 2019 (UTC)
Oppose. Restore SNP. They are the third largest party in the UK currently by seats and the sixth largest by share of voting intention for the next election. They also have a larger share of voting intention than both Change UK and UKIP which are in the table and on the graph.
The article for the next French presidential election shows polling for 15 different candidates, some of whom currently have less than 1% share of voting intention.
The article for opinion polling on the next Spanish general election shows polling for 11 different parties on the main graph.
The article for opinion polling on the next Portuguese legislative election shows two parties with a smaller share of voting intention than the SNP on the main graph.
The article for the next Swiss federal election shows two parties with a smaller share of voting intention than the SNP on the main graph of polling results.
If you take a look through this category on opinion polling for future elections, you will see that for almost every article there are 6 or more parties included in the main graph and/or table. For the articles that include less than 6 parties, you will see that the parties which hold the smallest share of voting intentions almost always hold a smaller share than the SNP in the article in question. I say almost, but in fact, I could not find a single party not included in the main graph and/or table which holds an equal or greater percentage of voting intention than the SNP.
Also, if we are going to add separate polling for certain countries, we should add a section for England as well. They are as much a country as any other. TagPro129 (talk) 10:03, 1 July 2019 (UTC)
Regarding England-only polling. There is some academic work (e.g. the "Future of England" survey, conducted by YouGov) done on an England-only basis, but commercial (i.e. for the media) polls are rarely done that way. I think it would only happen if the Scottish party system became completely separate, as in Northern Ireland, but the companies would likely then just poll on an "England and Wales" basis. Jmorrison230582 (talk) 11:01, 1 July 2019 (UTC)
I ran a few searches and couldn't find any England-only polling. In that case, I agree it would be pointless to add this section.TagPro129 (talk) 11:35, 1 July 2019 (UTC)
Oppose. As previously, plenty of polling tables have lots of columns and seem to work. UKIP, Change UK and SNP are still regularly covered in the reporting of polling, and in broader political reporting. That may change for ChUK and UKIP, but I don't see a need for change yet. There clearly isn't a consensus to drop any of the parties... with the exception perhaps of Plaid. I'm OK with dropping Plaid. Bondegezou (talk) 11:16, 1 July 2019 (UTC)
Oppose per all the previous arguments. Other polling tables have way more columns without problems, and they are all relevant parties. —Nightstallion 11:28, 1 July 2019 (UTC)
Oppose. Restore SNP. There really can be no justification for removing the data for the third largest party in the UK parliament.≈≈≈≈ — Preceding unsigned comment added by Bdw1948 (talk • contribs) 15:02, 1 July 2019 (UTC) — Note: An editor has expressed a concern that Bdw1948 (talk • contribs) has been canvassed to this discussion.
Oppose - The SNP are the third largest party in the UK parliament, perhaps we should lump the LibDems in with the "others". I can't see any value in deleting detailed stats and aggregating into an "Others" column for the UK. The table as it stood was perfectly readable. Teh klev (talk) 20:06, 4 July 2019 (UTC)
The arguments given to remove the SNP and PC from the UK/GB table are that:
Most pollsters don't include them in their results write-ups, including the three most prolific pollsters.
Variation in the UK/GB polling results for the SNP and PC don't tell the reader much about support for those two parties. Whether the SNP gets 2%, 3%, 4% or 5% doesn't actually reflect the level of support the SNP has, whereas their results in Scotland-only polls do. Ditto for Plaid Cymru getting 0% or 1% compared to their performance in Wales-only polling.
The argument given to include them (mainly specifically the SNP) are:
The SNP has more MPs than other parties that are included in the table.
The SNP has more members than other parties that are included in the table.
Opinion polling articles for future elections in other countries have lots of columns, so there's no need to reduce the number of columns here.
I hope that's a fair enough summary. I find the arguments to remove them from the table, which I amongst others have made in the discussion above, more convincing. Particularly the case that we need to follow reliable sources. I don't think that the number of MPs or members that a party has should be something we consider beyond how reliable sources report polling based on that kind of thing. I find the points about other countries' future election polling pages, made by Bondegezou and Jmorrison230582, are useful for telling us that there's no imperative to reduce the number of columns in the UK/GB table. But beyond that, I feel like it would be an WP:OSE argument to say that wide tables used elsewhere in the project means we shouldn't remove columns here where there's an otherwise good case to do so. Ralbegen (talk) 11:41, 1 July 2019 (UTC)
I'd have to agree with this assessment. I would just like to note two other points I've seen. SNP and PC are sometimes lumped together in even the results tables by RSes, which would somewhat suggest that these sources don't think these parties should have numbers reported separately. On the other side, I've seen the argument that the decision to remove is purely because of Anglocentrism gone mad, although this argument is largely without merit as PA. Filinovich (talk) 13:05, 1 July 2019 (UTC)
Ralbegen, I can't agree that you've summarised the arguments for inclusion fairly, because you've omitted the most important one of all - that the SNP's percentage support in GB-wide opinion polls is high enough to warrant inclusion, irrespective of how many MPs or rank-and-file members they have. Even if UKIP and Change UK are eventually removed, it should still be remembered that the SNP have often outpolled the Greens across GB in the past, and it's entirely possible (and arguably likely) that they will again at some point in the future. Sofia9 (talk) 13:39, 1 July 2019 (UTC)
@Sofia9: You're right, I did forget to include that, sorry! I continue to think that we should give columns to parties whose polling results are emphasised by reliable sources rather than setting a Talk page threshold for polling results. Whilst that may be necessary on some other pages (I think it happens fairly routinely on US polling articles?), I feel like that would be unnecessarily WP:ORy here. For the UK/GB right now, based on Melencron's table of polling company summaries above, UK/GB results for the SNP or PC are significantly less widely covered than the other parties, particularly accounting for the most prolific polling companies which comprise a majority of UK/GB polls on the page (YouGov, Survation and Opinium). I think any argument to include the SNP and Plaid Cymru in the UK/GB table has to be based on reliable source coverage. Ralbegen (talk) 14:02, 1 July 2019 (UTC)
@Sofia9: I would just note that if RSes start to exclude UKIP or ChUK from headline figures, I would be in favor of excluding them from the next table. As for SNP outpolling Greens, it's a bit WP:Crystal. Filinovich (talk) 14:42, 1 July 2019 (UTC)
In that case you'll be relieved to hear that we don't need a crystal ball - the SNP have outpolled the Greens within this calendar year. (I eagerly await you directing me to a "Wikipedia is not a history book" link or a "Wikipedia is not about what's going on in the present" link or a "look, just take it from me that Wikipedia isn't what you think it is" link.) Sofia9 (talk) 15:01, 1 July 2019 (UTC)
As long as the numbers are available and well sourced I see no reason why they shouldn't be reflected on the table. Anyone consulting the list should be able to find those numbers. Not including them just makes things more difficult for the end users of the article who will have to locate the numbers elsewhere.
David Hastings 13:31, 1 July 2019 (UTC) — Preceding unsigned comment added by DRHastings (talk • contribs) — Note: An editor has expressed a concern that DRHastings (talk • contribs) has been canvassed to this discussion.
@DRHastings: That isn't a reasonable argument on its own. As an admittedly weak analogy, YouGov often asks about WEP, but other sources tend not to, and it often isn't reported in the headline figures YouGov posts. While SNP and WEP definitely poll at very different proportions, it isn't worth getting into what threshold should be used to include/exclude a party. It's best to follow the format that RSes take. Further, because most sources do ask about National parties, footnotes have been made in the Others column that lists what proportion they received. The end user still has access to the values. There's still a graph for the lay user with SNP. Filinovich (talk) 14:43, 1 July 2019 (UTC)
The SNP and PC should be included separately. It seems ridiculous that the 3rd largest party (SNP) are grouped with ‘others’, this does not reflect accurately results of polling with them omitted. — Preceding unsigned comment added by Peeablo (talk • contribs) 14:40, 1 July 2019 (UTC) — Note: An editor has expressed a concern that Peeablo (talk • contribs) has been canvassed to this discussion.
After hearing all these arguments, it's a decent point that polling tables don't need to be restricted to a smaller number of columns (comparing to other elections throughout Europe)... and the SNP is the third-largest party by number of seats... so I think I'd change my position to yes, include SNP and PC. Chessrat(talk, contributions) 16:09, 1 July 2019 (UTC)
Support removing SNP & PC - The SNP are only contesting 8.7% of the available constituencies and PC only 6.1% and these are either UK or GB polls. while they are a significant deal in their countries they are not significant overall. if the Yorkshire Party put up candidates in each of the Yorkshire constituencies they'd be fielding more than PC and a few short of the SNP. would we start including them (assuming they win a seat or 3)? There is a section which deals with Scotland and a section which deals with Wales which when dealing with the SNP and PC which are far more informative than the national polls.=> Spudgfsh (Text Me!) 18:43, 1 July 2019 (UTC)
There is no need to remove the SNP, Scotland is still part of the UK so no need to leave the third-largest party in the UK out Wilbo101 (talk) 19:04, 1 July 2019 (UTC) — Note: An editor has expressed a concern that Wilbo101 (talk • contribs) has been canvassed to this discussion.
the point of this article is not about the number of MPs that a party has, it is about the level of support overall in the UK. The inclusion of the SNP and PC (and I'd say the same for Change UK) is that they, due to their regional nature, don't read across very well to overall VI polls.=> Spudgfsh (Text Me!) 19:11, 1 July 2019 (UTC)
Who decided this only one point of the page. Why should it be limited that point. The tables can be viewed in several ways. ~ BOD ~ TALK 20:31, 1 July 2019 (UTC)
Oppose removal of SNP and PC: the SNP are the third largest party in the commons, they cannot be excluded on any reasonable measure. I note that Bloc Québécoise are included at Opinion polling for the 2019 Canadian federal election. The template has plenty of space for multiple parties, although I can see some sense in removing UKIP and Change UK if we feel that it has become too large. Grinner (talk) 19:51, 1 July 2019 (UTC)
The arguments for excluding the SNP are ridiculous, such as IF there were a Yorkshire party they should not be included either. Well, there IS no 'Yorkshire Party', but IF there were one and it had Members of Parliament, then it should be included. ANY party that has Members of Parliament is in effect a 'national party' since Westminster is the NATIONAL parliament of the UK. I question including UKIP which HAS no MPs, however. But I see no legitimate reason for excluding the SNP or Plaid Cymru except pure Anglocentric bias. Wikipedia is supposed to be better than this. — Preceding unsigned comment added by 50.53.38.200 (talk) 21:01, 1 July 2019 (UTC)
There is a Yorkshire Party. Regardless, I don't see any reason why the number of MPs a party currently has should have any effect on whether it is included in a table of polling for a future election. By this argument, parties which are rarely, if ever, included in national polls, such as DUP, Sinn Fein, or even named Independents must be given a column in the table purely because they were able to get a seat sometime between the last election and now. I'm honestly tired of all the comments here saying there are no legitimate arguments on the other side when the commenters themselves clearly haven't even entertained any of the actual arguments. This isn't about Anglocentric bias. I couldn't care less which nations in the UK are most prominent. SNP and PlaidC should be excluded from the table, not because of some inherent prejudice I have, but because Reliable Sources don't report them in headline figures and will occasionally lump the two parties together as National. Filinovich (talk) 01:32, 2 July 2019 (UTC)
While we're correcting spurious inaccuracies, I should mention that Scotland and Wales are part of the Anglosphere too. Onetwothreeip (talk) 01:42, 2 July 2019 (UTC)
An Editor Fears that one side of the debate is trying to discredit the other side by repeated spurious claims of canvassing, and has given no substantial evidence to back this up. ~ BOD ~ TALK 08:18, 2 July 2019 (UTC)
The link to the blog post has been posted previously where the author asks readers to comment on this discussion, followed by several new or inactive editors commenting on the discussion, with the same perspective, purpose and arguments. Onetwothreeip (talk) 08:27, 2 July 2019 (UTC)
You'll notice I've only marked specific posts as canvassed. My only goal was to note which editors were likely to have come from that blog post due to incredible lack of edits. If they had more than a couple recent edits, I probably haven't tried to "discredit" them. Filinovich (talk) 10:31, 2 July 2019 (UTC)
Apologies not spurious, and i did not think to check recent activity. I still do not believe it is possible to know who came because of the blog and who came because they were watching. So personally I dont think they should be branded and disgarded as such. When the is a moot point like a RfC editors are often invited from several relevant Projects to get involved, because the more contributions can help make better decisions. I am unsure if a massive misdeed has been done here. ~ BOD ~ TALK 16:13, 2 July 2019 (UTC)
No worries. If the editors that I've marked object to it and can show they weren't canvassed, I have no issue removing the note. It's just to note that there is some concern that the person joined the discussion as a result of inappropriate canvassing. I doubt any users that have actually been canvassed will return to defend any of their arguments as most of them will have just come here to make the one post to vote and then let it slip from their minds. I imagine those who have come from other projects to participate in discussion will continue to productively do so. Filinovich (talk) 17:27, 2 July 2019 (UTC)
"If the editors that I've marked object to it and can show they weren't canvassed..." - That's an absurd statement. You'd be asking them to prove something that is literally impossible to prove. (Or are you going to require them to provide complete CCTV recordings of their movements over the last 48 hours?!) Sofia9 (talk) 01:07, 3 July 2019 (UTC)
@Sofia9: Perhaps I should have been more clear. Given that the only evidence I've seen to suggest most were canvassed is a lack of activity, I'd personally be satisfied by a reasonable explanation in most cases (e.g. User:Example messaged me, among other users, to participate in discussion) or even an actual attempt to contribute to discussion rather than rattle off a talking point that's been made already. I'm not asking for undeniable proof. Apologies for not clarifying that. Filinovich (talk) 11:29, 3 July 2019 (UTC)
I am not sure if anyone can request such confirmations from other editors, its not something I have witnessed before. ~ BOD ~ TALK 12:00, 3 July 2019 (UTC)
Oppose Bad idea for lots of reasons previously stated. But thanks. --Dweller (talk) Become old fashioned! 10:48, 2 July 2019 (UTC)
Oppose SNP has too may MPs to eliminate. In addition to reasons given above, 1% UK changes to SNP vote have a large impact on result of election. I ran + and - 1% change to SNP vote through the Electoral Calculus User-defined Prediction engine and roughly -1% SNP change results in -34 SNP MPs (thus others increase) and +1% SNP results in +19 SNP MPs. So by eliminating SNP we make our data much less useful in predicting possible election outcome. I personally think we should leave the table alone to the end of this year rather than changing mid-year. Rwendland (talk) 11:34, 2 July 2019 (UTC)
Electoral Calculus doesn't have the option for +/- 1% SNP at the national level, only in Scotland. Filinovich (talk) 11:50, 2 July 2019 (UTC)
You can create the effect by ticking the "Scotland prediction" box and upping/lowering the SNP "Scotland Support" by about 30% (the default has 3.1% national SNP support so 30% generates a rough 1% UK-wide change, which you can see in the Electoral Calculus prediction as it outputs SNP as % of UK) with corresponding rough opposite other party adjustments - I did say roughly above. My point wasn't to get accurate Electoral Calculus predictions, but to show SNP going up or down is very significant for the next GE outcome given our electoral system, so we should keep it in. Rwendland (talk) 14:16, 2 July 2019 (UTC)
I stand corrected. Though I would just note that much of the change in support for SNP between national polls is a result of sampling variance. There's no evidence from the current data that SNP's support has changed significantly since 2017 at the national level. I'm still in favor of listing the Scotland-only polls with SNP as the most prominent party because differences in numbers of those polls are often significant enough to rule out natural variance, SNP is never lumped with PC in those polls, and because of their large support in Scotland, they're always listed in headline figures by the pollster and reliable sources.
@Onetwothreeip: I wasn't aware of any canvassing - I've been a member since the mid noughties with a few thousand edits. I have been in a few of these types of discussion over the years and they tend to drive people into more and more entrenched positions. I agree that the number of people voting on one side or the other shouldn't necessarily dictate decision making. However, strength of feeling is valid and should be recognised - particularly when you are talking about representation of a group of people, the opinions of members of that group must surely carry more weight? Btljs (talk) 12:45, 2 July 2019 (UTC)
In the event that we decide to remove the SNP and PC (which I still think is the best idea) I do feel that this discussion is enough to show that there will be a constant battle to keep them off the table. This wikipedia is full of pages where a consensus was reached on a subject only for editors who weren't involved in the discussion or disagreed with the result to keep reverting the content. Regardless of my personal opinion on the matter I think removing the SNP and PC from these tables will be more trouble than it's worth. => Spudgfsh (Text Me!) 17:17, 2 July 2019 (UTC)
The battle seems only to be over the SNP, who we could conceivably keep in. There isn't such concern for Plaid Cymru, UKIP or Change UK. Onetwothreeip (talk) 06:36, 3 July 2019 (UTC)
Seriously? I really do not think anyone can draw that conclusion at this stage. Just because someone has not expressed an opinion either way on parts of the discussion, they can not be treated as a vote to support the removal of those parties. After treating no opinion is expressed as neither as a Support or a Object, the numbers supporting the status quo or no change are clearly higher than those wishing change. To make my position clear, I am for no removal of any party for a minimum to 2020, and certainly not for Plaid until after the next election. ~ BOD ~ TALK 12:00, 3 July 2019 (UTC)
The proposal isn't to remove Change UK or UKIP, in fact I am firmly against doing so. The proposal is to make a new table starting from July and not include columns for them, but to have them in the Other column. We shouldn't be cursed by happening to be in July rather than January, a split in the middle of the year is perfectly reasonable. SNP and Plaid are different, but I would merge them universally. Onetwothreeip (talk) 12:08, 3 July 2019 (UTC)
The time of year is irrelevant :) Maybe I should have been clearer, the is currently *no consensus* to remove UKIP & Change (or Plaid) columns and place their votes in a Others column. ~ BOD ~ TALK 13:54, 3 July 2019 (UTC)
when it comes to CHUK and UKIP I think the outcome of the next general election will make them totally irrelevant to the polls and they stop getting put onto the tables. That is especially true of CHUK who will disappear completely. I don't think it'll make too much of a difference if we wait until then or not. Some of these discussions may be better had after then. (and I expect that to be at some point this year)=> Spudgfsh (Text Me!) 18:27, 3 July 2019 (UTC)
OPPOSE taking out SNP and PC. Astonished to see someone advocating that and in the same breath saying leave CHUK and UKIP in. I can see an argument fir leaving those two out, but only after several months of very low polling. What I think is much more important than this discussion is having the Brexit Party column next to the main 3. It’s very annoying to have to scan across to that party’s column all the time. Almost hard work on a smartphone (be aware that most users of the net do so on smartphones now.) Boscaswelltalk 23:59, 6 July 2019 (UTC)
The smartphone issue is my biggest concern. It takes much more effort to move data from a column into the Others column, than it takes to simply start a new table under new conditions. I think this is why we should be quite hasty in making new tables without the ChUK and UKIP columns. Onetwothreeip (talk) 02:41, 7 July 2019 (UTC)
Oppose - keep the status quo on the existing 2019 chart. UKIP and Change-UK were "big" once and that data is relevant to the context. Remove them when we (arbitrarily!) start a new table in 2020 or after any election later this year.Cutler (talk) 08:23, 9 July 2019 (UTC)
Abstain I do not fel very strongly about the inclusion or not of the smaller parties, particularly if sub UK tables are shown, but if they are included I think that parties with a 10% plus share should be shown together on the left of the table, as they are more consequential. Jontel (talk) 06:24, 21 July 2019 (UTC)
New Leaders
I notice when there is a change in party leaders this table says "xxx becomes leader of xxx party". Would it not be better to say xxx elected leader of xxx.
"becomes leader" was used in the first instance on this page with Vince Cable who was returned unopposed. Change UK/TIG aside other individuals have fought and won contests. Wouldn't that make more sense? They all became leader immediately, none of them were leader-elect.
Pretty good point, I agree with that. 86.160.249.40 (talk) 04:47, 29 July 2019 (UTC)
Graph
The graph is getting out of date. --Comment by Selfie City (talk about my contributions) 11:21, 22 July 2019 (UTC)
This has become a big problem across many polling articles on Wikipedia. We seriously need to have a discussion about graphs that are not reliant on one person updating them. They are important elements of these articles and should not be the exception on an encyclopaedia that otherwise anybody can edit. Onetwothreeip (talk) 01:29, 23 July 2019 (UTC)
I added a new graph, doing a 5-poll rolling average from the point the previous graph finishes onwards. It should probably be changed to a 28-day rolling average like the previous graph had, but that would be a much greater amount of manual calculation than I'm up to doing. If anyone else feels able to update it with a 28-day rolling average, feel free to do so. Chessrat(talk, contributions) 14:27, 28 July 2019 (UTC)
I've gone ahead and put together a spreadsheet that makes it easier to import data from the Wikipedia tables and plug it into a chart. This should allow more users to be able to update the graph. I've modified the chart.svg to make it more visually appealing and uploaded it. Filinovich (talk) 16:56, 28 July 2019 (UTC)
Do you plan to add it to the article soon? --Comment by Selfie City (talk about my contributions) 17:22, 28 July 2019 (UTC)
Some of you have fekin high standards for 'up to dateness' of a graph. If you can't update it don't just remove it, and certainly don't replace it with POS graph FFS. 86.160.249.40 (talk) 04:45, 29 July 2019 (UTC)
If you want to comment here, I suggest you 1. take note of WP:CIVIL 2. Suggest possible improvements and say why you don't like it Bellowhead678 (talk) 07:31, 29 July 2019 (UTC)
I'm wondering, both the current graph and Mélencron's old graph claim to use 28 day averages, yet the trendlines differ substantially, how did that happen? --Gbuvn (talk) 10:16, 29 July 2019 (UTC)
Nevermind, it was just changed 2 minutes ago. --Gbuvn (talk) 10:18, 29 July 2019 (UTC)
That was my bad. For some reason my brain decided to do 28 poll averages instead of 28 day averages. It's been fixed afaik. Filinovich (talk) 10:30, 29 July 2019 (UTC)
Fresh table required
This is to propose that a new table be started as soon as possible. We live in an era where most internet access takes place on smartphones. As things stand with the table, the Brexit Party is out of the picture for most users. Yet they were the largest single party in the European elections, had not too long ago the lead in the poll we are documenting here, and continue to poll at 20% or thereabouts. This is highly significant, people! Similarly, the Green Party is now polling consistently much higher than it was before all the recent shenanigans took place in Parliament. Therefore, the new table, which is required as soon as possible order to reflect what is going on out there away from our keyboards, and is required because we are responsive, should have the Tories, Labour, the LibDems, the Brexit Party and the Greens as the first five. The order I've just suggested...I have no precise preference for the order of the first five, just that they should be the first five. SNP and Plaid would then follow with their own columns, as has previously been debated. It is a shame that this didn't happen at the beginning of July, mid-way through the calendar year. Perhaps other considerations got in the way. Boscaswelltalk 23:16, 20 July 2019 (UTC)
The previous discussion focused on retaining the SNP column. Since then it has only been more apparent that Plaid Cymru, UKIP and Change UK should not continue to have columns, given the very low and irrelevant polling results. Onetwothreeip (talk) 23:31, 20 July 2019 (UTC)
Well thanks for that, but I’ve been very clear in what I am proposing. Please could we stick to the proposal in this discussion? Thanks. Kind of like, er, you know, either agree or disagree or whatever? Not too hard, eh? ;) Thanks. Boscaswelltalk 01:50, 21 July 2019 (UTC)
Oppose - I don't think the column order should be changed every time a few polls show different levels of support. They should be in some 'concrete' order, e.g. the number of seats the party has or a much longer term average support (12 months or so). Btljs (talk) 11:27, 22 July 2019 (UTC)
Oppose But let's find a good fix to this problem. Reordering every time there's a shift is unmanagable. Better would be to rework the table so it addresses this problem. We can put the surveying company, sample size and area covered last, not first. --Dweller (talk) Become old fashioned! 13:23, 22 July 2019 (UTC)
Support. This seems like a sensible solution to the problem. --Comment by Selfie City (talk about my contributions) 12:28, 26 July 2019 (UTC)
Oppose per Dweller above. I think we should wait to the end of the year, or the high possibility of an autumn election and new version of article, before making changes. Rwendland (talk) 13:18, 26 July 2019 (UTC)
Oppose and agree with Dweller about potentially reworking other aspects of the table to make it more mobile friendly. --Wavehunter (talk) 13:58, 26 July 2019 (UTC)
Support Change Uk and UKIP are not coming back and subnational parties will always have a low %, so the proposal makes sense. Do it now. Jontel (talk) 20:37, 27 July 2019 (UTC)
Support margins of error ensure that there is little point in reporting poll numbers for parties on 3% or less. Bellowhead678 (talk) 08:00, 28 July 2019 (UTC)
Oppose Make the table more mobile friendly, but it's not a good reason to reorder. We've always used the result of the previous election to order and I see no reason to change it. BTW, I've reverted the unilateral change made to the order that was made. Andymmutalk 11:25, 29 July 2019 (UTC)
Comment If we are to reorder the columns, it ought to be according to how most RSes order the reporting of results, either in the headline numbers or in the tables. Filinovich (talk) 13:36, 29 July 2019 (UTC)
Would it be possible at all to remove the black line along the x axis of the graph? As it's the same colour as TIG's colour, it may be confusing. Would it be possible to have a soft border? TheMysteriousEditor (talk) 10:14, 29 July 2019 (UTC)
Good point. I've switched it to the white that the other grid lines use. Thanks. Filinovich (talk) 10:33, 29 July 2019 (UTC)
Still on aesthetics, the blurred lines and fat dots make me want to adjust the resolution. Can the graph observations be more defined? Thanks. Jontel (talk) 17:31, 3 August 2019 (UTC)
I've upped the resolution. It should hopefully be better now. Filinovich (talk) 14:54, 6 August 2019 (UTC)
Support. Seems sensible to me. Grinner (talk) 19:48, 6 August 2019 (UTC)
That sounds like a rather old-fashioned idea in my opinion, but I will support. :) --Comment by Selfie City (talk about my contributions) 20:00, 6 August 2019 (UTC)
Oppose When interpreting poll numbers, who the pollster is, what region it was done on and the size of the poll are all crucial bits of information. I feel it is important to keep them on the left to emphasise this. I also note it's the standard approach for polling articles on Wikipedia. Bondegezou (talk) 08:42, 7 August 2019 (UTC)
But the totals for the Green and Brexit Parties are also essential information. It's not just about Con, Lab, and Lib. --Comment by Selfie City (talk about my contributions) 20:14, 16 August 2019 (UTC)
Perhaps we need to have another look at the layout of the table overall. However, something similar to what we've got already seems appropriate. Mozartnut (talk) 19:46, 18 August 2019 (UTC)
Yes, we need to think it through. One solution was to remove some parties from the table, but that didn't go too well last time. --Comment by Selfie City (talk about my contributions) 21:58, 19 August 2019 (UTC)
I think many people felt that removing UKIP and ChUK was premature, but as time has passed, as reliable sources now give them less attention, as their polling bounces along near zero (30 May was the last time either got more than 2%), I think it would be safe to re-open that decision. YouGov now also give SNP and PC separately: their joint figure always caused problems in the past. That would make it easier to drop PC too. Bondegezou (talk) 08:44, 20 August 2019 (UTC)
Comment Any change ought to be minimal in nature or semi-permanent. It makes it more difficult to maintain a spreadsheet for updating the chart if the formatting of the table keeps changing. Filinovich (talk) 12:35, 21 August 2019 (UTC)
Prorogation of Parliament
I hear what it said about prorogation not normally being a notable event in terms of polling, but surely an exception must be made here? This instance of prorogation is highly unusual and irregular, and is strongly likely to have an effect on polling results. Seems like a no-brainer to include it. — Preceding unsigned comment added by TimAngus (talk • contribs) 21:16, 28 August 2019 (UTC)
I agree for the reason stated above. Dudley Miles (talk) 21:26, 28 August 2019 (UTC)
is strongly likely to have an effect on polling results This sound like WP:CRYSTALBALL to me. Further, consensus was for only a specific set of events to be added, which did not include events that somehow passed a previous analysis on "likeliness" to have an effect on opinion polling, which nonetheless is a subjective opinion very close to violating WP:NPOV. Impru20talk 21:31, 28 August 2019 (UTC)
Wikipedia is not a newspaper. There is no rush. If reliable sources emerge saying polling shifted at this point, then we can add it. We have to obey WP:RS and WP:SYNTH: we cannot just decide something is the case. Bondegezou (talk) 21:59, 28 August 2019 (UTC)
Fair enough. It just seemed like such an obvious thing to me; I'm surprised it's at all controversial. TimAngus (talk) 22:23, 28 August 2019 (UTC)
Results for UKIP and Change UK are regularly being given as 0% when there is actually no line for these parties in the poll (not prompted for or included in Other). The 3-4 September 2019 Hanbury Strategy poll is the most recent example. It would be better to mark their absence with a dash or an NA. 175.32.168.34 (talk) 13:19, 5 September 2019 (UTC)
Yes that is what the general approach has been. I've corrected the recent Survation polls that excluded UKIP and TIG as options. If you spot any others, feel free to correct it. Filinovich (talk) 13:36, 5 September 2019 (UTC)
@AdamFilinovich: Probably my mistake. I assumed the BPC was made up of about 6 organisations (not including Hanbury), which is evidently not true. --TedEdwards 23:42, 5 September 2019 (UTC)
Chart legend
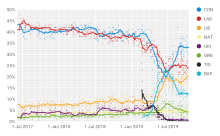
Does the yellow line in the chart include only the Scottish National Party? If so, I suggest that the legend is changed from "NAT" to the usual abbreviation "SNP". If this line is supposed to include Welsh nationalists too, then this needs explanation (and the yellow colour is potentially misleading too). — Preceding unsigned comment added by 2A00:23C5:4B91:AB00:1894:9FFB:C912:C702 (talk) 13:51, 6 September 2019 (UTC)
Conditional/Hypothetical Polls
I noticed that the bottom two polls from ComRes/Britain Elects conducted 4-6 Sep are conditional/hypothetical polls. Should these be included in the list alongside normal voting intention polls? Morgy2000p (talk) 14:48, 8 September 2019 (UTC)
Read and participate in the section just above this one. Filinovich (talk) 14:57, 8 September 2019 (UTC)
ICM dual polls
Could the 1st column have 2 lines, each with the note reference, as in the lead column? Boscaswelltalk 00:46, 7 September 2019 (UTC)
However, is there not a problem with both polls? The usual question is "If there were an election today, how would you vote?". Or is it "tomorrow"? These ICM questions are different. Do they belong in this table at all? Cutler (talk) 09:35, 7 September 2019 (UTC)
They certainly do. This is an article for polling of the next election. Whether it's before October 31 or afterwards, it will be the next general election. Onetwothreeip (talk) 10:12, 7 September 2019 (UTC)
@Onetwothreeip and JezEuansson: can we have some respect for basic Wikipedia etiquette, like WP:BRD, and not edit war? Let us reach consensus here and then add or not, as appropriate, but pushing edits on the article when there is legitimate discussion going on is inappropriate. Bondegezou (talk) 11:02, 7 September 2019 (UTC)
The ICM poll begins like a regular poll, asking, "Q2. If there were a general election tomorrow, which party would you vote for?" We should use the answers to this in our table. The poll then asks, "Q3. Scenario One: Imagine that Brexit is delayed beyond 31 October 2019 and a general election is held shortly after, while Britain is still a member of the European Union (EU). Which party, if any, would you vote for in these circumstances?" This is not the usual form polling takes and it what we mean by a hypothetical poll. The validity of this sort of polling is questioned: the phrasing, particularly coming after a regular polling question, makes respondents focus on a particular issue. We generally do not include hypothetical polls of this nature in this article, and I suggest we do not do so now. Bondegezou (talk) 11:08, 7 September 2019 (UTC)
I agree with Bondegezou, we should only be including standard polling questions in the main table. The second question is not comparable with all the other standard polls: including it is false equivalence. Gaia Octavia AgrippaTalk 11:12, 7 September 2019 (UTC)
I don't think there's really a dispute going on here. If the questions are as you say, then the first question should remain in the table and the second should be in a table of hypothetical polls. Onetwothreeip (talk) 11:14, 7 September 2019 (UTC)
I have removed the second row from the main table. If you want to create a section for a table of hypothetical polls, suggest or try something. Bondegezou (talk) 12:51, 7 September 2019 (UTC)
Bondegezou All opinion polls are hypothetical, the post-October question was an alternative scenario poll. Very disappointed by you attempting to instruct me, and by claiming in an edit summary that I have conceded something. Both have come as a surprise against the otherwise collaborative environment. Onetwothreeip (talk) 23:26, 7 September 2019 (UTC)
Concur with Onetwothreeip. Results for ICM's standard "election tomorrow" question in this table. Other results elsewhere (or not at all).175.32.168.34 (talk) 04:07, 8 September 2019 (UTC)
Bondegezou you wrote: “Let us reach consensus here and then add or not, as appropriate, but pushing edits on the article when there is legitimate discussion going on is inappropriate.” ...then went ahead and did just that. *scratches head* Boscaswelltalk 05:11, 8 September 2019 (UTC)
Onetwothreeip (and this also answers Boscaswell): my apologies that I have disappointed you, but I am confused how. You said, "I don't think there's really a dispute going on here. If the questions are as you say, then the first question should remain in the table and the second should be in a table of hypothetical polls." I took your statement that you "don't think there's really a dispute going on here" to mean we have agreement. I edited in line with your statement that "the first question should remain in the table" by keeping the first question in the table. I took your statement that "the second should be in a table of hypothetical polls" to be agreement that it should not be in the main table and removed it from there accordingly. I left the question of "a table of hypothetical polls" open. Would you mind clarifying where you feel I have gone wrong?
Right now, we have me, Gaia Octavia Agrippa, Onetwothreeip and an IP editor all agreeing that the first row (regular "election tomorrow" poll) should be kept in the table. No-one is currently arguing against that. I thought all of us also agreed on the second row ("Imagine that..." poll) not being in the main table, albeit without consensus on whether it could be included elsewhere, with (possibly?) only Boscaswell wanting both rows in the same table. (Cutler raised the original question here but hasn't commented since.)
We now have the same issue with a new ComRes poll. I haven't checked wording, but I would suggest the same decision applies. Bondegezou (talk) 07:40, 8 September 2019 (UTC)
I suggest that the main table preserve consistency and just include polls with the regular wording (usually something like "if there's an election tomorrow"). All alternative/supplementary polls that put forth some more complex scenario should not be included in the main table. If a number are using the same scenario, they could be grouped together in their own table. Bondegezou (talk) 07:45, 8 September 2019 (UTC)
I'm not sure what you're asking. Both polling questions belong in the article, and until a table is created for alternative scenario questions, they both belong in the main table as well. It would be very regrettable if either poll result was omitted from the article. What makes a polling question an alternative scenario is not the hypothetical election date. It is not significant enough that a question asks respondents how they would vote today, in a few months, or at the next election. What makes an alternative scenario is if the question asks how the respondents would vote if certain events took place. All polls are hypothetical. Onetwothreeip (talk) 09:18, 8 September 2019 (UTC)
Lost track of indentation here - agree with main table having only regular polls and complex scenarios in supplementary table. Cutler (talk) 09:33, 8 September 2019 (UTC)
@Onetwothreeip: thank you for clarifying. I misunderstood you previously -- sorry. There is, however, really a dispute here. At present, me, Gaia Octavia Agrippa, Cutler and an IP editor want the regular poll in the main table, but not the supplemental "Imagine that..." poll. You and, presumably, Boscaswell want to include both rows. I have requested more input at the WikiProject for UK Politics, but for now, it's 4:2 not to include both polls. If no-one is persuaded by further debate, then the supplemental polls come out. Bondegezou (talk) 12:10, 8 September 2019 (UTC)
We have under #Constituency polling specific questions that were asked that don't fit into the main table. We could create a further section to include the theoretical Brexit-related polling questions. For reference the ComRes questions are "A General Election is held after extending the Brexit deadline beyond the 31st of October 2019" and "A General Election is held before the 31st of October 2019, and Brexit has not been delivered" [1]. The former is obviously comparable to Q3 of the ICM poll. They could both be in a mini table together, with the other ComRes question treated as a normal poll or added separately to the new section. Thoughts? Gaia Octavia AgrippaTalk 12:31, 8 September 2019 (UTC)
I don't think that non-standard polling questions should be included in the main table. If a non-standard polling question were routinely asked, there could be a case to include a separate table. I don't think we have enough to make a separate table based on due weight, unlike when we included a separate table for polls including Change UK. I think the Brexit-contingent questions should be excluded from the article for now, though I'm open to revisiting the idea if more pollsters routinely ask similar questions. I'm not sure that even if polling firms asked it fairly frequently we'd have enough polls to justify a new table by the time October 31 comes round. Ralbegen (talk) 15:45, 8 September 2019 (UTC)
With Ralbegen and Morgy2000p, that's 6:2 against the conditional polls, so I'm taking them out. If Onetwothreeip and Boscaswell want to try a separate table, let's see what it looks like. Bondegezou (talk) 16:07, 8 September 2019 (UTC)
I’m OK with that, Bondegezou. Thanks for notifying me. Boscaswelltalk 19:36, 8 September 2019 (UTC)
What is wrong with the latest ComRes poll? It asks how people would vote if there was an election tomorrow, which seems standard. Dudley Miles (talk) 13:09, 16 September 2019 (UTC)
That poll is really unrelated to this discussion. Some anonymous user is arguing that it's a "fake" poll without any backing evidence. Filinovich (talk) 13:48, 16 September 2019 (UTC)
Comres poll and edit warring
I have no idea if this poll is or isn't reliable, but editors should not edit war. Once a change is contentious is should come here for discussion.
Page semi-protected for two weeks. --Dweller (talk) Become old fashioned! 15:08, 16 September 2019 (UTC)
There was something of an attempt to discuss it in the section two above here, but none of the anonymous vandalizers seemed interested in discussing. They just revert and spout nonsense about how a BPC polling company's webpage is not a reliable source for the very poll they've conducted. Filinovich (talk) 17:07, 16 September 2019 (UTC)
New YouGov/Times poll
out on Thursday 19/7, would have been seen last night? Con 32%= LD 23+4 Lab 21-2 BXP 14=
Ive never edited the poll results section before, so won’t in case I mess it up. Boscaswelltalk 06:54, 19 September 2019 (UTC)
Done! Ralbegen (talk) 09:58, 19 September 2019 (UTC)
thanks, peeps! Boscaswelltalk 18:37, 19 September 2019 (UTC)
New IPSOS/MORI
Conservatives 34%
Labour 24%
Lib Dem 20%
Brexit Party 9%
Green 6%
SNP 4
Others 4%
Wondering where I get this info from? It’s politicalbetting.com
This one has to be about 8 hours old. Was there up until recently someone who edited in new poll info the evening before the newspaper running it? Whoever it is isn’t now!
As before, I’m highly reluctant to add it in myself, fearful of messing it up. Sorry ‘bout that. Boscaswelltalk 05:27, 20 September 2019 (UTC)
Graph
Out of curiosity, how often does the graph get updated? I believe it's not been updated for about 3 weeks now. TheMysteriousEditor (talk) 21:45, 24 September 2019 (UTC)
At the moment, I tend to update it whenever someone complains that it hasn't been updated because it's a semi-tediousprocess. Filinovich (talk) 23:55, 24 September 2019 (UTC)
Splitting Polling Company & Client
I want to float the idea of splitting the polling company and client into two columns in the table. It's well known that different companies have different approaches that yield different results; the so-called 'house effect'. If you wanted to group polls by polling company you could sort the table by the first column, but because the client is included all the "ComRes/Brexit Express" polls come before the "ComRes/Britain Elects" (for example), whatever the date. If the column was split, then you could sort the table and see how each poll compared to the previous one from the same company. mykums (talk) 09:18, 25 September 2019 (UTC)
Prorogration controversy?
Surely it is a good idea to include a bar marking where the supreme court ruling was, as it will have a major effect on the polls? — Preceding unsigned comment added by Theprussian (talk • contribs) 15:08, 25 September 2019 (UTC)
This is not a timeline article. Other polling articles do not list such incidents. You have provided no reliable sources saying the ruling has had a major effect of polling, and we don't try to predict the future (WP:CRYSTALBALL). So, no. Bondegezou (talk) 20:58, 25 September 2019 (UTC)
BMG initial prompt, Brexit Party.
The preamble to the national polls section mentions BMG but it makes no mention of their initial prompt including the Brexit Party. I imagine that that has now changed? Boscaswelltalk 20:10, 3 October 2019 (UTC)
Done. The BBC’s latest Poll Tracker updates mentions it. It’s very thorough in that. Slanted in the write-up, but detailed in the machinations of polling. Boscaswelltalk 22:44, 5 October 2019 (UTC)
ComRes/The Daily Telegraph from 24 Sep
Delete. These are not headline voting intention figures. They are unweighted numbers included only for cross-tabulating the other questions. 31.32.4.17 (talk) 12:33, 25 September 2019 (UTC)
Other reliable sources are treating it as voting intention figures[2]Filinovich (talk) 12:59, 25 September 2019 (UTC)
AdamFilinovich 1. When is a reliable source a reliable source nowadays? For example the Guardian is so one-sided about anything concerning Brexit that it can’t really be treated as reliable - everything in it is opinion.
2. if you’re saying other RS’s are treating it as voting intention then you need to provide them.
3. the link given is of the table data and doesn’t show the headline weighted figures? Boscaswelltalk 07:50, 26 September 2019 (UTC)
Keep. Table 7 where our numbers come looks entirely normal: weighted and excluding Would not vote & Don't know & Prefer not to say. Rwendland (talk) 08:52, 26 September 2019 (UTC)
The 24/9 numbers are not included in the time series on the cover of the latest ComRes poll. That's because, as previously noted, they are a simple count for cross-tabulation, with no squeeze and no turnout weighting. ComRes has never reported them as headline VI. I don't propose to go on litigating this. Just trying to do my bit for the integrity of the page. 31.32.4.17 (talk) 14:32, 9 October 2019 (UTC)
Significant that 24/9 numbers not included in latest time series. 24/9 Table 3 has basic population weighting (a Weighted base row), but compared to Table 37 of 6/10 it does not have turnout weighting as you say. Also while 24/9 has a decent sample of 1027, it is about half of the usual ComRes sample size of about 2000. So I do now agree with you it should be dropped from our table. If no-one objects I'll remove it tomorrow. Rwendland (talk) 16:01, 9 October 2019 (UTC)
Also significant that the BBC poll tracker at [3] says that it has excluded that poll because respondents unlikely to vote are given equal weight to those certain to vote. Dudley Miles (talk) 18:34, 9 October 2019 (UTC)
Error
Simple numerical error in 9 Oct Yougov Poll-surely should read Con Lead 13 not 6? Daveyb100 (talk) 11:48, 11 October 2019 (UTC)
Where in the Excel table we link to do the figures show the numbers we cite? I'm seeing Con 25% Lab 21% LD 34% Brexit 2% Green 2% and the rest undecided or refused. --Dweller (talk) Become old fashioned! 13:36, 16 October 2019 (UTC)
there's a section (table 4) in there near the bottom with a reference to LTV (likelyhood to vote), and those numbers were in the twitter message from the pollster=> Spudgfsh (Text Me!) 13:56, 16 October 2019 (UTC)
Thanks. Which figures do we normally quote? Likely to Vote or overall? And if LTV, where's the 21% for "others" come from? --Dweller (talk) Become old fashioned! 14:41, 16 October 2019 (UTC)
The figures used will be Normal Weighting, LTV, undecided and refused removed; or whatever the equivalent label is for other pollsters. Unsure where the 21% number came from; I've removed it. Filinovich (talk) 15:35, 16 October 2019 (UTC)
Graphs of Scotland and Wales
I've just hidden these, as they've not been updated since May and are therefore very misleading. Sadly, Mélencron, who used to maintain them, has retired. I'd love it if they returned or someone else updated them. --Dweller (talk) Become old fashioned! 12:09, 29 October 2019 (UTC)
MRP Seat Prediction by FocalData
The Guardian reported a MRP seat projection done by focaldata here the other day. I've tried picking out the numbers from the article but can't get all of them. Has anyone seen any more data for this or can decipher the data from the article so we can add it to the article? => Spudgfsh (Text Me!) 16:51, 31 October 2019 (UTC)
This should be:
I've tried to do this but get stuck. I suggest the current HOC position be the penultimate row, before the predictions, as it is based largely on the May 2017 election. Jontel (talk) 18:00, 31 October 2019 (UTC)
they are usually ordered by date they were polled. nothing has been released since the calling of the election. The other rows all happened before that. if you want to reorder the rows then move from one |- to the next. there are sort orders in the rows at the moment (I'm not sure that they are correct) => Spudgfsh (Text Me!) 18:06, 31 October 2019 (UTC)
Kantar Poll 31/10/19
Is this a mistake? I can't find any reference to it in the link
--Andromedean (talk) 19:31, 1 November 2019 (UTC)
Calculation of majority
The calculation of the projected majority in the source, at the bottom of the article, seems clearly wrong. I have left it but added a note to avoid confusion and/ or an edit war. As the source's projected majority is exactly twice that of the nominal majority, there may be an arithmetical error. Feel free to challenge. Jontel (talk) 13:50, 31 October 2019 (UTC)
What's the error in arithmetic? They've given 363 Conservative and 287 for the rest. Margin of 76. --Dweller (talk) Become old fashioned! 14:34, 31 October 2019 (UTC)
Yes, my mistake; I see the BBC says the size of the majority is the margin. [4]. Jontel (talk) 15:00, 31 October 2019 (UTC)
Elections in the UK use majority as the margin between the government's and opposition's seat totals. I don't know enough about Italian or Polish politics to say, but I guess that both use 'majority' to mean number of seats the government has greater than the required threshold of a majority. Clyde1998 (talk) 20:22, 1 November 2019 (UTC)
Suggestion: Create a separate table for the campaign period polls
My thoughts were that, like the Canadian election earlier this year there will be a lot of new polls. I wondered if so it's easier to navigate a separate table of polls after the election has been called could be made? Jonjonjohny (talk) 07:16, 1 November 2019 (UTC)
That would also allow us to drop UKIP and ChUK from the new table. Bondegezou (talk) 08:54, 1 November 2019 (UTC)
Oppose I understand that we get to drop the obsolete columns but just no. We have never done it before. There is no intrinsic (inherent?) demarcation. The comparison between peace time and election period is the most signal of all. People want to make it so why put on a different table? Who knows, the dead parties may revive (improbable, I know). It just introduces unnecessary complexity. NO. Cutler (talk) 19:53, 1 November 2019 (UTC)
Oppose There's no advantage to this from a navigation standpoint, as the most recent polls are to the top of each year's table; the line stating "MPs vote for a general election" is the indicator of when the election began; we've had no issues with using the year-by-year format for previous elections. Clyde1998 (talk) 20:14, 1 November 2019 (UTC)
Oppose This doesn't help anything. Also, comment, I can easily see UKIP continuing on after Brexit as a small right/farright/extremeright party (T.Robinson movement style), they're irrelevant for this election (at a national level), but removal seems dodgy compared to the greens. TIG should never have been included in the first place. 86.132.18.158 (talk) 14:53, 2 November 2019 (UTC)
Oppose I agree with the comments above. It is unhelpful to change format mid-year and there does not seem to be much value in the change, which is a distinction without a difference. Also we lose the UKIP data, which although small, is a real thing. Mwbaxter (talk) 16:44, 2 November 2019 (UTC)
Support That this has not been done before should not be the deciding factor. Otherwise, why change anything?
The campaign period is a period of huge interest in itself and having it separate would IMO be useful.
We have the chance to rid ourselves of the TIG and UKIP columns! Let’s take it! The ease of assimilating the resultant reduced level of information is a huge plus. (The comparison of UKIP (0-1%) with the Greens (2-5%) is just a furphy.) Boscaswelltalk 20:14, 3 November 2019 (UTC)
Weak Oppose Regards removing parties polling less than 1%....Keep for this election, remove after the election (it being a marking point in the history of uk politics) if UKIP & ChUK fare as badly as current form predicts. ~ BOD ~ TALK 21:51, 3 November 2019 (UTC)
Someone's been ignoring what the RS cite as the predicted majorities and using their own calculations, based on deducting Speaker and Sinn Fein. This is WP:OR and should not be done. --Dweller (talk) Become old fashioned! 17:42, 5 November 2019 (UTC)
Heading hierarchy / missing "important events"
2 National poll results
2.1 Campaign period
2.2 2019
2.3 2018
2.4 2017
It reads as if the campaign period is not 2019.
Also, in the main tables of polling results, various "events" are listed. But some of the most important events, in terms of potential impact on the polls, are missed Brexit deadlines, and these are omitted, while some fairly peripheral events, such as by-elections, are shown. If you don't believe me, just look at the spectacular effect on the graph around the time the first Brexit deadlines were missed. 2A00:23C5:4B91:AB00:5F3:C50E:265E:36A (talk) 02:20, 2 November 2019 (UTC)
We've had many discussions about what "events" to show. Most polling articles on Wikipedia list no events whatsoever. This isn't a timeline article: it's a list of poll results. Inserting events is prone to editorialising (WP:OR). Bondegezou (talk) 13:33, 2 November 2019 (UTC)
If anything events should be fewer, not more, and err towards the most factual-least editorialisable items. by-elections are ideal, they're straightforward statements of fact, we either include them all or none of them, no arguing. The idea of adding brexit deadlines is madness. 86.132.18.158 (talk) 14:44, 2 November 2019 (UTC)
Missed deadlines should be included in the list. --Comment by Selfie City (talk about my contributions) 20:28, 6 November 2019 (UTC)
Article Protection
Due to some recent edits adding unverified polls and other information from non-registered users, I've submitted the article for Semi-protection WP:SEMI so that non-registered and non-autoconfirmed users cannot edit the article. Andymmutalk 23:48, 5 November 2019 (UTC)
Yes, I saw one that showed Conservative 44, Labour 20, LibDem 15, Brexit 7, Green 5, earlier today on this page, and wondered where it went (is there any information about where it was from?)
This was the most successful prediction of the 2017 election. When most classic polls were badly wrong. It seems strange yougov don't seem to have a 2019 version or any information about when/if it will be available on their website. Does anyone know if it is happening? 81.132.62.34 (talk) 01:36, 7 November 2019 (UTC)
That seems certain. Indeed YouGov pollster Anthony Wells predicts we'll see MRP models from "several" companies this time. ukpollingreport.co.uk/blog/archives/10103 86.174.248.23 (talk) 21:56, 8 November 2019 (UTC)
BMG?
Wheres the latest BMG poll result (9Nov)? Daveyb100 (talk) 22:51, 10 November 2019 (UTC)
Two Seat Prediction sections
There are currently two seat prediction sections, both of which are national polling, but are kept separate. The section at the bottom contains at least 1 MRP prediction and the section nearer the top contains a reference to a MRP seat prediction but the polling is all that is referenced. This makes no sense. I merged the two sections but was reverted.
Should we merge these or should I get back in my box? => Spudgfsh (Text Me!) 17:45, 31 October 2019 (UTC)
The MRP seat predictions have been covered by significant reliable sources. All the other seat predictions have not and, I suggest, should be excluded from the article on the basis of WP:INDISCRIMINATE. Bondegezou (talk) 09:35, 4 November 2019 (UTC)
I disagree. It's very far from indiscriminate. --Dweller (talk) Become old fashioned! 12:59, 4 November 2019 (UTC)
I'm not seeing this either. There are many seat predictions available from a variety of sources. What evidence is there that the predictions from Focaldata are to be preferred to any others? Why would Wikipedia editors be selecting down to such a narrow viewpoint? Isn't that WP:OR? The right thing to do seems to me to be to carry data from a number of reputable sources, and have the discrepancies between various predictions serve as an indication of the errors in the process - exactly what we do by taking polling data from multiple sources. This preference for Focaldata is much like saying that XXX polling organisation did the best job last time, so we will only carry that data. That's manifestly crazy. The seat prediction data is very important in this election, because it isn't just a straight 2-way race. We should carry as many (reputable) seat projections as we can, and show their history. RERTwiki (talk) 17:17, 11 November 2019 (UTC)
We should respect Wikipedia rules on using reliable sources and favouring WP:SECONDARY sources. Wikipedia rules dictate what we consider reputable and it's not any old Twitter feed. Bondegezou (talk) 17:25, 11 November 2019 (UTC)
Should the lead be "5%" or "5 points"?
There has been a recent change to the 'Lead' column to switch it from using the percentage sign (%) to the word "points" as an abbreviation for percentage points.
It's not clear that this is an improvement. The percentage sign is well understood as an abbreviation for percentage points, and is used widely on the rest of the page. On the other hand, the word "points" is both mildly ambiguous (it could be an abbreviation for the smaller "basis points") and takes up more space on the screen. Some people might think it looks ugly.
What do people think about this? — Preceding unsigned comment added by Mwbaxter (talk • contribs) 10:24, 1 November 2019 (UTC)
I understand that mathematically 40% to 36% is not a 4% lead, but it is how RS report it and people understand it. I'd stick to %s. --Dweller (talk) Become old fashioned! 11:31, 1 November 2019 (UTC)
Ditto. Stick to %. Bondegezou (talk) 12:06, 1 November 2019 (UTC)
I'd say stick with % too, but perhaps a compromise is using pp to signify percentage points? I feel like I've seen that used in other articles. Bkissin (talk) 13:09, 1 November 2019 (UTC)
I think that adds a level of unnecessary obscurity. We should just keep things simple and reflect the sources that overwhelmingly do this. --Dweller (talk) Become old fashioned! 13:48, 1 November 2019 (UTC)
I think many casual visitors might not understand pp without powering up their brain cells, I agree "points" is ambiguous, while % is the straightforward internationally (i guess) understood abbreviation for percentage points. Keep it simple folks :) ~ BOD ~ TALK 14:46, 1 November 2019 (UTC)
The lead column probably shouldn't be there. It encourages the incorrect belief that the single party that wins the most votes nationwide wins the election. That is not how the national elections work in the UK, only on a single seat level does it work like that. Even with propertional representation all the largest party is guaranteed is to have the largest group of representives, and UK doesn't even have propertional representation. Carewolf (talk) 18:01, 12 November 2019 (UTC)
Seat prediction - state of Parliament at dissolution?
Hi. We have a row stating the 2017 seats results, but Parliament looked quite different from that at dissolution. Consensus for adding those figures? --Dweller (talk) Become old fashioned! 09:45, 12 November 2019 (UTC)
I'd be open to this if it meant having both, as there are two strings (last_electionX and seats_beforeX) in the infobox. --RaviC (talk) 20:25, 12 November 2019 (UTC)
People are of course more interested in the latest results than the earliest ones and comparing the latest readings with the scale at the other side of the chart is slightly inconvenient. I wonder if we might put the scale on the right of the chart and the line titles (party names) on the left or on top. Jontel (talk) 18:55, 13 October 2019 (UTC)
Just going to say that it is definitely possible to reverse the axis (as easy as pressing a couple button the way it's being done). I don't really mind either way which direction it is, so I would like to see more responses to this. Filinovich (talk) 12:48, 15 October 2019 (UTC)
Add a scale on the right, sounds sensible. And update with the latest polls, too? --Dweller (talk) Become old fashioned! 20:27, 15 October 2019 (UTC)
I'm fine with y-axis on the right, although gridlines would also work as a solution to the issue wouldn't they? Grinner (talk) 14:24, 16 October 2019 (UTC)
Ok, that's 3:0 for change after a week. As it's so easy, perhaps we could trial it and see what reaction there is. Jontel (talk) 15:04, 21 October 2019 (UTC)
Can we have some horizontal gridlines? — Preceding unsigned comment added by 92.24.30.0 (talk) 00:33, 13 November 2019 (UTC)
Phantom ComRes poll
The ComRes poll dated 8th-10th Nov keeps appearing, but there is no source. The link provided leads to a poll conducted 30th-5th, which is already in the table under the correct date — Preceding unsigned comment added by 2A02:A210:2204:4800:7CCD:71C:8D2D:33A8 (talk) 17:58, 13 November 2019 (UTC)
There was a source from Britain Elects (who I believe commissioned the poll) and that was replaced by one from Opinionbee. That was further replaced by the incorrect tables from the 30th Oct-5th Nov poll, hence the confusion. ComRes are yet to publish the tables, but it looks to me to be a genuine poll. Happy to be proved wrong. Andymmutalk 18:12, 13 November 2019 (UTC)
The article in its current state is confused about seat estimates. There are two sections, MRP estimates which actually lists the popular vote percentages from a large YouGov poll used for a MRP model, and then Seat Predictions, which lists in a table the output from this and another MRP, as well as the latest projection from Electoral Calculus which regularly uses the current polling average to make projections.
In this edit I resolved these issues, by combining the sections, moving the popular vote percentage from YouGov into the main table, describing in the prose what Electoral Calculus does (differentiating it from the MRP model output), and limiting the table to the MRPs.
This edit was however undone without explanation by 2A02:C7D:2BAF:E900:59DC:8ECB:313B:7AE4. I'd like to discuss this and hopefully find an acceptable way of resolving this confused state of the article. --LukeSurltc 19:14, 13 November 2019 (UTC)
I like your edit. Some editors want to include lots of regular (non-MRP) seat predictions, so maybe there's a compromise of your edit, but put back in an Electoral Calculus row. Bondegezou (talk) 19:38, 13 November 2019 (UTC)
(edit conflict) On the MRP model: in the 2017 article, there's a section tracking YouGov's MRP VI results over time. I think the idea is that it's a sufficiently different methodology that it's worth including separately. I think this is useful if we're going to see more than one instance. Arguably a list of MRP results where each value only varies by at most 1%, as was the case last time, doesn't seem too useful. The principle of separation seems sound to me, but only really if we're seeing more MRP VI results from YouGov and/or other pollsters.
On seat predictions: I don't think a prediction has to be based on a pollster's own data and modelling to be worth including. A prediction based on aggregated data is worth including if it's taken seriously by reliable sources (as is the light consensus above). I think the approach in the 2017 polling article of including just the latest seat prediction from each source is sensible, though the inclusion threshold seems ill-defined in that article.
So I'd support tentatively restoring the MRP section, and including a 2017-style column-based seat prediction section that includes predictions from pollsters, reliable sources, and predictions from organisations that are covered and treated seriously by reliable sources. Ralbegen (talk) 19:48, 13 November 2019 (UTC)
I restored my edit, but kept a row for Electoral Calculus, as per Bondegezou. I can see how there could be a role for projections from aggregates and MRP results from single large polls, but I think they should be clearly distinguished and given sufficient prose to explain them to the reader as well as table entries. I expect we'll see more MRPs conducted by pollsters once the candidate lists are fixed and the election gets imminent. However having a section called MRP estimates, but then using that to just give popular vote numbers, is straight-up incorrect. --LukeSurltc 20:03, 13 November 2019 (UTC)
When I read the rubric accompanying YouGov's February MRP release I'd assumed that there were some difference to standard weighting to produce their headline VI figures. But reading about what MRP entails, that doesn't seem to be the case. So thanks for pointing that out, and I think the status quo now is right. Ralbegen (talk) 20:12, 13 November 2019 (UTC)
MRP again
Somebody has added the YouGov MRP in Feb back into the main table. They have also used an aberrant date format with the year. Slightly fed up I can't edit at the moment.Cutler (talk) 22:25, 13 November 2019 (UTC)
Oppose - not ejusdem generis.Cutler (talk) 22:25, 13 November 2019 (UTC)
That was me. I've fixed the date format, sorry about that. These numbers however are however a simple headline voting intention (after weighting etc.), albeit with a very large sample size and belong with other voting intentions in this table. These voting intentions aren't the output from the MRP, these are (part of) the input to to the model, which then outputs seat predictions, which are covered in the seat predictions section with some explanatory prose. --LukeSurltc 08:06, 14 November 2019 (UTC)
Updated graph
I've updated my old graph and I'm happy to keep it updated every couple of days during the election period. Ok for me to replace the current out of date one? Bellowhead678 (talk) 21:53, 3 November 2019 (UTC)
If you are committed then that's much better than having to pester one editor to keep it updated. I reckon you should implement it - thanks. TheMysteriousEditor (talk) 22:17, 3 November 2019 (UTC)
Thank you so much. Is there any chance of a vertical line to show when the campaign begins (when the campaign begins!)? --Dweller (talk) Become old fashioned! 12:58, 4 November 2019 (UTC)
(We could also do with a key, for visitors unfamiliar with our party colours) --Dweller (talk) Become old fashioned! 12:58, 4 November 2019 (UTC)
Quick question, there's a small blue line along the x-axis representing the Brexit Party briefly in March. Should that not be linked up to the actual blue Brexit party line? TheMysteriousEditor (talk) 11:57, 6 November 2019 (UTC)
We have previously had a consensus of not adding a separate Campaign Period table (see above) but that has not stopped some trying to do so. Perhaps we need to gain a new consensus one way or the other.
I've also just noticed that the old discussion was deleted. Let's have a new one. Should we have a campaign period section? Andymmutalk 11:20, 11 November 2019 (UTC)
Oppose We've never done this before, and it doesn't make the article any clearer. The latest polls are always at the top of the table and in the multiple discussions we've had before we've decided against it. Andymmutalk 11:25, 11 November 2019 (UTC)
Oppose - makes nothing clearer and just makes it more difficult to see trends --Dweller (talk) Become old fashioned! 11:46, 11 November 2019 (UTC)
Support. It was done in the latest Canadian election article. There will be a lot of polls over the next few weeks so the sub-sections will be slightly smaller. Polling during campaigns is when you will see the most significant changes. Not during mid-terms. Just because it hasn't been done before doesn't mean it can't be done now. And in regards to Dweller's argument it makes it difficult to see trends: you cant spot trends with 6-8 polling groups in one period. The moving averages on a graph are the best way of seeing the trend. Jonjonjohny (talk) 14:23, 11 November 2019 (UTC)
Weak support. I find Jonjon's arguments convincing; but am open to being unconvinced. Gog the Mild (talk) 18:30, 11 November 2019 (UTC)
Oppose continuity of data enables users to make their own judgments about important and significant milestones in polling/ sentiment. Users can easily stratify data by dates. Preferring one stratification is editorialising. In any event, where to separate? GE Bill first reading? GE Bill passes commons? Or Lords, Or Royal Assent? Or parliament dismissed?Cutler (talk) 21:39, 11 November 2019 (UTC)
I wouldn't mind an additional graph for the campaign section like in the Canadian election article if there's an extreme influx of polls but I see no use in splitting the table. --Gbuvn (talk) 21:54, 11 November 2019 (UTC)
Support. And it’s really helpful to not have the UKIP and CUK (TIG) columns. It’s worth the change for that alone! Boscaswelltalk 20:08, 12 November 2019 (UTC)
Oppose Everybody knows when the campaign started so there is no added value here. And this discussion definitely sounds like geeks with too much time on their hands fiddling around on the Titanic's deck. Can't you lads get out canvassing? --JezEuansson (talk) 22:31, 12 November 2019 (UTC)
Weak support. There's some precedent in other country's election articles, and I think it'd improve readability, not least in removing Change UK and UKIP. The current continuous set-up is also fine, though, and I'd be interested to see the previous discussions Andymmu mentions. I can't find them on a cursory look over the last two articles of opinion polling for UK general elections, but standing consensus is a strong argument. Ralbegen (talk) 22:53, 12 November 2019 (UTC)
Oh, I thought you meant in previous elections' discussions, sorry. Again, sensible arguments but still on balance I think a separate section is better than continuing a single table. Ralbegen (talk) 15:27, 13 November 2019 (UTC)
Oppose This issue has already been raised and decided on, so I don't know why it has been raised again. The format change is intrusive; it discards information that we have been collecting for the duration of the parliament (i.e. UKIP and ChangeUK vote shares, even if they are not doing well); it serves no obvious value; and it is needlessly disruptive. Please can we go back to the standard layout. Mwbaxter (talk) 11:59, 17 November 2019 (UTC)
Oppose per Mwbaxter, and I find it makes it harder to see trends. Rwendland (talk) 12:43, 17 November 2019 (UTC)
So again someone (another unregistered user, or the same one from a different IP more likely) has reintroduced this section with no consensus to do so. They even removed Plaid even though with YouGov their response is combined with the SNP. I'm happy to do the nasty bit and reorganise the table if others want to go through and add back the numbers for those three parties. It's pretty rude in my opinion since data was deleted out of the table when at best there was no consensus for, and worst a clear will against, doing just that. Andymmutalk 19:08, 17 November 2019 (UTC)
Support Makes it easier to see trends in the campaign period and generally makes the data clearer. No reason to include non-entities among the parties with significant polling. Functionality is especially increased on mobile devices. Onetwothreeip (talk) 19:37, 17 November 2019 (UTC)
Oppose. Per my previous comments Clyde1998 (talk) 20:58, 17 November 2019 (UTC)
Oppose - what I have said previously and what has been said previously.Cutler (talk) 21:39, 17 November 2019 (UTC)
Oppose per Andymmu and Dweller. It's unnecessary as there's already a note in the table to highlight when the campaign began. – Britannicus (talk) 18:47, 18 November 2019 (UTC)
Poll of Polls for campaign period
what would people feel about a weighted poll of polls during the campaign period at the top of National poll results?, would be based on sum of call votes rather then just average of polls to give weighting to larger polls - Popeter45 21:45 17/11/2019 UTC
Naw or we open an endless discussion about how many polls should be included and which parties included and stuff, and there won't be a consensus on that until after the election. I did my own with Excel since the last election and it works fine.JezEuansson (talk) 22:20, 17 November 2019 (UTC)
What would be useful, but not wanting to add to the work of our volunteer graphmaker, would be a graph which instead of just the average of all polls contained the average of the most recent poll from each of the companies actively polling this election. The larger than usual house effects is having a randomising effect on the moving average relating to the frequency of each pollster contributing more or less to the average at any given time. 194.81.226.87 (talk) 16:38, 18 November 2019 (UTC)
Oppose Doing our own poll of polls would constitute WP:OR. Bondegezou (talk) 08:03, 18 November 2019 (UTC)
Strong oppose What Bondegezou said. Wikipedia is only a mirror held up to reflect reliable sources --Dweller (talk) Become old fashioned! 16:53, 18 November 2019 (UTC)
Comment We shouldn't publish OR averages here, but should we include polling averages published by reliable sourcecs? Such as the FT here. Ralbegen (talk) 17:10, 18 November 2019 (UTC)
Oppose As per Bondegezou. I would be happy if we included the final poll of polls from the psephologists such as Britian Elects, OpinionBee, FT, BBC, and of course John Curtice, if any or all of them do so. Andymmutalk 19:37, 18 November 2019 (UTC)
"Campaign period"
I'm not sure the heading of "Campaign period" should be used until Wednesday 6 November, when Parliament has formally dissolved. Campaigning in practice has obviously already started (some might argue it's been going on for weeks), but official campaigning cannot start until the dissolution of Parliament. I think it's important that the page reflects this, especially for anyone outside (and even inside) the UK taking an interest.
I reckon having a separate section for campaign period at all is a bad idea. It's not used in any of the previous articles. 86.132.18.158 (talk) 13:34, 3 November 2019 (UTC)
A separate table for the campaign section is a very good idea, and this can be made without columns for Plaid Cymru, The Independent Group and UKIP. I have no issue with this starting when parliament dissolves. Onetwothreeip (talk) 19:34, 3 November 2019 (UTC)
I’m glad it’s been done. Boscaswelltalk 07:45, 11 November 2019 (UTC)
I prefer it to be separate too, for the reasons Onetwothreeip gives. -- Cabalamat (talk) 17:18, 19 November 2019 (UTC)
Cite error: There are <ref group=lower-alpha> tags or {{efn}} templates on this page, but the references will not show without a {{reflist|group=lower-alpha}} template or {{notelist}} template (see the help page).