From Wikipedia, the free encyclopedia
2000 United States presidential election in Washington (state) Turnout 75.46% (pp [ 1]
County Results
Gore
40-50%
50-60%
60-70%
Bush
40-50%
50-60%
60-70%
70-80%
The 2000 United States presidential election in Washington took place on November 7, 2000, and was part of the 2000 United States presidential election . Voters chose 11 representatives, or electors to the Electoral College , who voted for president and vice president .
The State of Washington was considered a competitive swing state in 2000, and both campaigns sent advertisements into the state.[ 2] [ 3] King County , also the largest populated county, which he won with 60% of the vote. As of the 2024 presidential election [update] Whatcom County voted for the Republican candidate.
2000 United States presidential election in Washington (state)
Party
Candidate
Votes
Percentage
Electoral votes
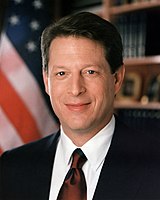
Democratic Albert Arnold Gore Jr. 1,247,652
50.13%
11
Republican
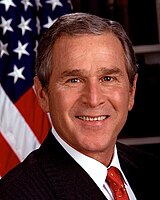
George Walker Bush
1,108,864
44.56%
0
Green /Progressive
Ralph Nader
103,002
4.14%
0
Libertarian
Harry Browne
13,135
0.53%
0
Reform
Pat Buchanan
7,171
0.29%
0
Natural Law
John Hagelin
2,927
0.12%
0
Constitution
Howard Phillips
1,989
0.08%
0
Workers World
Monica Moorehead
1,729
0.07%
0
-
Write Ins
1,312
0.05%
0
Socialist
David McReynolds
660
0.03%
0
Socialist Workers
James Harris
304
0.01%
0
Totals
2,488,745
100.00%
11
Voter turnout
59%
County
Al Gore
George W. Bush
Various candidates
Margin
Total
#
%
#
%
#
%
#
%
Adams
1,406
28.27%
3,440
69.16%
128
2.57%
-2,034
-40.89%
4,974
Asotin
2,736
34.26%
4,909
61.48%
340
4.26%
-2,173
-27.22%
7,985
Benton
19,512
32.64%
38,367
64.18%
1,900
3.18%
-18,855
-31.54%
59,779
Chelan
8,412
31.72%
16,980
64.03%
1,184
4.46%
-8,568
-32.31%
26,576
Clallam
13,779
42.75%
16,251
50.42%
2,202
6.83%
-2,472
-7.67%
32,232
Clark
61,767
45.57%
67,219
49.59%
6,558
4.84%
-5,452
-4.02%
135,544
Columbia
515
24.44%
1,523
72.28%
69
3.27%
-1,008
-47.84%
2,107
Cowlitz
18,233
49.33%
16,873
45.65%
1,856
5.02%
1,360
3.68%
36,962
Douglas
3,822
29.73%
8,512
66.22%
521
4.05%
-4,690
-36.49%
12,855
Ferry
932
30.68%
1,896
62.41%
210
6.91%
-964
-31.73%
3,038
Franklin
4,653
34.18%
8,594
63.13%
367
2.70%
-3,941
-28.95%
13,614
Garfield
300
22.57%
982
73.89%
47
3.54%
-682
-51.32%
1,329
Grant
7,073
29.72%
15,830
66.52%
895
3.76%
-8,757
-36.80%
23,798
Grays Harbor
13,304
51.22%
11,225
43.22%
1,443
5.56%
2,079
8.00%
25,972
Island
14,778
44.78%
16,408
49.72%
1,818
5.51%
-1,630
-4.94%
33,004
Jefferson
8,281
52.30%
6,095
38.50%
1,457
9.20%
2,186
13.80%
15,833
King
476,700
60.02%
273,171
34.40%
44,325
5.58%
203,529
25.62%
794,196
Kitsap
50,302
48.90%
46,427
45.13%
6,138
5.97%
3,875
3.77%
102,867
Kittitas
5,516
39.16%
7,727
54.86%
843
5.98%
-2,211
-15.70%
14,086
Klickitat
3,062
37.43%
4,557
55.70%
562
6.87%
-1,495
-18.27%
8,181
Lewis
9,891
32.99%
18,565
61.91%
1,530
5.10%
-8,674
-28.92%
29,986
Lincoln
1,417
27.27%
3,546
68.23%
234
4.50%
-2,129
-40.96%
5,197
Mason
10,876
48.38%
10,257
45.63%
1,347
5.99%
619
2.75%
22,480
Okanogan
4,335
29.29%
9,384
63.41%
1,079
7.29%
-5,049
-34.12%
14,798
Pacific
4,895
51.42%
4,042
42.46%
582
6.11%
853
8.96%
9,519
Pend Oreille
1,973
36.28%
3,076
56.56%
389
7.15%
-1,103
-20.28%
5,438
Pierce
138,249
51.41%
118,431
44.04%
12,246
4.55%
19,818
7.37%
268,926
San Juan
4,426
52.54%
3,005
35.67%
993
11.79%
1,421
16.87%
8,424
Skagit
20,432
45.18%
22,163
49.01%
2,626
5.81%
-1,731
-3.83%
45,221
Skamania
1,753
41.26%
2,151
50.62%
345
8.12%
-398
-9.36%
4,249
Snohomish
129,612
51.57%
109,615
43.61%
12,101
4.81%
19,997
7.96%
251,328
Spokane
74,604
43.35%
89,299
51.88%
8,209
4.77%
-14,695
-8.53%
172,112
Stevens
5,560
30.89%
11,299
62.78%
1,140
6.33%
-5,739
-31.89%
17,999
Thurston
50,467
51.80%
39,924
40.98%
7,031
7.22%
10,543
10.82%
97,422
Wahkiakum
803
40.70%
1,033
52.36%
137
6.94%
-230
-11.66%
1,973
Walla Walla
7,188
33.64%
13,304
62.27%
873
4.09%
-6,116
-28.63%
21,365
Whatcom
34,033
46.14%
34,287
46.49%
5,437
7.37%
-254
-0.35%
73,757
Whitman
6,509
40.09%
9,003
55.45%
725
4.47%
-2,494
-15.36%
16,237
Yakima
25,546
37.91%
39,494
58.61%
2,342
3.48%
-13,948
-20.70%
67,382
Totals
1,247,652
50.13%
1,108,864
44.56%
132,229
5.31%
138,788
5.57%
2,488,745
Counties that flipped from Democratic to Republican [ edit ] By congressional district [ edit ] Gore won 6 of 9 congressional districts. Both candidates won a district held by the other party.[ 4]
Rachel Lake
Debbie Aldrich
Paul Steinberg
Carol Sue Perkins
Tim Hattenburg
Debbie Regala Vic Battson
Carl Schwartz
Nancy McGinnis
Jim Frush
Charlotte Coker


