From Wikipedia, the free encyclopedia
Election in South Dakota
The 1940 United States presidential election in South Dakota took place on November 5, 1940, as part of the 1940 United States presidential election . Voters chose four[ 2] Electoral College , who voted for president and vice president .
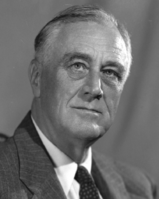
South Dakota was won by Wendell Willkie (R –New York ), running with Minority Leader Charles L. McNary , with 57.41% of the popular vote, against incumbent President Franklin D. Roosevelt (D –New York ), running with Secretary Henry A. Wallace , with 42.59% of the popular vote.[ 3] [ 4]
South Dakota would prove to be Willkie's largest win of any state, as he carried the state by 14.82 percentage points.[ 5] [ 6]
Results
Results by county
County[ 7]
Wendell Lewis Willkie
Franklin Delano Roosevelt
Margin
Total votes cast
#
%
#
%
#
%
Aurora
1,408
50.41%
1,385
49.59%
23
0.82%
2,793
Beadle
4,356
45.33%
5,253
54.67%
-897
-9.33%
9,609
Bennett
915
51.55%
860
48.45%
55
3.10%
1,775
Bon Homme
3,046
55.29%
2,463
44.71%
583
10.58%
5,509
Brookings
5,016
65.25%
2,671
34.75%
2,345
30.51%
7,687
Brown
6,598
45.05%
8,048
54.95%
-1,450
-9.90%
14,646
Brule
1,352
42.42%
1,835
57.58%
-483
-15.16%
3,187
Buffalo
491
55.42%
395
44.58%
96
10.84%
886
Butte
2,164
60.99%
1,384
39.01%
780
21.98%
3,548
Campbell
1,733
80.64%
416
19.36%
1,317
61.28%
2,149
Charles Mix
2,993
47.54%
3,303
52.46%
-310
-4.92%
6,296
Clark
2,622
61.75%
1,624
38.25%
998
23.50%
4,246
Clay
2,463
52.08%
2,266
47.92%
197
4.17%
4,729
Codington
4,320
53.83%
3,705
46.17%
615
7.66%
8,025
Corson
1,709
56.27%
1,328
43.73%
381
12.55%
3,037
Custer
1,796
60.94%
1,151
39.06%
645
21.89%
2,947
Davison
3,659
46.38%
4,230
53.62%
-571
-7.24%
7,889
Day
3,277
49.85%
3,297
50.15%
-20
-0.30%
6,574
Deuel
2,304
66.40%
1,166
33.60%
1,138
32.80%
3,470
Dewey
1,396
56.36%
1,081
43.64%
315
12.72%
2,477
Douglas
1,977
65.53%
1,040
34.47%
937
31.06%
3,017
Edmunds
2,341
61.87%
1,443
38.13%
898
23.73%
3,784
Fall River
2,420
63.27%
1,405
36.73%
1,015
26.54%
3,825
Faulk
1,431
54.41%
1,199
45.59%
232
8.82%
2,630
Grant
2,981
59.38%
2,039
40.62%
942
18.76%
5,020
Gregory
2,478
54.91%
2,035
45.09%
443
9.82%
4,513
Haakon
1,129
61.49%
707
38.51%
422
22.98%
1,836
Hamlin
2,279
64.00%
1,282
36.00%
997
28.00%
3,561
Hand
2,002
55.46%
1,608
44.54%
394
10.91%
3,610
Hanson
1,408
53.66%
1,216
46.34%
192
7.32%
2,624
Harding
755
52.98%
670
47.02%
85
5.96%
1,425
Hughes
1,982
59.27%
1,362
40.73%
620
18.54%
3,344
Hutchinson
5,051
82.08%
1,103
17.92%
3,948
64.15%
6,154
Hyde
1,018
60.31%
670
39.69%
348
20.62%
1,688
Jackson
620
58.77%
435
41.23%
185
17.54%
1,055
Jerauld
1,576
63.17%
919
36.83%
657
26.33%
2,495
Jones
832
62.09%
508
37.91%
324
24.18%
1,340
Kingsbury
3,551
70.26%
1,503
29.74%
2,048
40.52%
5,054
Lake
4,179
68.87%
1,889
31.13%
2,290
37.74%
6,068
Lawrence
5,288
60.07%
3,515
39.93%
1,773
20.14%
8,803
Lincoln
4,081
66.59%
2,048
33.41%
2,033
33.17%
6,129
Lyman
1,409
56.05%
1,105
43.95%
304
12.09%
2,514
Marshall
1,989
50.21%
1,972
49.79%
17
0.43%
3,961
McCook
3,310
66.12%
1,696
33.88%
1,614
32.24%
5,006
McPherson
2,839
77.46%
826
22.54%
2,013
54.92%
3,665
Meade
2,560
57.00%
1,931
43.00%
629
14.01%
4,491
Mellette
990
52.24%
905
47.76%
85
4.49%
1,895
Miner
2,095
60.55%
1,365
39.45%
730
21.10%
3,460
Minnehaha
16,664
57.62%
12,259
42.38%
4,405
15.23%
28,923
Moody
2,749
60.17%
1,820
39.83%
929
20.33%
4,569
Pennington
6,603
57.51%
4,878
42.49%
1,725
15.02%
11,481
Perkins
1,777
57.36%
1,321
42.64%
456
14.72%
3,098
Potter
1,278
54.80%
1,054
45.20%
224
9.61%
2,332
Roberts
3,504
48.30%
3,750
51.70%
-246
-3.39%
7,254
Sanborn
1,732
55.34%
1,398
44.66%
334
10.67%
3,130
Shannon
1,094
58.04%
791
41.96%
303
16.07%
1,885
Spink
2,975
48.70%
3,134
51.30%
-159
-2.60%
6,109
Stanley
679
55.66%
541
44.34%
138
11.31%
1,220
Sully
840
64.71%
458
35.29%
382
29.43%
1,298
Todd
1,245
50.14%
1,238
49.86%
7
0.28%
2,483
Tripp
2,492
54.40%
2,089
45.60%
403
8.80%
4,581
Turner
4,644
72.36%
1,774
27.64%
2,870
44.72%
6,418
Union
3,116
54.44%
2,608
45.56%
508
8.87%
5,724
Walworth
1,921
55.11%
1,565
44.89%
356
10.21%
3,486
Washabaugh
358
48.91%
374
51.09%
-16
-2.19%
732
Washington
335
52.59%
302
47.41%
33
5.18%
637
Yankton
4,179
57.70%
3,064
42.30%
1,115
15.39%
7,243
Ziebach
691
50.15%
687
49.85%
4
0.29%
1,378
Armstrong [ a] 0
N/A
0
N/A
N/A
N/A
0
Totals
177,065
57.41%
131,362
42.59%
45,703
14.82%
308,427
See also
Notes
^ No returns were canvassed for Armstrong County and voters from this county were listed in neighbouring counties.[ 8]
References


