California's 48th congressional district
| California's 48th congressional district | |
|---|---|
 California's 48th congressional district since January 3, 2013. | |
| Representative | |
| Median household income | $89,807[1] |
| Ethnicity | |
| Cook PVI | R+4[3] |
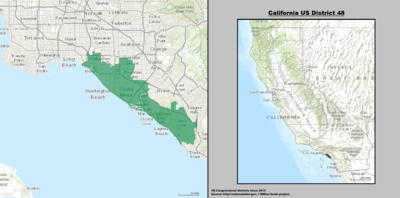
California's 48th congressional district is a congressional district in the U.S. state of California based in Orange County in Southern California. It is currently represented by Democrat Harley Rouda.
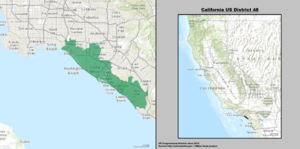
The district includes Costa Mesa, Fountain Valley, Huntington Beach, Laguna Beach, Laguna Niguel, Newport Beach, Seal Beach and parts of Garden Grove, Midway City, Aliso Viejo, Santa Ana and Westminster.[4]
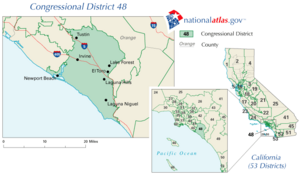
From 2003 to 2013, the district included the cities of Aliso Viejo, Dana Point, Irvine, Laguna Beach, Laguna Hills, Laguna Niguel, Laguna Woods, Lake Forest (formerly known as El Toro), Tustin, parts of Irvine and parts of Newport Beach and San Juan Capistrano.
Following the 2018 US General Election, Democrat Harley Rouda became the district's representative, declaring victory after amassing a 3.6% and growing lead in the results, defeating incumbent Republican Dana Rohrabacher.[5]
Competitiveness
In statewide races
| Election results from statewide races | ||
|---|---|---|
| Year | Office | Results |
| 1992 | President[6] | Bush 44.1% – 29.1% |
| Senator[7] | Herschensohn 58.2% – 32.1% | |
| Senator (Special)[8] | Seymour 51.9% – 38.4% | |
| 1994 | Governor[9] | Wilson 71.8% – 24.1% |
| Senator[10] | Huffington 61.1% - 29.9% | |
| 1996 | President[11] | Dole 55.5% - 33.8% |
| 1998 | Governor[12] | Lungren 56.5% – 40.1% |
| Senator[13] | Fong 59.6% – 36.3% | |
| 2000 | President[14] | Bush 60.4% – 35.7% |
| Senator[15] | Campbell 53.1% – 39.2% | |
| 2002 | Governor[16] | Simon 59.4% – 32.8% |
| 2003 | Recall[17][18] | |
| Schwarzenegger 65.2% – 16.3% | ||
| 2004 | President[19] | Bush 58.3% – 40.4% |
| Senator[20] | Jones 51.4% – 43.7% | |
| 2006 | Governor[21] | Schwarzenegger 71.5% – 24.0% |
| Senator[22] | Mountjoy 49.7% – 45.5% | |
| 2008 | President[23] | Obama 49.3% – 48.6% |
| 2010 | Governor[24] | Whitman 58.7% – 36.4% |
| Senator[25] | Fiorina 59.3% – 36.3% | |
| 2012 | President[26] | Romney 54.7% – 43.0% |
| Senator[27] | Emken 55.1% – 44.9% | |
| 2014 | Governor[28] | Kashkari 57.6% – 42.4% |
| 2016 | President[29] | Clinton 47.9% – 46.2% |
| Senator[30] | Harris 56.4% – 43.6% | |
| 2018 | Governor[31] | Cox 52.1% – 47.9% |
| Senator[32] | Feinstein 55.1% – 44.9% | |
| Lieutenant Governor[33] | Kounalakis 56.8% – 43.2% | |
| Secretary of State[33] | Meuser 50.7% – 49.3% | |
| Controller[33] | Yee 50.2% – 49.8% | |
| Treasurer[33] | Conlon 51.0% – 49.0% | |
| Attorney General[33] | Bailey 51.1% – 48.9% | |
| Insurance Commissioner[33] | Poizner 61.2% – 38.8% | |
| State Board of Equalization, 4th District[33] | Anderson 54.4% – 45.6% | |
List of members representing the district
District created January 3, 1993.
Election results
District created January 3, 1993.
1992
| Party | Candidate | Votes | % | |
|---|---|---|---|---|
| Republican | Ron Packard (Incumbent) | 140,935 | 61.1 | |
| Democratic | Michael P. "Mike" Farber | 67,415 | 29.3 | |
| Peace and Freedom | Donna White | 13,396 | 5.8 | |
| Libertarian | Ted Lowe | 8,749 | 3.8 | |
| Total votes | 230,495 | 100.0 | ||
| Republican hold | ||||
1994
| Party | Candidate | Votes | % | |
|---|---|---|---|---|
| Republican | Ron Packard (Incumbent) | 143,570 | 73.4 | |
| Democratic | Andrei Leschick | 43,523 | 22.2 | |
| Reform | Donna White | 8,543 | 4.4 | |
| Total votes | 195,636 | 100.0 | ||
| Republican hold | ||||
1996
| Party | Candidate | Votes | % | |
|---|---|---|---|---|
| Republican | Ron Packard (Incumbent) | 145,814 | 65.9 | |
| Democratic | Dan Farrell | 59,558 | 26.9 | |
| Reform | William Dreu | 8,013 | 3.6 | |
| Natural Law | Sharon Miles | 8,006 | 3.6 | |
| Total votes | 221,391 | 100.0 | ||
| Republican hold | ||||
1998
| Party | Candidate | Votes | % | |
|---|---|---|---|---|
| Republican | Ron Packard (Incumbent) | 138,948 | 76.9 | |
| Natural Law | Sharon K. Miles | 23,262 | 12.9 | |
| Libertarian | Daniel L. Muhe | 18,509 | 10.2 | |
| Total votes | 180,719 | 100.0 | ||
| Republican hold | ||||
2000
| Party | Candidate | Votes | % | |
|---|---|---|---|---|
| Republican | Darrell Issa | 160,627 | 61.5 | |
| Democratic | Peter Kouvelis | 74,073 | 28.4 | |
| Reform | Eddie Rose | 11,240 | 4.3 | |
| Natural Law | Sharon K. Miles | 8,269 | 3.1 | |
| Libertarian | Joe Michael Cobb | 7,269 | 2.7 | |
| Total votes | 261,478 | 100.0 | ||
| Republican hold | ||||
2002
| Party | Candidate | Votes | % | |
|---|---|---|---|---|
| Republican | Christopher Cox (Incumbent) | 122,884 | 68.5 | |
| Democratic | John Graham | 51,058 | 28.4 | |
| Libertarian | Joe Michael Cobb | 5,607 | 3.1 | |
| Total votes | 179,549 | 100.0 | ||
| Republican hold | ||||
2004
| Party | Candidate | Votes | % | |
|---|---|---|---|---|
| Republican | Christopher Cox (Incumbent) | 189,004 | 65.0 | |
| Democratic | John Graham | 93,525 | 32.2 | |
| Libertarian | Bruce Cohen | 8,343 | 2.8 | |
| Total votes | 290,872 | 100.0 | ||
| Republican hold | ||||
2005
| Party | Candidate | Votes | % | |
|---|---|---|---|---|
| Republican | John Campbell | 46,184 | 44.4 | |
| Democratic | Steve Young | 28,853 | 27.8 | |
| American Independent | Jim Gilchrist | 26,507 | 25.5 | |
| Green | Bea Tiritilli | 1,430 | 1.4 | |
| Libertarian | Bruce Cohen | 974 | 0.9 | |
| Invalid or blank votes | 457 | 0.4 | ||
| Total votes | 104,405 | 100.0 | ||
| Turnout | 25.7 | |||
| Republican hold | ||||
2006
| Party | Candidate | Votes | % | |
|---|---|---|---|---|
| Republican | John Campbell (Incumbent) | 120,130 | 59.9 | |
| Democratic | Steve Young | 74,647 | 37.2 | |
| Libertarian | Bruce Cohen | 5,750 | 2.9 | |
| Total votes | 200,527 | 100.0 | ||
| Republican hold | ||||
2008
| Party | Candidate | Votes | % | |
|---|---|---|---|---|
| Republican | John Campbell (Incumbent) | 171,658 | 55.7 | |
| Democratic | Steve Young | 125,537 | 40.6 | |
| Libertarian | Don Patterson | 11,507 | 3.7 | |
| Total votes | 308,702 | 100.00 | ||
| Republican hold | ||||
2010
| Party | Candidate | Votes | % | |
|---|---|---|---|---|
| Republican | John Campbell (Incumbent) | 145,481 | 60.0 | |
| Democratic | Beth Krom | 88,465 | 36.4 | |
| Libertarian | Mike Binkley | 8,773 | 3.6 | |
| Total votes | 242,719 | 100.0 | ||
| Republican hold | ||||
2012
| Party | Candidate | Votes | % | |
|---|---|---|---|---|
| Republican | Dana Rohrabacher (Incumbent) | 177,144 | 61.0 | |
| Democratic | Ron Varasteh | 113,358 | 39.0 | |
| Total votes | 290,502 | 100.0 | ||
| Republican hold | ||||
2014
| Party | Candidate | Votes | % | |
|---|---|---|---|---|
| Republican | Dana Rohrabacher (Incumbent) | 112,082 | 64.1 | |
| Democratic | Suzanne Joyce Savary | 62,713 | 35.9 | |
| Total votes | 174,795 | 100.0 | ||
| Republican hold | ||||
2016
| Party | Candidate | Votes | % | |
|---|---|---|---|---|
| Republican | Dana Rohrabacher (Incumbent) | 178,701 | 58.3 | |
| Democratic | Suzanne Joyce Savary | 127,715 | 41.7 | |
| Total votes | 306,416 | 100.0 | ||
| Republican hold | ||||
2018
| Party | Candidate | Votes | % | |||
|---|---|---|---|---|---|---|
| Democratic | Harley Rouda | 157,837 | 53.6 | |||
| Republican | Dana Rohrabacher (Incumbent) | 136,899 | 46.4 | |||
| Total votes | 294,736 | 100.0 | ||||
| Democratic gain from Republican | ||||||
Historical district boundaries
From 2003 through 2013, the district consisted of many of Orange's south-central suburbs, including Irvine, and Newport Beach. Due to redistricting after the 2010 United States Census, the district has moved south east along the coast of Orange and now includes Laguna Beach and Huntington Beach.
See also
- List of United States congressional districts
- California 48th congressional district special election, 2005
References
- ^ US Census
- ^ LA Times
- ^ "Partisan Voting Index – Districts of the 115th Congress" (PDF). The Cook Political Report. April 7, 2017. Retrieved April 7, 2017.
- ^ "California's 48th Congressional District - CA-48 Representatives & District Map - GovTrack.us". GovTrack.us.
- ^ Andrew Gumbel (2018-11-10). "Republican dubbed 'Russia's favorite congressman' loses seat after 30 years". The Guardian. Retrieved 2018-11-10.
- ^ Statement of Vote (1992 President)
- ^ Statement of Vote (1992 Senate)
- ^ Statement of Vote (1992 Senate)
- ^ Statement of Vote (1994 Governor)
- ^ Statement of Vote (1994 Senate)
- ^ Statement of Vote (1996 President)
- ^ Statement of Vote (1998 Governor) Archived September 29, 2011, at the Wayback Machine
- ^ Statement of Vote (1998 Senate) Archived September 29, 2011, at the Wayback Machine
- ^ Statement of Vote (2000 President)
- ^ Statement of Vote (2000 Senator)
- ^ Statement of Vote (2002 Governor)
- ^ Statement of Vote (2003 Recall Question)
- ^ Statement of Vote (2003 Governor)
- ^ Statement of Vote (2004 President)
- ^ Statement of Vote (2004 Senator)
- ^ Statement of Vote (2006 Governor)
- ^ Statement of Vote (2006 Senator)
- ^ Statement of Vote (2008 President)
- ^ Statement of Vote (2010 Governor)
- ^ Statement of Vote (2010 Senator)
- ^ Statement of Vote (2012 President)
- ^ Statement of Vote (2012 Senator)
- ^ Statement of Vote (2014 Governor)
- ^ Statement of Vote (2016 President)
- ^ Statement of Vote (2016 Senator)
- ^ Statement of Vote (2018 Governor)
- ^ Statement of Vote (2018 Senator)
- ^ a b c d e f g [1]
- ^ 1992 election results
- ^ 1994 election results
- ^ 1996 election results
- ^ 1998 election results
- ^ 2000 election results
- ^ 2002 election results
- ^ 2004 election results
- ^ "2005 Special Election Results" (PDF). Secretary of State of California. 2005-12-16. Retrieved 2019-09-15.
- ^ 2006 election results
- ^ 2008 election results
- ^ 2010 election results
- ^ 2012 election results
- ^ 2014 election results
- ^ 2016 election results
- ^ 2018 election results
External links
- Congressional districts of California
- Government in Orange County, California
- Aliso Viejo, California
- Costa Mesa, California
- Fountain Valley, California
- Garden Grove, California
- Huntington Beach, California
- Laguna Beach, California
- Laguna Niguel, California
- Newport Beach, California
- Santa Ana, California
- Seal Beach, California
- Westminster, California
- Constituencies established in 1993
- 1993 establishments in California


