
Obion County, Tennessee
Obion County | |
|---|---|
 Location within the U.S. state of Tennessee | |
 Tennessee's location within the U.S. | |
| Coordinates: 36°22′N 89°09′W / 36.36°N 89.15°W | |
| Country | |
| State | |
| Founded | 1823 |
| Seat | Union City |
| Largest city | Union City |
| Area | |
| • Total | 555 sq mi (1,438 km2) |
| • Land | 545 sq mi (1,411 km2) |
| • Water | 10 sq mi (27 km2) 1.88% |
| Population (2000) | |
| • Total | 32,450 |
| • Density | 60/sq mi (23/km2) |
| Time zone | UTC−6 (Central) |
| • Summer (DST) | UTC−5 (CDT) |
Obion County is a county located in the State of Tennessee. Obion County was formed in 1823 from Native American lands. It is thought to have been named after the Obion River. As of 2000, the population of Obion County was 32,450. The county seat is Union CityTemplate:GR.
Obion County is part of the Union City, TN–KY Micropolitan Statistical Area.
Geography
According to the U.S. Census Bureau, the county has a total area of 555 square miles (1,438 km²), of which, 545 square miles (1,411 km²) of it is land and 10 square miles (27 km²) of it (1.88%) is water.
Parks and Recreation
Adjacent counties
- Fulton County, Kentucky (north)
- Weakley County (east)
- Gibson County (southeast)
- Dyer County (southwest)
- Lake County (west)
National protected area
Demographics

As of the censusTemplate:GR of 2000, there were 32,450 people, 13,182 households, and 9,398 families residing in the county. The population density was 60 people per square mile (23/km²). There were 14,489 housing units at an average density of 27 per square mile (10/km²). The racial makeup of the county was 88.16% White, 9.85% Black or African American, 0.14% Native American, 0.19% Asian, 0.05% Pacific Islander, 0.91% from other races, and 0.71% from two or more races. 1.90% of the population were Hispanic or Latino of any race.
There were 13,182 households out of which 31.00% had children under the age of 18 living with them, 56.40% were married couples living together, 11.10% had a female householder with no husband present, and 28.70% were non-families. 25.70% of all households were made up of individuals and 12.10% had someone living alone who was 65 years of age or older. The average household size was 2.42 and the average family size was 2.89.
In the county, the population was spread out with 23.40% under the age of 18, 8.40% from 18 to 24, 27.70% from 25 to 44, 25.40% from 45 to 64, and 15.20% who were 65 years of age or older. The median age was 39 years. For every 100 females there were 93.40 males. For every 100 females age 18 and over, there were 89.90 males.
The median income for a household in the county was $32,764, and the median income for a family was $40,533. Males had a median income of $32,963 versus $20,032 for females. The per capita income for the county was $17,409. About 10.10% of families and 13.30% of the population were below the poverty line, including 18.60% of those under age 18 and 15.10% of those age 65 or over.
Cities and towns
Schools
List of schools in the Obion County School System.
| School | Team Mascot | School Colors |
|---|---|---|
| Lake Road Elementary School | Generals | Blue/Orange |
| Hillcrest Elementary School | Cougars | Red/Blue |
| Ridgemont Elementary School | Mustangs | Red/Yellow |
| Black Oak Elementary School | Eagles | Yellow/Blue |
| South Fulton Elementary School | Red Devils | Red |
| South Fulton Middle/High School | Red Devils | Red |
| Obion County Central High School | Rebels | Red/Gray/Blue |
| Union City Middle/High School | Tornadoes | Purple/Gold |
Media
- WENK-AM 1240 "The Greatest Hits of All Time"
- WWKF-FM 99.3 "Today's Best Music with Ace & TJ in the Morning"
- wquake -FM-105.7
References
External links
Places adjacent to Obion County, Tennessee | ||||||||||||||||
|---|---|---|---|---|---|---|---|---|---|---|---|---|---|---|---|---|
| ||||||||||||||||
Municipalities and communities of Obion County, Tennessee, United States | ||
|---|---|---|
| Cities | 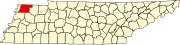 | |
| Towns | ||
| Unincorporated communities | ||
| Footnotes | ‡This populated place also has portions in an adjacent county or counties | |