Ohio's 7th congressional district
Appearance
| Ohio's 7th congressional district | |
|---|---|
 Ohio's 7th congressional district - since January 3, 2013. | |
| Representative | |
| Population (2016) | 728,336[1] |
| Median household income | 47,805 |
| Ethnicity |
|
| Cook PVI | R+12[2] |
Ohio's 7th congressional district is represented by Bob Gibbs. It is currently located in the northeastern section of the state, including the city of Canton. It was redrawn in 2012, following the 2010 United States Census, and was previously located in southwest Ohio, including the city of Springfield.
List of representatives
| Representative | Party | Cong ress |
Years | Notes |
|---|---|---|---|---|
| District created March 4, 1823 | ||||
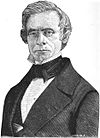 Samuel Finley Vinton Samuel Finley Vinton
|
Adams-Clay Democratic-Republican |
18 | March 4, 1823 – March 3, 1825 |
Redistricted to the 6th district |
| Adams | 19 20 |
March 4, 1825 – March 3, 1829 | ||
| Anti-Jacksonian | 21 22 |
March 4, 1829 – March 3, 1833 | ||
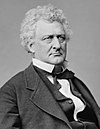 William Allen William Allen
|
Jacksonian | 23 | March 4, 1833 – March 3, 1835 |
[data missing] |
 William K. Bond William K. Bond
|
Anti-Jacksonian | 24 | March 4, 1835 – March 3, 1837 |
[data missing] |
| Whig | 25 26 |
March 4, 1837 – March 3, 1841 | ||
 William Russell William Russell
|
Whig | 27 | March 4, 1841 – March 3, 1843 |
[data missing] |
 Joseph J. McDowell Joseph J. McDowell
|
Democratic | 28 29 |
March 4, 1843 – March 3, 1847 |
[data missing] |
 Jonathan D. Morris Jonathan D. Morris
|
Democratic | 30 31 |
March 4, 1847 – March 3, 1851 |
Elected after Rep-elect Thomas L. Hamer died before start of term |
 Nelson Barrere Nelson Barrere
|
Whig | 32 | March 4, 1851 – March 3, 1853 |
[data missing] |
 Aaron Harlan Aaron Harlan
|
Whig | 33 | March 4, 1853 – March 3, 1855 |
[data missing] |
| Opposition | 34 | March 4, 1855 – March 3, 1857 | ||
| Republican | 35 | March 4, 1857 – March 3, 1859 | ||
 Thomas Corwin Thomas Corwin
|
Republican | 36 37 |
March 4, 1859 – March 12, 1861 |
Resigned to become Minister to Mexico |
 Richard A. Harrison Richard A. Harrison
|
Unionist | 37 | July 4, 1861 – March 3, 1863 |
[data missing] |
 Samuel S. Cox Samuel S. Cox
|
Democratic | 38 | March 4, 1863 – March 3, 1865 |
Redistricted from the 12th district |
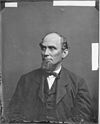 Samuel Shellabarger Samuel Shellabarger
|
Republican | 39 40 |
March 4, 1865 – March 3, 1869 |
[data missing] |
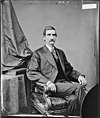 James J. Winans James J. Winans
|
Republican | 41 | March 4, 1869 – March 3, 1871 |
[data missing] |
 Samuel Shellabarger Samuel Shellabarger
|
Republican | 42 | March 4, 1871 – March 3, 1873 |
[data missing] |
 Lawrence T. Neal Lawrence T. Neal
|
Democratic | 43 44 |
March 4, 1873 – March 3, 1877 |
[data missing] |
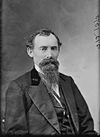 Henry L. Dickey Henry L. Dickey
|
Democratic | 45 | March 4, 1877 – March 3, 1879 |
Redistricted to the 11th district |
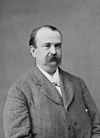 Frank H. Hurd Frank H. Hurd
|
Democratic | 46 | March 4, 1879 – March 3, 1881 |
[data missing] |
 John P. Leedom John P. Leedom
|
Democratic | 47 | March 4, 1881 – March 3, 1883 |
[data missing] |
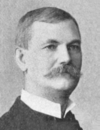 Henry Lee Morey Henry Lee Morey
|
Republican | 48 | March 4, 1883 – June 20, 1884 |
Lost contested election |
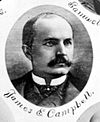 James E. Campbell James E. Campbell
|
Democratic | 48 | June 20, 1884 – March 3, 1885 |
Won contested election Redistricted to the 3rd district |
 George E. Seney George E. Seney
|
Democratic | 49 | March 4, 1885 – March 3, 1887 |
Redistricted from the 5th district Redistricted to the 5th district |
 James E. Campbell James E. Campbell
|
Democratic | 50 | March 4, 1887 – March 3, 1889 |
Redistricted from the 3rd district |
 Henry Lee Morey Henry Lee Morey
|
Republican | 51 | March 4, 1889 – March 3, 1891 |
[data missing] |
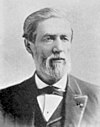 William E. Haynes William E. Haynes
|
Democratic | 52 | March 4, 1891 – March 3, 1893 |
Redistricted from the 10th district |
 George W. Wilson George W. Wilson
|
Republican | 53 54 |
March 4, 1893 – March 3, 1897 |
[data missing] |
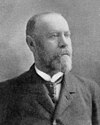 Walter L. Weaver Walter L. Weaver
|
Republican | 55 56 |
March 4, 1897 – March 3, 1901 |
[data missing] |
 Thomas B. Kyle Thomas B. Kyle
|
Republican | 57 58 |
March 4, 1901 – March 3, 1905 |
[data missing] |
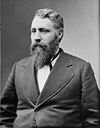 J. Warren Keifer J. Warren Keifer
|
Republican | 59 60 61 |
March 4, 1905 – March 3, 1911 |
[data missing] |
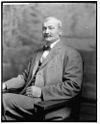 James D. Post James D. Post
|
Democratic | 62 63 |
March 4, 1911 – March 3, 1915 |
[data missing] |
 Simeon D. Fess Simeon D. Fess
|
Republican | 64 65 66 67 |
March 4, 1915 – March 3, 1923 |
Redistricted from the 6th district |
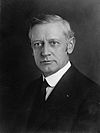 Charles Brand Charles Brand
|
Republican | 68 69 70 71 72 |
March 4, 1923 – March 3, 1933 |
[data missing] |
 Leroy T. Marshall Leroy T. Marshall
|
Republican | 73 74 |
March 4, 1933 – January 3, 1937 |
[data missing] |
 Arthur W. Aleshire Arthur W. Aleshire
|
Democratic | 75 | January 3, 1937 – January 3, 1939 |
[data missing] |
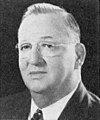 Clarence J. Brown Clarence J. Brown
|
Republican | 76 77 78 79 80 81 82 83 84 85 86 87 88 89 |
January 3, 1939 – August 23, 1965 |
Died |
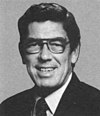 Bud Brown Bud Brown
|
Republican | 89 90 91 92 93 94 95 96 97 |
November 2, 1965 – January 3, 1983 |
[data missing] |
 Mike DeWine Mike DeWine
|
Republican | 98 99 100 101 |
January 3, 1983 – January 3, 1991 |
Elected Lieutenant Governor of Ohio |
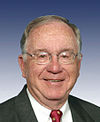 Dave Hobson Dave Hobson
|
Republican | 102 103 104 105 106 107 108 109 110 |
January 3, 1991 – January 3, 2009 |
[data missing] |
 Steve Austria Steve Austria
|
Republican | 111 112 |
January 3, 2009 – January 3, 2013 |
[data missing] |
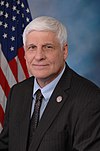 Bob Gibbs Bob Gibbs
|
Republican | 113 114 |
January 3, 2013 – Present |
Redistricted from the 18th district |
Recent election results
The following chart shows historic election results. Bold type indicates victor. Italic type indicates incumbent.
Historical district boundaries

See also
References
- ^ https://www.census.gov/mycd/?st=39&cd=07
- ^ "Partisan Voting Index – Districts of the 115th Congress" (PDF). The Cook Political Report. April 7, 2017. Retrieved April 7, 2017.
- ^ "2012 Election Results". Ohio Secretary of State.
- Martis, Kenneth C. (1989). The Historical Atlas of Political Parties in the United States Congress. New York: Macmillan Publishing Company.
{{cite book}}: Cite has empty unknown parameter:|coauthors=(help) - Martis, Kenneth C. (1982). The Historical Atlas of United States Congressional Districts. New York: Macmillan Publishing Company.
{{cite book}}: Cite has empty unknown parameter:|coauthors=(help) - Congressional Biographical Directory of the United States 1774–present
