
List of the most populous counties in the United States


This is a list of the 100 most populous counties in the United States based on the national decennial US census conducted on April 1, 2020 and vintage Census population estimates for July 1, 2021.[1]
Many of the counties on the list include major cities or metropolitan areas in all parts of the United States. Six of the listed counties have consolidated city and county government, namely the City and County of Honolulu, Metropolitan Government of Nashville and Davidson County, Tennessee, City and County of Philadelphia, City and County of San Francisco, City of Jacksonville and Duval County and City and County of Denver.[2][3][4] New York County, Bronx County, Kings County, Queens County and Richmond County are coterminous with the respective boroughs of New York City; they fall under the jurisdiction of the combined city government. Independent cities are not counted.
Many of the most populous counties in the following list are in Southern California, Illinois, Texas and New York and roughly correspond to the most populous cities in the United States. Counties in the Western United States are typically larger, so they often have higher raw populations even with comparable population densities.
List
This list lists the most populous US counties sorted according to both the 2020 official enumeration and 2021 vintage population estimates by the United States Census Bureau (USCB).
| Rank | County | State | Land area | April 1, 2020 census |
July 1, 2021 estimates |
Mid-2020 to mid-2021 change |
County seat | ||
|---|---|---|---|---|---|---|---|---|---|
| km2[5] | mi2[6] | absolute | % | ||||||
| 1 | Los Angeles | California | 10,509.87 | 4,057.88 | 10,014,009 | 9,829,544 | -184,465 | -1.8 | Los Angeles |
| 2 | Cook | Illinois | 2,448.38 | 945.33 | 5,275,541 | 5,173,146 | -102,395 | -1.9 | Chicago |
| 3 | Harris | Texas | 4,411.99 | 1,703.48 | 4,731,145 | 4,728,030 | -3,115 | -0.1 | Houston |
| 4 | Maricopa | Arizona | 23,828.26 | 9,200.14 | 4,420,568 | 4,496,588 | 76,020 | 1.7 | Phoenix |
| 5 | San Diego | California | 10,895.12 | 4,206.63 | 3,298,634 | 3,286,069 | -12,565 | -0.4 | San Diego |
| 6 | Orange | 2,047.56 | 790.57 | 3,186,989 | 3,167,809 | -19,180 | -0.6 | Santa Ana | |
| 7 | Miami-Dade | Florida | 4,915.06 | 1,897.72 | 2,701,767 | 2,662,777 | -38,990 | -1.4 | Miami |
| 8 | Kings | New York | 183.41 | 70.82 | 2,736,074 | 2,641,052 | -95,022 | -3.5 | Brooklyn, NYC |
| 9 | Dallas | Texas | 2,256.60 | 871.28 | 2,613,539 | 2,586,050 | -27,489 | -1.1 | Dallas |
| 10 | Riverside | California | 18,664.70 | 7,206.48 | 2,418,185 | 2,458,395 | 40,210 | 1.7 | Riverside |
| 11 | Queens | New York | 281.10 | 108.53 | 2,405,464 | 2,331,143 | -74,321 | -3.1 | Queens, NYC |
| 12 | Clark | Nevada | 20,438.71 | 7,891.43 | 2,265,461 | 2,292,476 | 27,015 | 1.2 | Las Vegas |
| 13 | King | Washington | 5,479.29 | 2,115.57 | 2,269,675 | 2,252,305 | -17,370 | -0.8 | Seattle |
| 14 | San Bernardino | California | 51,947.23 | 20,056.94 | 2,181,654 | 2,194,710 | 13,056 | 0.6 | San Bernardino |
| 15 | Tarrant | Texas | 2,236.74 | 863.61 | 2,110,640 | 2,126,477 | 15,837 | 0.8 | Fort Worth |
| 16 | Bexar | 3,211.12 | 1,239.82 | 2,009,324 | 2,028,236 | 18,912 | 0.9 | San Antonio | |
| 17 | Broward | Florida | 3,133.33 | 1,209.79 | 1,944,375 | 1,930,983 | -13,392 | -0.7 | Fort Lauderdale |
| 18 | Santa Clara | California | 3,341.34 | 1,290.10 | 1,936,259 | 1,885,508 | -50,751 | -2.6 | San Jose |
| 19 | Wayne | Michigan | 1,585.28 | 612.08 | 1,793,561 | 1,774,816 | -18,745 | -1.0 | Detroit |
| 20 | Alameda | California | 1,914.05 | 739.02 | 1,682,353 | 1,648,556 | -33,797 | -2.0 | Oakland |
| 21 | Middlesex | Massachusetts | 2,118.14 | 817.82 | 1,632,002 | 1,614,742 | -17,260 | -1.1 | Lowell and Cambridge |
| 22 | Sacramento | California | 2,498.42 | 964.64 | 1,585,055 | 1,588,921 | 3,866 | 0.2 | Sacramento |
| 23 | Manhattan | New York | 59.13 | 22.83 | 1,694,251 | 1,576,876 | -117,375 | -6.9 | Manhattan, NYC |
| 24 | Philadelphia | Pennsylvania | 347.32 | 134.10 | 1,603,797 | 1,576,251 | -27,546 | -1.7 | Philadelphia |
| 25 | Suffolk | New York | 2,362.20 | 912.05 | 1,525,920 | 1,526,344 | 424 | 0.0 | Riverhead |
| 26 | Palm Beach | Florida | 5,100.00 | 1,970.00 | 1,492,191 | 1,497,987 | 5,796 | 0.4 | West Palm Beach |
| 27 | Hillsborough | 2,642.34 | 1,020.21 | 1,459,762 | 1,478,194 | 18,432 | 1.3 | Tampa | |
| 28 | Bronx | New York | 109.03 | 42.10 | 1,472,654 | 1,424,948 | -47,706 | -3.2 | Bronx, NYC |
| 29 | Orange | Florida | 2,339.87 | 903.43 | 1,429,908 | 1,422,746 | -7,162 | -0.5 | Orlando |
| 30 | Nassau | New York | 737.41 | 284.72 | 1,395,774 | 1,390,907 | -4,867 | -0.3 | Mineola |
| 31 | Franklin | Ohio | 1,378.36 | 532.19 | 1,323,807 | 1,321,414 | -2,393 | -0.2 | Columbus |
| 32 | Travis | Texas | 2,564.61 | 990.20 | 1,290,188 | 1,305,154 | 14,966 | 1.2 | Austin |
| 33 | Oakland | Michigan | 2,247.24 | 867.66 | 1,274,395 | 1,270,017 | -4,378 | -0.3 | Pontiac |
| 34 | Hennepin | Minnesota | 1,433.79 | 553.59 | 1,281,565 | 1,267,416 | -14,149 | -1.1 | Minneapolis |
| 35 | Cuyahoga | Ohio | 1,184.12 | 457.19 | 1,264,817 | 1,249,387 | -15,430 | -1.2 | Cleveland |
| 36 | Allegheny | Pennsylvania | 1,890.88 | 730.07 | 1,250,578 | 1,238,090 | -12,488 | -1.0 | Pittsburgh |
| 37 | Salt Lake | Utah | 1,922.50 | 742.28 | 1,185,238 | 1,186,421 | 1,183 | 0.1 | Salt Lake City |
| 38 | Contra Costa | California | 1,854.27 | 715.94 | 1,165,927 | 1,161,413 | -4,514 | -0.4 | Martinez |
| 39 | Wake | North Carolina | 2,163.21 | 835.22 | 1,129,410 | 1,150,204 | 20,794 | 1.8 | Raleigh |
| 40 | Fairfax | Virginia | 1,012.60 | 390.97 | 1,150,309 | 1,139,720 | -10,589 | -0.9 | Fairfax |
| 41 | Mecklenburg | North Carolina | 1,356.75 | 523.84 | 1,115,482 | 1,122,276 | 6,794 | 0.6 | Charlotte |
| 42 | Collin | Texas | 2,178.76 | 841.22 | 1,064,465 | 1,109,462 | 44,997 | 4.2 | McKinney |
| 43 | Fulton | Georgia | 1,363.98 | 526.63 | 1,066,710 | 1,065,334 | -1,376 | -0.1 | Atlanta |
| 44 | Montgomery | Maryland | 1,272.34 | 491.25 | 1,062,061 | 1,054,827 | -7,234 | -0.7 | Rockville |
| 45 | Pima | Arizona | 23,794.31 | 9,187.04 | 1,043,433 | 1,052,030 | 8,597 | 0.8 | Tucson |
| 46 | Fresno | California | 15,431.13 | 5,957.99 | 1,008,654 | 1,013,581 | 4,927 | 0.5 | Fresno |
| 47 | Honolulu | Hawaii | 1,555.92 | 600.74 | 1,016,508 | 1,000,890 | -15,618 | -1.5 | Honolulu |
| 48 | Duval | Florida | 1,974.07 | 762.19 | 995,567 | 999,935 | 4,368 | 0.4 | Jacksonville |
| 49 | Westchester | New York | 1,114.98 | 430.50 | 1,004,457 | 997,895 | -6,562 | -0.7 | White Plains |
| 50 | St. Louis | Missouri | 1,315.20 | 507.80 | 1,004,125 | 997,187 | -6,938 | -0.7 | Clayton |
| 51 | Marion | Indiana | 1,026.41 | 396.30 | 977,203 | 971,102 | -6,101 | -0.6 | Indianapolis |
| 52 | Gwinnett | Georgia | 1,114.69 | 430.38 | 957,062 | 964,546 | 7,484 | 0.8 | Lawrenceville |
| 53 | Fairfield | Connecticut | 1,618.46 | 624.89 | 957,419 | 959,768 | 2,349 | 0.2 | Bridgeport |
| 54 | Pinellas | Florida | 709.14 | 273.80 | 959,107 | 956,615 | -2,492 | -0.3 | Clearwater |
| 55 | Prince George's | Maryland | 1,250.16 | 482.69 | 967,201 | 955,306 | -11,895 | -1.2 | Upper Marlboro |
| 56 | Bergen | New Jersey | 603.49 | 233.01 | 955,732 | 953,819 | -1,913 | -0.2 | Hackensack |
| 57 | Erie | New York | 2,700.56 | 1,042.69 | 954,236 | 950,683 | -3,553 | -0.4 | Buffalo |
| 58 | Denton | Texas | 2,275.13 | 878.43 | 906,422 | 941,647 | 35,225 | 3.9 | Denton |
| 59 | Milwaukee | Wisconsin | 625.23 | 241.40 | 939,489 | 928,059 | -11,430 | -1.2 | Milwaukee |
| 60 | Pierce | Washington | 4,324.01 | 1,669.51 | 921,130 | 925,708 | 4,578 | 0.5 | Tacoma |
| 61 | DuPage | Illinois | 848.22 | 327.50 | 932,877 | 924,885 | -7,992 | -0.9 | Wheaton |
| 62 | Shelby | Tennessee | 1,976.61 | 763.17 | 929,744 | 924,454 | -5,290 | -0.6 | Memphis |
| 63 | Kern | California | 21,061.57 | 8,131.92 | 909,235 | 917,673 | 8,438 | 0.9 | Bakersfield |
| 64 | Hartford | Connecticut | 1,903.89 | 735.10 | 899,498 | 896,854 | -2,644 | -0.3 | Hartford |
| 65 | Hidalgo | Texas | 4,068.52 | 1,570.87 | 870,781 | 880,356 | 9,575 | 1.1 | Edinburg |
| 66 | Macomb | Michigan | 1,241.18 | 479.22 | 881,217 | 876,792 | -4,425 | -0.5 | Mount Clemens |
| 67 | El Paso | Texas | 2,622.86 | 1,012.69 | 865,657 | 867,947 | 2,290 | 0.3 | El Paso |
| 68 | New Haven | Connecticut | 1,565.66 | 604.51 | 864,835 | 863,700 | -1,135 | -0.1 | New Haven |
| 69 | Worcester | Massachusetts | 3,912.88 | 1,510.77 | 862,111 | 862,029 | -82 | 0.0 | Worcester |
| 70 | Middlesex | New Jersey | 800.08 | 308.91 | 863,162 | 860,807 | -2,355 | -0.3 | New Brunswick |
| 71 | Montgomery | Pennsylvania | 1,251.07 | 483.04 | 856,553 | 860,578 | 4,025 | 0.5 | Norristown |
| 72 | Fort Bend | Texas | 2,292 | 885 | 822,779 | 858,527 | 35,748 | 4.3 | Richmond |
| 73 | Essex | New Jersey | 326.89 | 126.21 | 863,728 | 854,917 | -8,811 | -1.0 | Newark |
| 74 | Baltimore | Maryland | 1,549.59 | 598.30 | 854,535 | 849,316 | -5,219 | -0.6 | Towson |
| 75 | Ventura | California | 4,773.69 | 1,843.13 | 843,843 | 839,784 | -4,059 | -0.5 | Ventura |
| 76 | Snohomish | Washington | 5,406.01 | 2,087.27 | 827,957 | 833,540 | 5,583 | 0.7 | Everett |
| 77 | Hamilton | Ohio | 1,051.30 | 405.91 | 830,639 | 826,139 | -4,500 | -0.5 | Cincinnati |
| 78 | San Francisco | California | 121.40 | 46.87 | 873,965 | 815,201 | -58,764 | -6.7 | San Francisco |
| 79 | Essex | Massachusetts | 1,275.73 | 492.56 | 809,829 | 807,074 | -2,755 | -0.3 | Salem and Lawrence |
| 80 | Multnomah | Oregon | 1,117.05 | 431.30 | 815,428 | 803,377 | -12,051 | -1.5 | Portland |
| 81 | Oklahoma | Oklahoma | 1,835.83 | 708.82 | 796,292 | 798,575 | 2,283 | 0.3 | Oklahoma City |
| 82 | San Joaquin | California | 3,603.51 | 1,391.32 | 779,233 | 789,410 | 10,177 | 1.3 | Stockton |
| 83 | Lee | Florida | 2,031.88 | 784.51 | 760,822 | 787,976 | 27,154 | 3.6 | Fort Myers |
| 84 | Jefferson | Kentucky | 985.27 | 380.42 | 782,969 | 777,874 | -5,095 | -0.7 | Louisville |
| 85 | Suffolk | Massachusetts | 150.62 | 58.15 | 797,936 | 771,245 | -26,691 | -3.3 | Boston |
| 86 | Cobb | Georgia | 879.43 | 339.55 | 766,149 | 766,802 | 653 | 0.1 | Marietta |
| 87 | DeKalb | 693.03 | 267.58 | 764,382 | 757,718 | -6,664 | -0.9 | Decatur | |
| 88 | Monroe | New York | 1,702.15 | 657.21 | 759,443 | 755,160 | -4,283 | -0.6 | Rochester |
| 89 | Polk | Florida | 4,660 | 1,798 | 725,046 | 753,520 | 28,474 | 3.9 | Bartow |
| 90 | San Mateo | California | 1,161.37 | 448.41 | 764,442 | 737,888 | -26,554 | -3.5 | Redwood City |
| 91 | El Paso | Colorado | 5,508.39 | 2,126.80 | 730,395 | 737,867 | 7,472 | 1.0 | Colorado Springs |
| 92 | Norfolk | Massachusetts | 1,025.91 | 396.11 | 725,981 | 724,505 | -1,476 | -0.2 | Dedham |
| 93 | Jackson | Missouri | 1,565.55 | 604.46 | 717,204 | 716,862 | -342 | 0.0 | Independence and Kansas City |
| 94 | Denver | Colorado | 401.36 | 154.97 | 715,522 | 711,463 | -4,059 | -0.6 | Denver |
| 95 | Lake | Illinois | 1,149.10 | 443.67 | 714,342 | 711,239 | -3,103 | -0.4 | Waukegan |
| 96 | Davidson | Tennessee | 1,305.44 | 504.03 | 715,884 | 703,953 | -11,931 | -1.7 | Nashville |
| 97 | Hudson | New Jersey | 119.63 | 46.19 | 724,854 | 702,463 | -22,391 | -3.1 | Jersey City |
| 98 | Will | Illinois | 2,167.58 | 836.91 | 696,355 | 697,252 | 897 | 0.1 | Joliet |
| 99 | Utah | Utah | 5,188.91 | 2,003.45 | 659,399 | 684,986 | 25,587 | 3.9 | Provo |
| 100 | Bernalillo | New Mexico | 3,006.53 | 1,160.83 | 676,444 | 674,393 | -2,051 | -0.3 | Albuquerque |
Gallery
-
 Downtown Los Angeles, county seat of Los Angeles County, California, the most populous county in the United States. County buildings and the civic center, pictured at the bottom right.
 -
 Downtown Chicago, in Cook County, Illinois, the second-most populous county in the United States.
 -
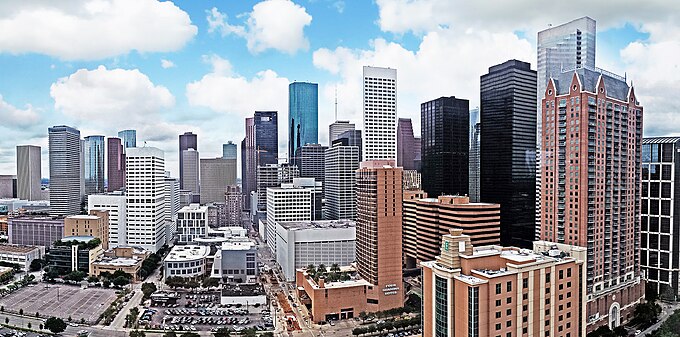 Downtown Houston, located in Harris County, Texas, the third-most populous county in the United States.
 -
 Downtown Phoenix, Arizona, county seat of the fourth-most populous county in the United States, Maricopa.
 -
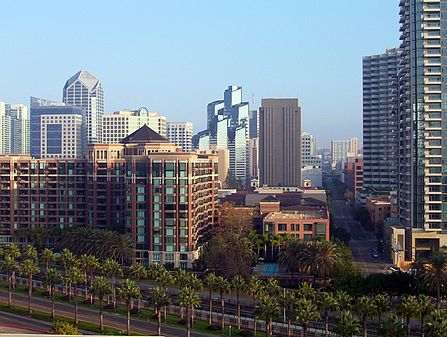 Downtown San Diego, California. San Diego County is the fifth-most populous county in the United States.
 -
 Aerial view of Orange County, California, the sixth-most populous county in the United States.
 -
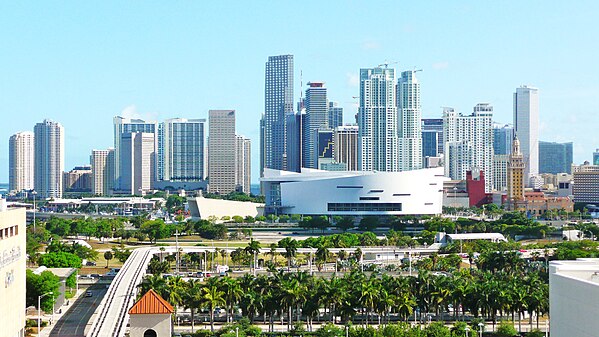 Downtown Miami in Miami-Dade County, the largest county in Florida, and the county seat of the seventh-most populous county in the United States.
 -


References
- ^ "Over Two-Thirds of the Nation's Counties Had Natural Decrease in 2021". United States Census Bureau. Retrieved March 27, 2022.
- ^ "This Is Your City and County of Honolulu Government". City and County of Honolulu. Archived from the original on January 20, 2008. Retrieved January 23, 2008.
- ^ "City and County Organizational Chart". City and County of San Francisco. Archived from the original on February 3, 2008. Retrieved January 23, 2008.
- ^ "Active Colorado Municipalities as of January 26, 2010". Colorado Department of Local Affairs. Archived from the original on December 12, 2009. Retrieved January 26, 2010.
- ^ GeoHive - the United States of America - US States and Counties Archived April 30, 2012, at the Wayback Machine (attached Excel spreadsheet)
- ^ The area in square kilometers of the column to the left divided by 2.589988110336 (1.6093442).
| General | ||
|---|---|---|
| Demographics | ||
| Economy | ||
| Geography | ||
| Name origins | ||
| See also | ||