
Statewide opinion polling for the 2020 United States presidential election
This article may be too long to read and navigate comfortably. (July 2020) |
2020 U.S. presidential election | |
|---|---|
| Attempts to overturn | |
| Democratic Party | |
| Republican Party | |
| Third parties | |
| Related races | |
| |
This is a list of statewide public opinion polls that have been conducted relating to the 2020 United States presidential election. The persons named in the polls are declared candidates or have received media speculation about their possible candidacy.
If multiple versions of polls are provided, the version among likely voters is prioritized, then registered voters, then adults.
Alabama
- Graphical summary
Graphs are unavailable due to technical issues. There is more info on Phabricator and on MediaWiki.org. |
Aggregate polls
| Source of poll aggregation |
Dates administered |
Dates updated |
Joe Biden Democratic |
Donald Trump Republican |
Other/ Undecided [a] |
Margin |
|---|---|---|---|---|---|---|
| 270 to Win | September 1 – October 13, 2020 | October 27, 2020 | 38.0% | 58.0% | 4.0% | Trump +20.0 |
| FiveThirtyEight | until November 2, 2020 | November 3, 2020 | 37.8% | 57.4% | 4.8% | Trump +19.5 |
| Average | 37.9% | 57.7% | 4.4% | Trump +19.8 | ||
- Polls
| Poll source | Date(s) administered |
Sample size[b] |
Margin of error |
Donald Trump Republican |
Joe Biden Democratic |
Jo Jorgensen Libertarian |
Other | Undecided |
|---|---|---|---|---|---|---|---|---|
| SurveyMonkey/Axios | Oct 20 – Nov 2, 2020 | 1,808 (LV) | ± 3.5% | 62%[c] | 36% | – | – | – |
| Swayable Archived November 13, 2020, at the Wayback Machine | Oct 27 – Nov 1, 2020 | 330 (LV) | ± 7.9% | 55% | 38% | 7% | – | – |
| Data for Progress | Oct 27 – Nov 1, 2020 | 1,045 (LV) | ± 3% | 58% | 38% | 3% | 1% | 0%[d] |
| Auburn University At Montgomery | Oct 23–28, 2020 | 853 (LV) | ± 4.4% | 58% | 39% | – | 3% | – |
| SurveyMonkey/Axios | Oct 1–28, 2020 | 3,363 (LV) | – | 61% | 37% | – | – | – |
| Swayable | Oct 23–26, 2020 | 266 (LV) | ± 7.8% | 56% | 37% | 7% | – | – |
| Moore Information (R)[A] | Oct 11–14, 2020 | 504 (LV) | ± 4.5% | 55% | 38% | – | – | – |
| Auburn University at Montgomery Archived November 9, 2020, at the Wayback Machine | Sep 30 – Oct 3, 2020 | 1,072 (RV) | ± 4.0% | 57% | 37% | – | 6% | – |
| SurveyMonkey/Axios | Sep 1–30, 2020 | 1,354 (LV) | – | 59% | 39% | – | – | 2% |
| SurveyMonkey/Axios | Aug 1–31, 2020 | 1,220 (LV) | – | 65% | 33% | – | – | 2% |
| Tyson Group/Consumer Energy Alliance[B] | Aug 17–19, 2020 | 600 (LV) | ± 4% | 48% | 44% | 0% | 0%[e] | 7% |
| Morning Consult | Jul 24 – Aug 2, 2020 | 609 (LV) | ± 4.0% | 58% | 36% | – | 2%[f] | 4% |
| SurveyMonkey/Axios | Jul 1–31, 2020 | 1,583 (LV) | – | 63% | 35% | – | – | 2% |
| Auburn University at Montgomery Archived July 13, 2020, at the Wayback Machine | Jul 2–9, 2020 | 567 (RV) | ± 5.1% | 55% | 41% | – | 4% | 1% |
| SurveyMonkey/Axios | Jun 8–30, 2020 | 649 (LV) | – | 63% | 35% | – | – | 2% |
| FM3 Research/Doug Jones[C] | May 14–18, 2020 | 601 (LV) | ± 4% | 53% | 39% | – | – | – |
| Mason-Dixon | Feb 4–6, 2020 | 625 (RV) | ± 4% | 58% | 38% | – | – | 4% |
| WPA Intelligence | Jan 7–9, 2020 | 500 (LV) | – | 59% | 38% | – | – | 3% |
Alaska
- Graphical summary
Graphs are unavailable due to technical issues. There is more info on Phabricator and on MediaWiki.org. |
Aggregate polls
| Source of poll aggregation |
Dates administered |
Dates updated |
Joe Biden Democratic |
Donald Trump Republican |
Other/ Undecided [g] |
Margin |
|---|---|---|---|---|---|---|
| 270 to Win | October 6 – November 2, 2020 | November 3, 2020 | 43.8% | 49.4% | 6.8% | Trump +5.6 |
| FiveThirtyEight | until November 2, 2020 | November 3, 2020 | 43.6% | 51.2% | 5.2% | Trump +7.7 |
| Average | 43.7% | 50.3% | 6.0% | Trump +6.7 | ||
- Polls
| Poll source | Date(s) administered |
Sample size[h] |
Margin of error |
Donald Trump Republican |
Joe Biden Democratic |
Jo Jorgensen Libertarian |
Other | Undecided |
|---|---|---|---|---|---|---|---|---|
| SurveyMonkey/Axios | Oct 20 – Nov 2, 2020 | 634 (LV) | ± 5% | 54%[i] | 45% | – | – | – |
| Gravis Marketing | Oct 26–28, 2020 | 770 (LV) | ± 3.5% | 52% | 43% | – | – | 5% |
| SurveyMonkey/Axios | Oct 1–28, 2020 | 1,147 (LV) | – | 54% | 44% | – | – | – |
| Public Policy Polling/Protect Our Care[D] | Oct 19–20, 2020 | 800 (V) | ± 3.5% | 50% | 45% | - | – | 5% |
| Siena College/NYT Upshot | Oct 9–14, 2020 | 423 (LV) | ± 5.7% | 45% | 39% | 8% | 2%[j] | 6%[k] |
| Patinkin Research Strategies | Sep 30 – Oct 4, 2020 | 600 (LV) | ± 4% | 49% | 46% | – | 3%[l] | 2% |
| Alaska Survey Research | Sep 26 – Oct 4, 2020 | 696 (LV) | – | 50% | 46% | - | - | 4% |
| SurveyMonkey/Axios | Sep 1–30, 2020 | 563 (LV) | – | 53% | 45% | - | - | 2% |
| Harstad Strategic Research/Independent Alaska[E] | Sep 20–23, 2020 | 602 (LV) | ± 4% | 47% | 46% | - | - | – |
| SurveyMonkey/Axios | Aug 1–31, 2020 | 472 (LV) | – | 57% | 42% | - | - | 1% |
| SurveyMonkey/Axios | Jul 1–31, 2020 | 412 (LV) | – | 55% | 43% | - | - | 2% |
| Public Policy Polling (D)[F] | Jul 23–24, 2020 | 885 (V) | – | 50% | 44% | - | - | 6% |
| Public Policy Polling[m] | Jul 7–8, 2020 | 1,081 (RV) | ± 3.0% | 48% | 45% | - | - | 6% |
| Alaska Survey Research | Jun 23 – Jul 7, 2020 | 663 (LV) | ± 3.9% | 49% | 48% | - | - | 4% |
| SurveyMonkey/Axios | Jun 8–30, 2020 | 161 (LV) | – | 52% | 46% | - | - | 2% |
| Zogby Interactive/JZ Analytics | Jul 22 – Aug 9, 2019 | 321 (LV) | ± 5.5% | 45% | 40% | - | - | 15% |
Arizona
- Graphical summary
Graphs are unavailable due to technical issues. There is more info on Phabricator and on MediaWiki.org. |
Aggregate polls
| Source of poll aggregation |
Dates administered |
Dates updated |
Joe Biden Democratic |
Donald Trump Republican |
Other/ Undecided [a] |
Margin |
|---|---|---|---|---|---|---|
| 270 to Win | October 22 – November 2, 2020 | November 3, 2020 | 48.0% | 45.8% | 6.2% | Biden +2.2 |
| Real Clear Politics | October 25 – November 1, 2020 | November 3, 2020 | 47.9% | 47.0% | 5.1% | Biden +0.9 |
| FiveThirtyEight | until November 2, 2020 | November 3, 2020 | 48.7% | 46.1% | 5.2% | Biden +2.6 |
| Average | 48.2% | 46.3% | 5.5% | Biden +1.9 | ||
2020 polls
| Poll source | Date(s) administered |
Sample size[n] |
Margin of error |
Donald Trump Republican |
Joe Biden Democratic |
Jo Jorgensen Libertarian |
Howie Hawkins Green |
Other | Undecided |
|---|---|---|---|---|---|---|---|---|---|
| Ipsos/Reuters | Oct 27 – Nov 2 | 610 (LV) | ± 4.5% | 47%[o] | 50% | 1% | 0% | 2%[p] | – |
| 47%[q] | 49% | - | - | 2%[r] | 1% | ||||
| 48%[s] | 50% | - | - | 2%[t] | – | ||||
| SurveyMonkey/Axios | Oct 20 – Nov 2 | 4,278 (LV) | ± 2.5% | 46%[u] | 52% | - | - | – | – |
| Change Research/CNBC | Oct 29 – Nov 1 | 409 (LV) | ± 4.9% | 47% | 50% | 2% | - | – | 1% |
| Marist College/NBC | Oct 29 – Nov 1 | 717 (LV) | ± 4.5% | 48% | 48% | - | - | 3% | 1% |
| Swayable Archived November 13, 2020, at the Wayback Machine | Oct 27 – Nov 1 | 360 (LV) | ± 7.1% | 46% | 51% | 4% | - | – | – |
| Data for Progress | Oct 27 – Nov 1 | 1,195 (LV) | ± 2.8% | 47% | 50% | 2% | 1% | 0%[v] | – |
| AtlasIntel | Oct 30–31 | 641 (LV) | ± 4% | 50.4% | 48.1% | - | - | 1.5%[w] | – |
| Emerson College | Oct 29–31 | 732 (LV) | ± 3.6% | 46% | 48% | - | - | 6%[x] | – |
| Morning Consult | Oct 22–31 | 1,059 (LV) | ± 3% | 46% | 48% | - | - | – | – |
| Data Orbital Archived November 21, 2020, at the Wayback Machine | Oct 28–30 | 550 (LV) | ± 4.2% | 45.3% | 45.9% | 3% | - | 6%[y] | 5% |
| Siena College/NYT Upshot | Oct 26–30 | 1,253 (LV) | ± 3% | 43% | 49% | 3% | - | 1%[z] | 5%[aa] |
| Grand Canyon Battleground Poll | Oct 25–30 | 910 (LV) | ± 3.1% | 48% | 45% | 3% | - | 4% | |
| CNN/SSRS Archived November 22, 2020, at the Wayback Machine | Oct 23–30 | 892 (LV) | ± 4.0% | 46% | 50% | 3% | - | 1%[ab] | 1% |
| Pulse Opinion Research/Rasmussen Reports | Oct 27–29 | 800 (LV) | ± 3.5% | 49% | 45% | - | - | 3%[ac] | – |
| Redfield & Wilton Strategies | Oct 26–29 | 889 (LV) | – | 46% | 50% | 2% | 0% | 1% | 2% |
| Gravis Marketing | Oct 26–28 | 704 (LV) | ± 3.7% | 44% | 48% | - | - | – | 8% |
| Trafalgar Group | Oct 25–28 | 1,002 (LV) | ± 3% | 49% | 46.5% | 2.1% | - | 1.7%[ad] | 0.7% |
| SurveyMonkey/Axios | Oct 1–28 | 5,687 (LV) | – | 46% | 52% | - | - | – | – |
| Ipsos/Reuters | Oct 21–27 | 714 (LV) | ± 4.2% | 47%[o] | 47% | 2% | 0% | 3%[ae] | – |
| 46%[q] | 48% | - | - | 3%[af] | 2% | ||||
| Swayable | Oct 23–26 | 304 (LV) | ± 7.2% | 44% | 52% | 3% | - | – | – |
| Justice Collaborative Project Archived November 30, 2020, at the Wayback Machine[G] | Oct 22–25 | 874 (LV) | ± 3.1% | 43% | 49% | - | - | – | 5% |
| OH Predictive Insights | Oct 22–25 | 716 (LV) | ± 3.7% | 46% | 49% | 3% | - | 1%[ag] | 1% |
| Univision/University of Houston/Latino Decisions/North Star Opinion Research |
Oct 17–25 | 725 (RV) | ± 3.6% | 45% | 50% | - | - | 2%[ah] | 3% |
| Patinkin Research Strategies/Arizona Research Consortium (D) | Oct 21–24 | 729 (LV) | ± 3.6% | 45% | 52% | - | - | 2% | 1% |
| Y2 Analytics/Salt Lake Tribune | Oct 15–24 | 700 (LV) | ± 3.7% | 47% | 50% | - | - | – | – |
| Susquehanna Polling & Research Inc./Center for American Greatness[H] | Oct 19–22 | 504 (LV) | ± 4.4% | 46%[ai] | 46% | 4% | - | 2%[aj] | 1% |
| Ipsos/Reuters | Oct 14–21 | 658 (LV) | ± 4.4% | 46%[o] | 50% | 1% | - | 2%[ak] | – |
| 46%[q] | 49% | - | - | 3%[af] | 2% | ||||
| Morning Consult | Oct 11–20 | 1,066 (LV) | ± 3% | 48% | 47% | - | - | – | – |
| Pulse Opinion Research/Rasmussen Reports | Oct 18–19 | 800 (LV) | ± 3.5% | 46% | 48% | - | - | 3%[ac] | 3% |
| Change Research/CNBC | Oct 16–19 | 232 (LV)[al] | – | 45% | 51% | - | - | – | – |
| RMG Research/PoliticalIQ Archived November 25, 2020, at the Wayback Machine | Oct 14–19 | 800 (LV) | ± 3.5% | 46%[o] | 47% | - | - | 3%[ac] | 5% |
| 44%[am] | 49% | - | - | 3%[ac] | 5% | ||||
| 47%[an] | 45% | - | - | 3%[ac] | 5% | ||||
| Data Orbital Archived October 31, 2020, at the Wayback Machine | Oct 16–18 | 550 (LV) | ± 4.2% | 42% | 47% | 3% | - | 5%[ao] | 2% |
| YouGov/CBS | Oct 13–16 | 1,074 (LV) | ± 4.1% | 45% | 49% | - | - | 3%[ap] | 3% |
| Ipsos/Reuters | Oct 7–14 | 667 (LV) | ± 4.3% | 47%[o] | 49% | 1% | 0% | 2%[aq] | – |
| 46%[q] | 50% | - | - | 2%[r] | 3% | ||||
| Monmouth University | Oct 11–13 | 502 (RV) | ± 4.4% | 44% | 50% | 2% | - | 1%[ar] | 4% |
| 502 (LV) | 44%[as] | 51% | - | - | 2% | – | |||
| 47%[at] | 49% | - | - | 1% | – | ||||
| Redfield & Wilton Strategies | Oct 10–13 | 750 (LV) | – | 45%[al] | 48% | 1% | 0% | – | – |
| Morning Consult | Oct 2–11 | 1,144 (LV) | ± 2.9% | 46% | 49% | - | - | – | – |
| Redfield & Wilton Strategies | Oct 9–10 | 720 (LV) | – | 46%[al] | 48% | 1% | 0% | – | – |
| Trafalgar Group | Oct 6–8 | 1,087 (LV) | ± 2.9% | 48% | 44% | 2% | - | 2%[ah] | 5% |
| OH Predictive Insights | Oct 4–8 | 608 (LV) | ± 4.0% | 45%[o] | 49% | 4% | - | 0%[au] | 3% |
| 47%[av] | 50% | - | - | 0%[au] | 3% | ||||
| Redfield and Wilton Strategies | Oct 4–7 | 727 (LV) | ± 3.6% | 43% | 49% | 1% | 1% | 1%[aw] | 6% |
| Ipsos/Reuters | Sep 29 – Oct 7 | 633 (LV) | ± 4.3% | 46% | 48% | - | - | 2%[r] | 4% |
| Latino Decisions/Democrats for Education Reform[I] | Sep 28 – Oct 6 | 600 (LV) | ± 4% | 45% | 48% | - | - | – | 5% |
| Basswood Research/American Action Forum[J] | Oct 3–5 | 800 (LV) | ± 3.5% | 48% | 48% | 2% | - | – | 3% |
| Data Orbital Archived October 21, 2020, at the Wayback Machine | Oct 3–5 | 550 (LV) | ± 4.2% | 43% | 48% | 3% | - | 3%[ax] | 4% |
| HighGround Inc. [1] | Sep 28 – Oct 5 | 400 (LV) | ± 4.9% | 45% | 46% | - | - | 4%[ay] | 5% |
| Change Research/CNBC | Oct 2–4 | 296 (LV) | – | 45% | 51% | - | - | – | – |
| Siena College/NYT Upshot | Oct 1–3 | 655 (LV) | ± 4.2% | 41% | 49% | 3% | – | 1%[z] | 6%[aa] |
| Patinkin Research Strategies/Arizona Research Consortium (D) | Oct 1–3 | 604 (LV) | ± 3.8% | 46% | 50% | - | - | 3% | 1% |
| Targoz Market Research/PollSmart | Sep 23 – Oct 2 | 1,045 (LV) | ± 3.0% | 46% | 45% | - | - | 10% | – |
| Suffolk University | Sep 26–30 | 500 (LV) | ± 4.4% | 46% | 50% | 1% | - | 1%[ag] | 2% |
| SurveyMonkey/Axios | Sep 1–30 | 7,100 (LV) | – | 47% | 51% | - | - | – | 2% |
| Strategies 360/Smart and Safe Arizona[K] | Sep 24–29 | 800 (LV) | ± 3.5% | 45% | 49% | - | - | 2%[az] | 4% |
| Susquehanna Polling & Research Inc/Center for American Greatness[H] | Sep 25–28 | 500 (LV) | ± 4.3% | 47% | 47% | - | - | – | – |
| Data for Progress (D) | Sep 23–28 | 808 (LV) | ± 3.4% | 45%[o] | 49% | 1% | 0% | – | 4% |
| 46%[av] | 50% | - | - | – | 4% | ||||
| Redfield & Wilton Strategies | Sep 23–26 | 871 (LV) | ± 3.3% | 44% | 47% | 1% | 1% | 1%[aw] | 6% |
| Data For Progress[L] | Sep 15–22 | 481 (LV) | ± 4.4% | 46% | 45% | - | - | – | 10% |
| Change Research/CNBC | Sep 18–20 | 262 (LV) | – | 43% | 49% | - | - | – | – |
| ABC/Washington Post | Sep 15–20 | 579 (LV) | ± 4.5% | 49% | 48% | - | - | 2%[ba] | 1% |
| Hart Research Associates/Human Rights Campaign[permanent dead link][M] | Sep 17–19 | 400 (LV) | ± 4.9% | 42% | 53% | - | - | – | – |
| Data Orbital | Sep 14–17 | 550 (LV) | – | 47% | 49% | - | - | – | – |
| Ipsos/Reuters | Sep 11–17 | 565 (LV) | ± 4.7% | 46% | 47% | - | - | 2%[r] | 5% |
| Redfield & Wilton Strategies | Sep 12–16 | 855 (LV) | ± 3.4% | 42% | 47% | 1% | 0% | 1%[aw] | 8% |
| Monmouth University | Sep 11–15 | 420 (RV) | ± 4.8% | 44% | 48% | 4% | - | 1%[bb] | 3% |
| 420 (LV) | 46%[bc] | 48% | - | - | 3% | 3% | |||
| 47%[bd] | 47% | - | - | 3% | 3% | ||||
| Siena College/NYT Upshot | Sep 10–15 | 653 (LV) | ± 4.1% | 40% | 49% | 4% | - | 1%[z] | 6%[aa] |
| Patinkin Research Strategies/Arizona Research Consortium (D) | Sep 10–13 | 679 (LV) | ± 3.8% | 46% | 49% | - | - | 4% | 2% |
| Kaiser Family Foundation/Cook Political Report | Aug 29 – Sep 13 | 1,298 (RV) | ± 3% | 40% | 45% | - | - | 4%[be] | 11% |
| Gravis Marketing | Sep 10–11 | 684 (LV) | ± 3.8% | 48% | 50% | - | - | – | 2% |
| YouGov/CBS | Sep 9–11 | 1,106 (LV) | ± 3.9% | 44% | 47% | - | - | 3%[ap] | 6% |
| OH Predictive Insights | Sep 8–10 | 600 (LV) | ± 4% | 42% | 52% | - | - | – | 5% |
| Benenson Strategy Group/GS Strategy Group/AARP | Aug 28 – Sep 8 | 1,600 (LV) | ± 2.5% | 47% | 48% | - | - | 1%[bf] | 4% |
| Morning Consult | Aug 29 – Sep 7 | 901 (LV) | ± (2–4%) | 46%[bg] | 49% | - | - | – | – |
| Change Research/CNBC | Sep 4–6 | 470 (LV) | – | 45% | 49% | - | - | 6%[bh] | – |
| Redfield & Wilton Strategies | Aug 30 – Sep 4 | 830 (LV) | ± 3.4% | 43% | 48% | 0% | 1% | 0%[bi] | 6% |
| FOX News | Aug 29 – Sep 1 | 772 (LV) | ± 3.5% | 40% | 49% | 3% | - | 1%[bj] | 6% |
| 858 (RV) | ± 3.0% | 39% | 49% | 3% | - | 3%[bk] | 6% | ||
| Basswood Research/American Action Forum[J] | Aug 29–31, 2020 | 800 (LV) | ± 3.5% | 48%[o] | 47% | 1%[bl] | 2% | – | 2% |
| 49%[av] | 48% | - | - | – | 3% | ||||
| SurveyMonkey/Axios | Aug 1–31 | 6,456 (LV) | – | 52% | 47% | - | - | – | 2% |
| Morning Consult | Aug 21–30 | 943 (LV) | ± 3.0% | 42% | 52% | - | - | – | – |
| Change Research/CNBC | Aug 21–23 | 344 (LV) | – | 47% | 49% | - | - | – | – |
| Redfield and Wilton Strategies | Aug 16–18 | 856 (LV) | ± 3.4% | 38% | 47% | 1% | 1% | 3%[bm] | 10% |
| Morning Consult | Aug 7–16 | 947 (LV) | ± (2–4%) | 47% | 45% | - | - | – | – |
| Emerson College | Aug 8–10 | 661 (LV) | ± 3.8% | 47%[ai] | 53% | - | - | – | – |
| Change Research/CNBC | Aug 7–9 | 428 (LV) | – | 44% | 45% | - | - | – | – |
| Trafalgar Group | Aug 5–8 | 1,013 (LV) | ± 2.9% | 46% | 45% | 3% | - | 1%[bn] | 4% |
| OH Predictive Insights | Aug 3–4 | 603 (LV) | ± 4.0% | 45% | 49% | - | - | – | – |
| OnMessage Inc./Heritage Action[N] | Aug 2–4 | 400 (LV) | ± 4.9% | 51% | 48% | - | - | – | 2% |
| Data for Progress | Jul 24 – Aug 2 | 1,215 (LV) | – | 43%[o] | 45% | 2% | 1% | – | 10% |
| 44%[av] | 47% | - | - | – | 8% | ||||
| SurveyMonkey/Axios | Jul 1–31 | 4,995 (LV) | – | 51% | 47% | - | - | – | 2% |
| Change Research/CNBC [2] | Jul 24–26 | 365 (LV) | – | 45% | 47% | - | - | – | – |
| Morning Consult | Jul 17–26 | 908 (LV) | ± 3.3% | 42%[bg] | 49% | - | - | – | – |
| Morning Consult | Jul 16–25 | – (LV)[bo] | – | 43% | 49% | - | - | – | – |
| CNN/SSRS | Jul 18–24 | 873 (RV) | ± 3.8% | 45% | 49% | - | - | 4%[bp] | 2% |
| Redfield & Wilton Strategies | Jul 19–23 | 858 (LV) | – | 38% | 46% | 2% | 1% | 3%[bm] | 11% |
| NBC News/Marist College | Jul 14–22 | 826 (RV) | ± 4.1% | 45% | 50% | - | - | 1% | 3% |
| Public Policy Polling/AFSCME[F] | Jul 17–18 | 960 (RV) | – | 45% | 49% | - | - | – | 6% |
| Spry Strategies/American Principles Project[O] | Jul 11–16 | 700 (LV) | ± 3.7% | 45% | 49% | - | - | – | 6% |
| Morning Consult | Jul 6–15 | – (LV)[bo] | – | 45% | 47% | - | - | – | – |
| Change Research/CNBC | Jul 10–12 | 345 (LV) | – | 45% | 51% | - | - | – | – |
| YouGov/CBS | Jul 7–10 | 1,087 (LV) | ± 3.8% | 46% | 46% | - | - | 4%[bq] | 4% |
| OH Predictive Insights | Jul 6–7 | 600 (LV) | ± 4.0% | 44% | 49% | - | - | 0%[au] | 7% |
| Morning Consult | Jun 26 – Jul 5 | – (LV)[bo] | – | 42% | 48% | - | - | – | – |
| SurveyMonkey/Axios | Jun 8–30 | 2,365 (LV) | – | 52% | 46% | - | - | – | 2% |
| Data Orbital | Jun 27–29 | 600 (LV) | ± 4.0% | 45% | 47% | - | - | 3.3%[br] | 4.2% |
| Morning Consult | Jun 16–25 | – (LV)[bo] | – | 43% | 47% | - | - | – | – |
| Change Research/CNBC | Jun 26–28 | 311 (LV)[al] | – | 44% | 51% | - | - | – | – |
| Gravis Marketing/OANN | Jun 27 | 527 (LV) | ± 4.3% | 49% | 45% | - | - | – | 7% |
| Redfield & Wilton Strategies | Jun 14–17 | 865 (LV) | ± 3.3% | 39% | 43% | 2% | 1% | 2%[bs] | 13% |
| Siena College/NYT Upshot | Jun 8–16 | 650 (RV) | ± 4.3% | 41% | 48% | - | - | 4%[bt] | 8% |
| Civiqs/Daily Kos | Jun 13–15 | 1,368 (RV) | ± 2.9% | 45% | 49% | - | - | 5%[bu] | 1% |
| Morning Consult | Jun 6–15 | – (LV)[bo] | – | 44% | 47% | - | - | – | – |
| Change Research/CNBC | Jun 12–14 | 201 (LV)[al] | – | 44% | 45% | - | - | 5%[bv] | – |
| Morning Consult | May 27 – Jun 5 | – (LV)[bo] | – | 47% | 45% | - | - | – | – |
| FOX News | May 30 – Jun 2 | 1,002 (RV) | ± 3% | 42% | 46% | - | - | 6%[bw] | 5% |
| Change Research/CNBC | May 29–31 | 329 (LV)[al] | – | 45% | 44% | - | - | 9% | 2% |
| Morning Consult | May 17–26 | 784 (LV) | – | 47%[bg] | 45% | - | - | – | – |
| Morning Consult | May 16–25 | – (LV)[bo] | – | 46% | 46% | - | - | – | – |
| HighGround Inc. | May 18–22 | 400 (LV) | ± 4.9% | 45% | 47% | - | - | 4%[bx] | 4%[aa] |
| Redfield & Wilton Strategies | May 10–14 | 946 (LV) | ± 3.2% | 41% | 45% | - | - | 3%[by] | 10% |
| OH Predictive Insights | May 9–11 | 600 (LV) | ± 4% | 43% | 50% | - | - | 1%[ag] | 6% |
| Morning Consult | May 6–15 | – (LV)[bo] | – | 47% | 45% | - | - | – | – |
| GBAO Strategies/PLUS Paid Family Leave Archived May 16, 2020, at the Wayback Machine | Apr 13–16 | 500 (LV) | – | 46% | 47% | - | - | 2% | 5% |
| OH Predictive Insights | Apr 7–8 | 600 (LV) | ± 4.0% | 43% | 52% | - | - | – | – |
| NBC News/Wall Street Journal/Marist College | Mar 10–15 | 2,523 (RV) | ± 2.7% | 46% | 47% | - | - | 1% | 5% |
| Monmouth University | Mar 11–14 | 847 (RV) | ± 3.4% | 43% | 46% | - | - | 2% | 6% |
| Univision | Mar 6–11 | 1,036 (RV) | ± 3.0% | 42% | 50% | - | - | – | 8% |
| OH Predictive Insights | Mar 3–4 | 600 (LV) | ± 4.0% | 43% | 49% | - | - | – | 8% |
| Public Policy Polling | Mar 2–3 | 666 (V) | – | 46% | 47% | - | - | – | 6% |
| Climate Nexus | Feb 11–15 | 539 (RV) | ± 4.3% | 46% | 42% | - | - | – | 13% |
| Fabrizio, Lee & Associates/Team McSally/Politico[P] | Jan 22–24 | 1,000 (LV) | ± 3.1% | 50% | 45% | - | - | – | 6% |
| Public Policy Polling | Jan 2–4 | 760 (V) | – | 46% | 46% | - | - | – | 8% |
2019 polls
| Poll source | Date(s) administered |
Sample size[n] |
Margin of error |
Donald Trump Republican |
Joe Biden Democratic |
Other | Undecided |
|---|---|---|---|---|---|---|---|
| OH Predictive Insights | Dec 3–4 | 628 (LV) | ± 3.9% | 46% | 44% | 0%[au] | 10% |
| Emerson College | Oct 25–28 | 901 (RV) | ± 3.2% | 50% | 50% | – | – |
| Siena College/NYT Upshot | Oct 13–23 | 652 (LV) | ± 4.4% | 46% | 49% | – | – |
| Bendixen & Amandi International | Sep 9–12 | 520 (RV) | ± 4.3% | 43% | 42% | 12% | 3% |
| OH Predictive Insights | Aug 13–14 | 600 (LV) | ± 4.0% | 43% | 45% | – | 12% |
| Fabrizio Ward LLC | Jul 29–31 | 600 (LV) | ± 4.0% | 50% | 45% | – | 4% |
| OH Predictive Insights Archived May 7, 2019, at the Wayback Machine | May 1–2 | 600 (LV) | ± 4.0% | 44% | 49% | – | 7% |
| OH Predictive Insights Archived May 29, 2019, at the Wayback Machine | Feb 12–13 | 600 (LV) | ± 4.0% | 46% | 46% | – | 7% |
Arkansas
Graphical summary
Graphs are unavailable due to technical issues. There is more info on Phabricator and on MediaWiki.org. |
Aggregate polls
| Source of poll aggregation |
Dates administered |
Dates updated |
Joe Biden Democratic |
Donald Trump Republican |
Other/ Undecided [a] |
Margin |
|---|---|---|---|---|---|---|
| 270 to Win | October 17–28, 2020 | November 3, 2020 | 35.0% | 60.3% | 4.7% | Trump +25.3 |
| FiveThirtyEight | until November 2, 2020 | November 3, 2020 | 36.2% | 58.9% | 4.9% | Trump +22.8 |
| Average | 35.6% | 59.6% | 4.8% | Trump +24.0 | ||
Polls
| Poll source | Date(s) administered |
Sample size[bz] |
Margin of error |
Donald Trump Republican |
Joe Biden Democratic |
Jo Jorgensen Libertarian |
Howie Hawkins Green |
Other | Undecided |
|---|---|---|---|---|---|---|---|---|---|
| SurveyMonkey/Axios | Oct 20 – Nov 2, 2020 | 1,309 (LV) | ± 4% | 61%[ca] | 38% | - | - | – | – |
| SurveyMonkey/Axios | Oct 1–28, 2020 | 2,239 (LV) | – | 60% | 38% | - | - | – | – |
| University of Arkansas | Oct 9–21, 2020 | 591 (LV) | ± 3.9% | 65% | 32% | - | - | 3% | – |
| Hendrix College/Talk Business & Politics | Oct 11–13, 2020 | 647 (LV) | ± 4.9% | 58% | 34% | 2% | 1% | 2%[cb] | 4% |
| SurveyMonkey/Axios | Sep 1–30, 2020 | 771 (LV) | – | 62% | 38% | - | - | – | 1% |
| SurveyMonkey/Axios | Aug 1–31, 2020 | 689 (LV) | – | 67% | 32% | - | - | – | 1% |
| SurveyMonkey/Axios | Jul 1–31, 2020 | 747 (LV) | – | 66% | 32% | - | - | – | 2% |
| SurveyMonkey/Axios | Jun 8–30, 2020 | 354 (LV) | – | 59% | 38% | - | - | – | 2% |
| Hendrix College/Talk Business & Politics | Jun 9–10, 2020 | 869 (LV) | ± 3.3% | 47% | 45% | - | - | 5%[cc] | 3% |
California
- Graphical summary
Graphs are unavailable due to technical issues. There is more info on Phabricator and on MediaWiki.org. |
Aggregate polls
| Source of poll aggregation |
Dates administered |
Dates updated |
Joe Biden Democratic |
Donald Trump Republican |
Other/ Undecided [a] |
Margin |
|---|---|---|---|---|---|---|
| 270 to Win | October 17–27, 2020 | November 3, 2020 | 61.7% | 32.3% | 6.0% | Biden +29.4 |
| Real Clear Politics | September 26 – October 21, 2020 | October 27, 2020 | 60.7% | 31.0% | 8.3% | Biden +29.7 |
| FiveThirtyEight | until November 2, 2020 | November 3, 2020 | 61.6% | 32.4% | 6.0% | Biden +29.2 |
| Average | 61.3% | 31.9% | 6.8% | Biden +29.4 | ||
Polls
| Poll source | Date(s) administered |
Sample size[cd] |
Margin of error |
Donald Trump Republican |
Joe Biden Democratic |
Jo Jorgensen Libertarian |
Howie Hawkins Green |
Other | Undecided |
|---|---|---|---|---|---|---|---|---|---|
| SurveyMonkey/Axios | Oct 20 – Nov 2, 2020 | 12,370 (LV) | ± 1.5% | 36%[ce] | 62% | – | – | – | – |
| David Binder Research | Oct 28 – Nov 1, 2020 | 800 (LV) | – | 31% | 62% | – | – | 3% | 4% |
| USC Schwarzenegger Institute | Oct 27–31, 2020 | 1,155 (RV) | ± 3% | 28% | 65% | – | – | 4%[cf] | 2% |
| SurveyMonkey/Tableau | Sep 30 – Oct 28, 2020 | 22,450 (LV) | – | 37%[ce] | 61% | – | – | – | – |
| Swayable | Oct 23–26, 2020 | 635 (LV) | ± 5.2% | 35% | 62% | 2% | 1% | – | – |
| UC Berkeley/LA Times [3] | Oct 16–21, 2020 | 5,352 (LV) | ± 2% | 29% | 65% | 1% | 0% | 0%[cg][ch] | 3% |
| Public Policy Institute of California | Oct 9–18, 2020 | 1,185 (LV) | ± 4.3% | 32% | 58% | 3% | 2% | 1%[ci] | 4% |
| SurveyMonkey/Tableau | Sep 1–30, 2020 | 20,346 (LV) | – | 35% | 63% | – | – | – | 2% |
| SurveyUSA | Sep 26–28, 2020 | 588 (LV) | ± 5.4% | 34% | 59% | – | – | 3%[cj] | 6% |
| Redfield & Wilton Strategies | Sep 19–21, 2020 | 1,775 (LV) | – | 28% | 62% | 1% | 1% | 1%[ck] | 8% |
| UC Berkeley/LA Times [4] | Sep 9–15, 2020 | 5,942 (LV) | ± 2% | 28% | 67% | 1% | 0% | 0%[cg][ch] | 3% |
| Public Policy Institute of California | Sep 4–13, 2020 | 1,168 (LV) | ± 4.3% | 31% | 60% | 3% | 2% | 1%[ci] | 2% |
| Spry Strategies/Women's Liberation Front Archived September 27, 2020, at the Wayback Machine [cl] | Aug 29 – Sep 1, 2020 | 600 (LV) | ± 4% | 39% | 56% | – | – | – | 5% |
| SurveyMonkey/Tableau | Aug 1–31, 2020 | 17,537 (LV) | – | 35% | 63% | – | – | – | 2% |
| David Binder Research | Aug 22–24, 2020 | 800 (LV) | – | 31% | 61% | – | – | 3%[cm] | 5% |
| Redfield and Wilton Strategies | Aug 9, 2020 | 1,904 (LV) | ± 2.3% | 25% | 61% | 1% | 1% | 2%[cn] | 9% |
| SurveyMonkey/Tableau | Jul 1–31, 2020 | 19,027 (LV) | – | 35% | 63% | – | – | – | 2% |
| University of California Berkeley [5] | Jul 21–27, 2020 | 6,756 (LV) | ± 2.0% | 28% | 67% | – | – | – | 5% |
| SurveyMonkey/Tableau | Jun 8–30, 2020 | 8,412 (LV) | – | 36% | 62% | – | – | – | 2% |
| Public Policy Institute of California | May 19–26, 2020 | 1,048 (LV) | ± 4.6% | 33% | 57% | – | – | 6%[co] | 3% |
| SurveyUSA | May 18–19, 2020 | 537 (LV) | ± 5.4% | 30% | 58% | – | – | 5% | 7% |
| Emerson College | May 8–10, 2020 | 800 (RV) | ± 3.4% | 35%[cp] | 65% | – | – | – | – |
| Public Policy Polling | Mar 28–29, 2020 | 962 (RV) | – | 29% | 67% | – | – | – | 3% |
| AtlasIntel | Feb 24 – Mar 2, 2020 | 1,100 (RV) | ± 3.0% | 26% | 62% | – | – | 12% | – |
| YouGov | Feb 26–28, 2020 | 1,507 (RV) | – | 31% | 59% | – | – | 4% | 4% |
| CNN/SSRS | Feb 22–26, 2020 | 951 (RV) | ± 3.3% | 35% | 60% | – | – | 3%[cq] | 3% |
| University of California Berkeley | Feb 20–25, 2020 | 5,526 (RV) | – | 31% | 58% | – | – | – | 11% |
| SurveyUSA | Feb 13–16, 2020 | 1,196 (RV) | ± 3.1% | 37% | 57% | – | – | – | 6% |
| YouGov/USC Price-Schwarzenegger Institute | Feb 1–15, 2020 | 1,200 (RV) | ± 3.1% | 30% | 60% | – | – | – | 4% |
| SurveyUSA | Jan 14–16, 2020 | 1,967 (RV) | ± 2.8% | 35% | 59% | – | – | – | 6% |
| CNN/SSRS | Dec 4–8, 2019 | 1,011 (RV) | ± 3.4% | 36% | 56% | – | – | 3%[cq] | 5% |
| SurveyUSA | Nov 20–22, 2019 | 2,039 (RV) | ± 2.4% | 32% | 59% | – | – | – | 9% |
| SurveyUSA | Oct 15–16, 2019 | 1,242 (RV) | ± 3.8% | 32% | 59% | – | – | – | 9% |
| Emerson College | Sep 13–16, 2019 | 830 (RV) | ± 3.3% | 36% | 64% | – | – | – | – |
| SurveyUSA | Sep 13–15, 2019 | 1,785 (RV) | ± 3.2% | 31% | 57% | – | – | – | 11% |
| SurveyUSA | Aug 1–5, 2019 | 2,184 (RV) | ± 2.7% | 27% | 61% | – | – | – | 12% |
| SurveyUSA | Mar 22–25, 2018 | 882 (RV) | ± 3.8% | 33% | 56% | – | – | – | 11% |
Colorado
Graphical summary
Graphs are unavailable due to technical issues. There is more info on Phabricator and on MediaWiki.org. |
Aggregate polls
| Source of poll aggregation |
Dates administered |
Dates updated |
Joe Biden Democratic |
Donald Trump Republican |
Other/ Undecided [a] |
Margin |
|---|---|---|---|---|---|---|
| 270 to Win | October 15 – November 2, 2020 | November 3, 2020 | 52.0% | 40.6% | 7.4% | Biden +11.4 |
| FiveThirtyEight | until November 2, 2020 | November 3, 2020 | 53.6% | 41.1% | 5.3% | Biden +12.5 |
| Average | 52.8% | 40.8% | 6.4% | Biden +12.0 | ||
Polls
| Poll source | Date(s) administered |
Sample size[cr] |
Margin of error |
Donald Trump Republican |
Joe Biden Democratic |
Jo Jorgensen Libertarian |
Howie Hawkins Green |
Other | Undecided |
|---|---|---|---|---|---|---|---|---|---|
| SurveyMonkey/Axios | Oct 20 – Nov 2, 2020 | 2,991 (LV) | ± 2.5% | 44%[cs] | 55% | – | – | – | – |
| Keating Research/Onsight Public Affairs/Colorado Sun | Oct 29 – Nov 1, 2020 | 502 (LV)[ct] | ± 4.4% | 41% | 53% | – | – | – | – |
| Data for Progress | Oct 27 – Nov 1, 2020 | 709 (LV) | ± 3.7% | 42% | 54% | 3% | 1% | 0%[cu] | – |
| Swayable Archived November 27, 2020, at the Wayback Machine | Oct 23 – Nov 1, 2020 | 455 (LV) | ± 6% | 41% | 55% | 3% | 1% | – | – |
| Morning Consult | Oct 22–31, 2020 | 727 (LV) | ± 4% | 41% | 54% | – | – | – | – |
| SurveyMonkey/Axios | Oct 1–28, 2020 | 5,925 (LV) | – | 40% | 59% | – | – | – | – |
| Morning Consult | Oct 11–20, 2020 | 788 (LV) | ± 3.5% | 39% | 55% | – | – | – | – |
| RBI Strategies | Oct 12–16, 2020 | 502 (LV) | ± 4.4% | 38% | 55% | 3% | 1% | 1%[cv] | 1% |
| RMG Research/PoliticalIQ | Oct 9–15, 2020 | 800 (LV) | ± 3.5% | 43% | 51% | – | – | 1%[cw] | 3% |
| Civiqs/Daily Kos | Oct 11–14, 2020 | 1,013 (LV) | ± 3.6% | 42% | 53% | – | – | 3%[cv] | 1% |
| Keating Research/OnSight Public Affairs/Melanson | Oct 8–13, 2020 | 519 (LV) | ± 4.3% | 39% | 54% | – | – | 3%[cx] | 4% |
| Morning Consult | Oct 2–11, 2020 | 837 (LV) | ± 3.4% | 40% | 54% | – | – | – | – |
| YouGov/University of Colorado | Oct 5–9, 2020 | 800 (LV) | ± 4.64% | 38% | 47% | – | – | 3% | 11% |
| SurveyUSA/9News/Colorado Politics | Oct 1–6, 2020 | 1,021 (LV) | ± 3.9% | 40% | 50% | – | – | 5%[cy] | 4% |
| SurveyMonkey/Axios | Sep 1–30, 2020 | 2,717 (LV) | – | 41% | 57% | – | – | – | 2% |
| Morning Consult | Aug 29 – Sep 7, 2020 | 657 (LV) | ± (2%–4%) | 43%[cz] | 49% | – | – | – | – |
| Fabrizio Ward/Hart Research Associates/AARP | Aug 30 – Sep 5, 2020 | 800 (LV) | ± 3.5% | 40% | 50% | – | – | 2%[da] | 8% |
| Global Strategy Group/Progress Colorado[Q] | Aug 28 – Sep 1, 2020 | 800 (LV) | ± 3.5% | 39% | 50% | 4% | 1% | 1%[db] | 4% |
| SurveyMonkey/Axios | Aug 1–31, 2020 | 2,385 (LV) | – | 41% | 57% | – | – | – | 2% |
| Morning Consult[6] | Aug 21–30, 2020 | 638 (LV) | ± 4% | 41%[cz] | 51% | – | – | – | – |
| Morning Consult | Aug 16–25, 2020 | ~600 (LV) | ± 4.0% | 42% | 51% | – | – | – | – |
| Morning Consult[7] | Aug 7–16, 2020 | 601 (LV) | ± 4% | 41%[dc] | 51% | – | – | – | – |
| Morning Consult | Aug 6–15, 2020 | ~600 (LV) | ± 4.0% | 41% | 51% | – | – | – | – |
| Morning Consult | Jul 7 – Aug 5, 2020 | ~600 (LV) | ± 4.0% | 40% | 52% | – | – | – | – |
| SurveyMonkey/Axios | Jul 1–31, 2020 | 2,337 (LV) | – | 40% | 58% | – | – | – | 2% |
| Morning Consult | Jul 17–26, 2020 | 616 (LV) | ± 4.0% | 39%[cz] | 52% | – | – | – | – |
| Morning Consult | Jul 13–22, 2020 | ~600 (LV) | ± 4.0% | 41% | 51% | – | – | – | – |
| Public Policy Polling/AFSCME[F] | Jul 23–24, 2020 | 891 (V) | – | 41% | 54% | – | – | – | 5% |
| Public Policy Polling/End Citizens United | Jun 29–30, 2020 | 840 (V) | ± 3.4% | 39% | 56% | – | – | – | 5% |
| SurveyMonkey/Axios | Jun 8–30, 2020 | 1,088 (LV) | – | 42% | 57% | – | – | – | 2% |
| Morning Consult | May 17–26, 2020 | 572 (LV) | – | 42% | 50% | – | – | – | – |
| Global Strategy Group (D) | May 7–11, 2020 | 700 (RV) | ± 3.5% | 40% | 53% | – | – | – | 7% |
| Keating Research/OnSight Public Affairs/Melanson/Colorado Politics | May 1–3, 2020 | 600 (LV) | ± 4% | 36% | 55% | – | – | 3%[cx] | 6% |
| Montana State University Bozeman | Apr 10–19, 2020 | 379 (LV) | – | 35% | 53% | – | – | 3% | 8% |
| Climate Nexus | Feb 11–15, 2020 | 485 (RV) | ± 4.5% | 43% | 46% | – | – | – | 11% |
| Emerson College Archived August 20, 2019, at the Wayback Machine | Aug 16–19, 2019 | 1,000 (RV) | ± 3.0% | 45% | 55% | – | – | – | – |
| Fabrizio Ward/AARP | Jul 29–31, 2019 | 600 (LV) | ± 4.0% | 42% | 51% | – | – | 1%[dd] | 5% |
Connecticut
Graphical summary
Graphs are unavailable due to technical issues. There is more info on Phabricator and on MediaWiki.org. |
Aggregate polls
| Source of poll aggregation |
Dates administered |
Dates updated |
Joe Biden Democratic |
Donald Trump Republican |
Other/ Undecided [a] |
Margin |
|---|---|---|---|---|---|---|
| FiveThirtyEight | until November 2, 2020 | November 3, 2020 | 58.6% | 32.4% | 9.0% | Biden +26.3 |
Polls
| Poll source | Date(s) administered |
Sample size[de] |
Margin of error |
Donald Trump Republican |
Joe Biden Democratic |
Jo Jorgensen Libertarian |
Howie Hawkins Green |
Other | Undecided |
|---|---|---|---|---|---|---|---|---|---|
| SurveyMonkey/Axios | Oct 20 – Nov 2, 2020 | 2,031 (LV) | ± 3.5% | 38%[df] | 60% | - | - | – | – |
| Swayable[dg] | Oct 23 – Nov 1, 2020 | 367 (LV) | ± 6.2% | 33% | 64% | 2% | 1% | – | – |
| SurveyMonkey/Axios | Oct 1–28, 2020 | 3,782 (LV) | – | 35% | 63% | - | - | – | – |
| Sacred Heart University[dh] | Oct 8–21, 2020 | 1,000 (A) | ± 3.02% | 26% | 51% | - | - | 2% | 20% |
| SurveyMonkey/Axios | Sep 1–30, 2020 | 1,415 (LV) | – | 37% | 61% | - | - | – | 2% |
| SurveyMonkey/Axios | Aug 1–31, 2020 | 1,009 (LV) | – | 35% | 64% | - | - | – | 1% |
| SurveyMonkey/Axios | Jul 1–31, 2020 | 1,360 (LV) | – | 39% | 59% | - | - | – | 2% |
| SurveyMonkey/Axios | Jun 8–30, 2020 | 574 (LV) | – | 32% | 65% | - | - | – | 3% |
| SurveyUSA | May 19–24, 2020 | 808 (RV) | ± 4.5% | 33% | 52% | - | - | 7%[di] | 8% |
| Quinnipiac University | Apr 30 – May 4, 2020 | 945 (RV) | ± 3.2% | 33% | 56% | - | - | 3%[dj] | 7% |
| Sacred Heart University/Hartford Courant | Mar 24 – Apr 3, 2020 | 1,000 (A) | ± 3.0% | 34% | 47% | - | - | – | – |
| Sacred Heart University/Hartford Courant | Feb 24 – Mar 12, 2020 | 1,000 (A) | ± 3.0% | 36% | 52% | - | - | – | – |
| Sacred Heart University/Hartford Courant | Dec 16, 2019 – Jan 2, 2020 | 1,000 (A) | ± 3.0% | 32% | 52% | - | - | – | 16% |
| Sacred Heart University/Hartford Courant | Sep 17 – Oct 2, 2019 | 1,000 (A) | ± 3.2% | 33% | 52% | - | - | – | 15% |
Delaware

Aggregate polls
| Source of poll aggregation |
Dates administered |
Dates updated |
Joe Biden Democratic |
Donald Trump Republican |
Other/ Undecided [a] |
Margin |
|---|---|---|---|---|---|---|
| 270 to Win | October 5 – November 1, 2020 | November 3, 2020 | 57.5% | 35.5% | 7.0% | Biden +22.0 |
| FiveThirtyEight | until November 2, 2020 | November 3, 2020 | 58.9% | 34.6% | 6.5% | Biden +24.3 |
| Average | 58.2% | 35.1% | 6.8% | Biden +23.2 | ||
| Poll source | Date(s) administered |
Sample size[dk] |
Margin of error |
Donald Trump Republican |
Joe Biden Democratic |
Jo Jorgensen Libertarian |
Howie Hawkins Green |
Undecided |
|---|---|---|---|---|---|---|---|---|
| SurveyMonkey/Axios | Oct 20 – Nov 2, 2020 | 656 (LV) | ± 6% | 38%[dl] | 60% | - | - | – |
| SurveyMonkey/Axios | Oct 1–28, 2020 | 1,323 (LV) | – | 37% | 62% | - | - | – |
| SurveyMonkey/Axios | Sep 1–30, 2020 | 395 (LV) | – | 37% | 61% | - | - | 2% |
| University of Delaware | Sep 21–27, 2020 | 847 (LV) | – | 33% | 54% | 2% | 1% | 10%[dm] |
| SurveyMonkey/Axios | Aug 1–31, 2020 | 348 (LV) | – | 32% | 67% | - | - | 1% |
| PPP | Aug 21–22, 2020 | 710 (V) | ± 3.7% | 37% | 58% | - | - | 5% |
| SurveyMonkey/Axios | Jul 1–31, 2020 | 453 (LV) | – | 31% | 67% | - | - | 2% |
| SurveyMonkey/Axios | Jun 8–30, 2020 | 232 (LV) | – | 34% | 64% | - | - | 2% |
| Gonzales Research | Jan 16–21, 2020 | 410 (LV) | ± 5.0% | 40% | 56% | - | - | 4% |
Florida
Graphical summary
Graphs are unavailable due to technical issues. There is more info on Phabricator and on MediaWiki.org. |
Aggregate polls
| Source of poll aggregation |
Dates administered |
Dates updated |
Joe Biden Democratic |
Donald Trump Republican |
Other/ Undecided[a] |
Margin |
|---|---|---|---|---|---|---|
| 270 to Win | October 24 – November 1, 2020 | November 3, 2020 | 48.7% | 46.0% | 5.3% | Biden +2.7 |
| Real Clear Politics | October 28 – November 2, 2020 | November 3, 2020 | 47.9% | 47.0% | 5.1% | Biden +0.9 |
| FiveThirtyEight | until November 2, 2020 | November 3, 2020 | 49.1% | 46.6% | 4.3% | Biden +2.5 |
| Average | 48.6% | 46.5% | 4.9% | Biden +2.1 | ||
State polls
| Poll source | Date(s) administered |
Sample size[dk] |
Margin of error |
Donald Trump Republican |
Joe Biden Democratic |
Jo Jorgensen Libertarian |
Howie Hawkins Green |
Other | Undecided |
|---|---|---|---|---|---|---|---|---|---|
| Insider Advantage/Fox 35 | Nov 1–2, 2020[al] | 400 (LV) | ± 4.4% | 48% | 47% | 2% | - | – | 3% |
| Trafalgar Group | Oct 31 – Nov 2, 2020 | 1,054 (LV) | ± 2.94% | 49% | 47% | 2% | - | 1%[dn] | 1% |
| SurveyMonkey/Axios | Oct 20 – Nov 2, 2020 | 8,792 (LV) | ± 1.5% | 49%[do] | 49% | - | - | – | – |
| AYTM/Aspiration | Oct 30 – Nov 1, 2020 | 517 (LV) | – | 43% | 45% | - | - | – | – |
| Change Research/CNBC | Oct 29 – Nov 1, 2020 | 806 (LV) | ± 3.45% | 48% | 51% | 0% | 0% | – | 1% |
| Susquehanna Polling & Research Inc./Center for American Greatness[H] | Oct 29 – Nov 1, 2020 | 400 (LV) | ± 4.9% | 47% | 46% | 2% | - | 2%[dp] | 3% |
| Quinnipiac University | Oct 28 – Nov 1, 2020 | 1,657 (LV) | ± 2.4% | 42% | 47% | - | - | 1%[dn] | 9% |
| Swayable Archived November 13, 2020, at the Wayback Machine | Oct 27 – Nov 1, 2020 | 1,261 (LV) | ± 3.7% | 46% | 53% | 1% | 1% | – | – |
| Data for Progress | Oct 27 – Nov 1, 2020 | 1,202 (LV) | ± 2.8% | 48% | 51% | 1% | 1% | 0%[dq] | – |
| Ipsos/Reuters | Oct 27 – Nov 1, 2020 | 670 (LV) | ± 4.3% | 46%[o] | 50% | 1% | 0% | 1%[dr] | – |
| 46%[ds] | 50% | - | - | 2%[r] | 2% | ||||
| 47%[dt] | 51% | - | - | 2%[du] | – | ||||
| Frederick Polls/Compete Everywhere[R] | Oct 30–31, 2020 | 768 (LV) | ± 3.5% | 49% | 51% | - | - | – | – |
| Pulse Opinion Research/Rasmussen Reports | Oct 29–31, 2020 | 800 (LV) | ± 3.5% | 47% | 48% | - | - | 3%[dv] | – |
| Siena College/NYT Upshot | Oct 27–31, 2020 | 1,451 (LV) | ± 3.2% | 44% | 47% | 2% | 1% | 0%[dw] | 6%[dx] |
| Morning Consult | Oct 22–31, 2020 | 4,451 (LV) | ± 2% | 45% | 52% | - | - | – | – |
| St. Pete Polls | Oct 29–30, 2020 | 2,758 (LV) | ± 1.9% | 48% | 49% | 1% | - | – | 2% |
| RMG Research/PoliticalIQ | Oct 28–30, 2020 | 1,200 (LV) | ± 2.8% | 47%[o] | 51% | - | - | 2%[du] | 0% |
| 45%[dy] | 52% | - | - | 2%[du] | 0% | ||||
| 48%[dz] | 49% | - | - | 2%[du] | 0% | ||||
| Targoz Market Research/PollSmart | Oct 25–30, 2020 | 1,027 (LV) | – | 47% | 51% | - | - | 2%[ea] | – |
| AtlasIntel | Oct 28–29, 2020 | 786 (LV) | ± 3% | 48.5% | 48.5% | - | - | – | 3% |
| Public Policy Polling/Climate Power 2020[S] | Oct 28–29, 2020 | 941 (V) | – | 45% | 52% | - | - | – | 3% |
| Harvard-Harris/The Hill | Oct 26–29, 2020 | 1,148 (LV) | ± >=3% | 47% | 50% | - | - | – | 3% |
| ABC/Washington Post | Oct 24–29, 2020 | 824 (LV) | ± 4% | 50% | 48% | 1% | 0% | 0%[eb] | 0% |
| Redfield & Wilton Strategies | Oct 27–28, 2020 | 1,587 (LV) | – | 46% | 50% | 1% | 0% | 0% | 3% |
| Trafalgar Group | Oct 25–28, 2020 | 1,088 (LV) | ± 2.89% | 50% | 47% | 2% | - | 1%[dn] | 1% |
| Monmouth University | Oct 24–28, 2020 | 509 (RV) | ± 4.7% | 45% | 50% | 1% | 0% | 1%[ec] | 2% |
| 509 (LV) | 45%[ed] | 51% | - | - | – | – | |||
| 46%[ee] | 50% | - | - | – | – | ||||
| SurveyMonkey/Axios | Oct 1–28, 2020 | 14,571 (LV) | – | 50% | 48% | - | - | – | – |
| Marist College/NBC | Oct 25–27, 2020 | 743 (LV) | ± 4.4% | 47% | 51% | - | - | 1% | 1% |
| Quinnipiac University | Oct 23–27, 2020 | 1,324 (LV) | ± 2.7% | 42% | 45% | - | - | 1%[dn] | 11% |
| Ipsos/Reuters | Oct 21–27, 2020 | 704 (LV) | ± 4.2% | 47%[o] | 48% | 1% | 1% | 2%[ef] | – |
| 47%[ds] | 49% | - | - | 3%[eg] | 2% | ||||
| Swayable | Oct 23–26, 2020 | 605 (LV) | ± 5.4% | 51% | 46% | 2% | 1% | – | – |
| YouGov/Institute of Politics at Florida State University | Oct 16–26, 2020 | 1,200 (LV) | ± 3.2% | 46% | 48% | - | - | – | 6% |
| Wick Surveys | Oct 24–25, 2020 | 1,000 (LV) | ± 3.1% | 50% | 47% | - | - | – | – |
| Florida Atlantic University | Oct 24–25, 2020 | 937 (LV) | ± 3.1% | 48% | 50% | - | - | 2%[ah] | – |
| Susquehanna Polling & Research Inc./Center for American Greatness[H] | Oct 23–25, 2020 | 400 (LV) | ± 4.9% | 49% | 44% | 2% | - | 3%[eh] | 3% |
| Univision/University of Houston/Latino Decisions/North Star Opinion Research |
Oct 17–25, 2020 | 743 (RV) | ± 3.56% | 46% | 49% | - | - | 2%[ah] | 3% |
| Ryan Tyson (R) | Released Oct 24, 2020 | – (V)[ei] | – | 47% | 45% | - | - | 3%[ej] | 4% |
| Gravis Marketing | Oct 24, 2020 | 665 (LV) | ± 3.8% | 48% | 47% | - | - | – | 5% |
| YouGov/CBS | Oct 20–23, 2020 | 1,228 (LV) | ± 3.6% | 48% | 50% | - | - | 2%[ek] | 0% |
| St. Pete Polls/Florida Politics | Oct 21–22, 2020 | 2,527 (LV) | ± 2% | 47% | 49% | - | - | 2%[el] | 2% |
| RMG Research/PoliticalIQ | Oct 20–22, 2020 | 800 (LV) | ± 3.5% | 48%[o] | 50% | - | - | 1%[em] | 1% |
| 46%[dy] | 52% | - | - | 1%[em] | 1% | ||||
| 48%[dz] | 46% | - | - | 1%[em] | 1% | ||||
| Pulse Opinion Research/Rasmussen Reports | Oct 20–21, 2020 | 800 (LV) | ± 3.5% | 50% | 46% | - | - | 3%[en] | 3% |
| Ipsos/Reuters | Oct 14–21, 2020 | 662 (LV) | ± 4.3% | 46%[o] | 51% | 1% | 0% | 2%[ef] | – |
| 46%[ds] | 50% | - | - | 1%[eo] | 3% | ||||
| Citizen Data | Oct 17–20, 2020 | 1,000 (LV) | ± 3.1% | 45% | 50% | 1% | 0% | 1% | 4% |
| Civiqs/Daily Kos | Oct 17–20, 2020 | 863 (LV) | ± 3.5% | 47% | 51% | - | - | 1%[dn] | 1% |
| CNN/SSRS | Oct 15–20, 2020 | 847 (LV) | ± 4% | 46% | 50% | 1% | 1% | 0%[ep] | 1% |
| Morning Consult | Oct 11–20, 2020 | 4,685 (LV) | ± 1.4% | 45% | 52% | - | - | – | – |
| Change Research/CNBC | Oct 16–19, 2020 | 547 (LV)[al] | – | 45% | 50% | - | - | – | – |
| University of North Florida | Oct 12–16, 2020 | 863 (LV) | ± 3.3% | 47% | 48% | - | - | 1%[dn] | 3% |
| HarrisX/The Hill[8] | Oct 12–15, 2020 | 965 (LV) | – | 48% | 48% | - | - | – | 4% |
| Ipsos/Reuters | Oct 7–14, 2020 | 653 (LV) | ± 4.4% | 47%[o] | 50% | 0% | 0% | 2%[eq] | – |
| 47%[ds] | 49% | - | - | 1%[eo] | 3% | ||||
| Trafalgar Group | Oct 11–13, 2020 | 1,051 (LV) | ± 2.94% | 48% | 46% | 2% | 1% | 1%[dn] | 2% |
| Redfield & Wilton Strategies | Oct 10–13, 2020 | 1,519 (LV) | – | 44%[al] | 50% | 1% | 0% | – | – |
| St. Pete Polls/Florida Politics | Oct 11–12, 2020 | 2,215 (LV) | ± 2.1% | 47% | 49% | - | - | 1%[er] | 2% |
| Emerson College | Oct 10–12, 2020 | 690 (LV) | ± 3.7% | 48%[es] | 51% | - | - | 1%[dn] | – |
| Mason-Dixon | Oct 8–12, 2020 | 625 (LV) | ± 4% | 45% | 48% | - | - | 1%[et] | 6% |
| Clearview Research | Oct 7–12, 2020 | 550 (LV) | ± 4.18% | 40%[o] | 47% | - | - | 4%[eu] | 9% |
| 39%[ev] | 48% | - | - | 4%[eu] | 9% | ||||
| 41%[ew] | 46% | - | - | 4%[eu] | 9% | ||||
| Morning Consult | Oct 2–11, 2020 | 4,785 (LV) | ± 1.4% | 46% | 51% | - | - | – | – |
| Redfield & Wilton Strategies | Oct 9–10, 2020 | 750 (LV) | – | 42%[al] | 53% | 1% | 0% | – | – |
| Florida Atlantic University | Oct 9–10, 2020 | 644 (LV) | ± 3.8% | 47% | 51% | - | - | 2%[ah] | – |
| RMG Research/PoliticalIQ | Oct 4–8, 2020 | 800 (LV) | – | 46%[o] | 48% | 1% | 1% | 1% | 4% |
| 44%[dy] | 50% | 1% | 1% | 1% | 4% | ||||
| 47%[dz] | 46% | 1% | 1% | 1% | 4% | ||||
| Insider Advantage/Hannity Exclusive (R) | Oct 6–7, 2020 | 400 (LV) | ± 4.9% | 49% | 46% | 1% | - | – | 10% |
| YouGov/CCES Archived November 1, 2020, at the Wayback Machine | Sep 29 – Oct 7, 2020 | 3,755 (LV) | – | 47% | 49% | - | - | – | – |
| Ipsos/Reuters | Sep 29 – Oct 7, 2020 | 678 (LV) | ± 4.3% | 45% | 49% | - | - | 1%[eo] | 5% |
| Redfield & Wilton Strategies | Oct 4–6, 2020 | 998 (LV) | ± 3.1% | 44% | 49% | 1% | 0% | 1%[aw] | 6% |
| Quinnipiac University | Oct 1–5, 2020 | 1,256 (LV) | ± 2.8% | 40% | 51% | - | - | 1%[dn] | 7% |
| Change Research/CNBC | Oct 2–4, 2020 | 560 (LV) | – | 46% | 50% | - | - | – | – |
| Suffolk University/USA Today[9] | Oct 1–4, 2020 | 500 (LV) | ± 4.4% | 45%[o] | 45% | 2% | 0%[ex] | 2%[ey] | 6% |
| 46%[ez] | 45% | - | - | 2%[fa] | 7% | ||||
| University of North Florida | Oct 1–4, 2020 | 3,134 (LV) | ± 1.8% | 45% | 51% | - | - | 1%[dn] | 3%[dx] |
| St. Leo University | Sep 27 – Oct 2, 2020 | 489 (LV) | – | 44% | 50% | - | - | – | 5% |
| Siena College/NYT Upshot | Sep 30 – Oct 1, 2020 | 710 (LV) | ± 4.2% | 42% | 47% | 2% | 1% | 0%[dw] | 8%[dx] |
| SurveyMonkey/Axios | Sep 1–30, 2020 | 12,962 (LV) | – | 47% | 51% | - | - | – | 2% |
| Cherry Communications/Florida Chamber of Commerce | Sep 23–29, 2020 | 600 (LV) | ± 4% | 44%[al] | 49% | - | - | – | – |
| Susquehanna Polling & Research Inc./Center for American Greatness[H] | Sep 23–26, 2020 | 500 (LV) | ± 4.3% | 43% | 46% | 3% | - | – | 8%[dx] |
| Redfield & Wilton Strategies | Sep 23–25, 2020 | 1,073 (LV) | ± 2.99% | 43% | 48% | 1% | 1% | 1%[aw] | 7% |
| St. Pete Polls | Sep 21–22, 2020 | 2,906 (LV) | ± 1.8% | 47% | 50% | - | - | 2%[el] | 2% |
| Data For Progress[T] | Sep 15–22, 2020 | 620 (LV) | ± 3.9% | 43% | 46% | - | - | – | 11% |
| Change Research/CNBC | Sep 18–20, 2020 | 702 (LV) | – | 46% | 49% | - | - | – | – |
| ABC/Washington Post | Sep 15–20, 2020 | 613 (LV) | ± 4.5% | 51% | 47% | - | - | 1%[fb] | 1% |
| Hart Research Associates/Human Rights Campaign[permanent dead link][U] | Sep 17–19, 2020 | 400 (LV) | ± 4.9% | 45% | 51% | - | - | – | – |
| YouGov/CBS | Sep 15–18, 2020 | 1,205 (LV) | ± 3.7% | 46% | 48% | - | - | 1%[fc] | 5% |
| Ipsos/Reuters | Sep 11–17, 2020 | 586 (LV) | ± 4.6% | 47% | 47% | - | - | 2%[r] | 4% |
| Redfield & Wilton Strategies | Sep 12–14, 2020 | 1,158 (LV) | ± 2.88% | 44% | 47% | 1% | 1% | 1%[aw] | 6% |
| Monmouth University | Sep 10–13, 2020 | 428 (RV) | ± 4.7% | 45% | 50% | 2% | 0% | 1%[fd] | 3% |
| 428 (LV) | 45%[fe] | 50% | - | - | 1%[ff] | 3% | |||
| 46%[fg] | 49% | - | - | 1%[ff] | 3% | ||||
| Kaiser Family Foundation/Cook Political Report | Aug 29 – Sep 13, 2020 | 1,009 (RV) | ± 4.0% | 42% | 43% | - | - | 4%[fh] | 11% |
| Florida Atlantic University | Sep 11–12, 2020 | 631 (LV) | ± 3.8% | 50% | 50% | - | - | 0%[fi] | – |
| St. Pete Polls/Florida Politics/AARP | Sep 7–8, 2020 | 2,689 (LV) | ± 1.9% | 47% | 50% | - | - | 2%[el] | 2% |
| Benenson Strategy Group/GS Strategy Group/AARP | Aug 30 – Sep 8, 2020 | 1,600 (LV) | ± 2.5% | 46% | 48% | - | - | 2%[fj] | 4% |
| Morning Consult | Aug 29 – Sep 7, 2020 | 3,914 (LV) | ± (2%-4%) | 43%[bg] | 50% | - | - | – | – |
| Change Research/CNBC | Sep 4–6, 2020 | 1,144 (LV) | – | 46% | 49% | - | - | 4%[fk] | – |
| Marist College/NBC | Aug 31 – Sep 5, 2020 | 760 (LV) | ± 4.5% | 48% | 48% | - | - | 1% | 2% |
| Trafalgar Group | Sep 1–3, 2020 | 1,022 (LV) | ± 3.0% | 49% | 46% | 2% | - | 1%[fl] | 2% |
| Redfield & Wilton Strategies | Aug 30 – Sep 3, 2020 | 1,093 (LV) | ± 2.96% | 43% | 48% | 1% | 1% | 1%[aw] | 6% |
| GQR Research (D) | Aug 26 – Sep 3, 2020 | 800 (LV) | ± 3.5% | 46% | 51% | - | - | – | – |
| Quinnipiac Archived September 3, 2020, at the Wayback Machine | Aug 28 – Sep 1, 2020 | 1,235 (LV) | ± 2.8% | 45% | 48% | - | - | 1%[dn] | 5% |
| SurveyMonkey/Axios | Aug 1–31, 2020 | 12,286 (LV) | – | 50% | 48% | - | - | – | 2% |
| Morning Consult | Aug 21–30, 2020 | 3,790 (LV) | ± (2%–4%) | 47% | 49% | - | - | – | – |
| Opinium/The Guardian[10] | Aug 21–26, 2020 | 684 (LV) | – | 43% | 50% | - | - | 1% | 6% |
| Change Research/CNBC | Aug 21–23, 2020 | 1,262 (LV) | – | 46% | 49% | - | - | – | – |
| PPP | Aug 21–22, 2020 | 671 (V) | ± 3.8% | 44% | 48% | - | - | – | 7% |
| Redfield and Wilton Strategies | Aug 16, 2020 | 1,280 (LV) | – | 41% | 49% | 1% | - | 1%[aw] | 7% |
| Morning Consult | Aug 7–16, 2020 | 3,484 (LV) | ± (2%–4%) | 45% | 50% | - | - | – | – |
| Tyson Group/Consumer Energy Alliance[V] | Aug 11–15, 2020 | 750 (LV) | ± 4% | 44% | 46% | 2% | - | 1%[fm] | 6% |
| Change Research/CNBC | Aug 7–9, 2020 | 469 (LV) | – | 44% | 50% | - | - | – | – |
| OnMessage Inc./Heritage Action[W] | Aug 2–4, 2020 | 400 (LV) | – | 49% | 49% | - | - | – | 2% |
| SurveyMonkey/Axios | Jul 1–31, 2020 | 13,945 (LV) | – | 48% | 49% | - | - | – | 2% |
| Change Research/CNBC[11] | Jul 24–26, 2020 | 685 (LV) | – | 45% | 48% | - | - | – | – |
| Morning Consult | Jul 17–26, 2020 | 3,760 (LV) | ± 1.6% | 46%[bg] | 49% | - | - | – | – |
| Morning Consult | Jul 16–25, 2020 | – (LV)[ei] | – | 45% | 49% | - | - | – | – |
| CNN/SSRS | Jul 18–24, 2020 | 880 (RV) | ± 3.8% | 46% | 51% | - | - | 2%[fn] | 2% |
| Zogby Analytics | Jul 21–23, 2020 | 811 (RV) | ± 3.4% | 43% | 43% | 3% | 2% | – | 9% |
| Mason-Dixon | Jul 20–23, 2020 | 625 (LV) | ± 4.0% | 46% | 50% | - | - | – | 4% |
| Redfield & Wilton Strategies | Jul 19–21, 2020 | 1,121 (LV) | – | 41% | 48% | 1% | 1% | 1%[aw] | 8% |
| Quinnipiac University | Jul 16–20, 2020 | 924 (RV) | ± 4.3% | 38% | 51% | - | - | 6%[fo] | 5% |
| Morning Consult | Jul 6–15, 2020 | – (LV)[ei] | – | 45% | 50% | - | - | – | – |
| Florida Politics/AARP Florida/St. Pete Polls | Jul 13–14, 2020 | 3,018 (RV) | ± 1.8% | 44% | 50% | - | - | 2%[fp] | 3% |
| Gravis Marketing | Jul 13, 2020 | 513 (LV) | ± 4.3% | 43% | 53% | - | - | – | 4% |
| Change Research/CNBC | Jul 10–12, 2020 | 1,128 (LV) | – | 43% | 50% | - | - | – | – |
| YouGov/CBS | Jul 7–10, 2020 | 1,206 (LV) | ± 3.6% | 42% | 48% | - | - | 2%[fq] | 8% |
| Morning Consult | Jun 26 – Jul 5, 2020 | – (LV)[ei] | – | 46% | 49% | - | - | – | – |
| Trafalgar Group | Jun 29 – Jul 2, 2020 | 1,072 (LV) | ± 2.91% | 46% | 46% | - | - | 5%[fr] | 3% |
| SurveyMonkey/Axios | Jun 8–30, 2020 | 5,663 (LV) | – | 51% | 47% | - | - | – | 2% |
| Change Research/CNBC | Jun 26–28, 2020 | 951 (LV)[al] | – | 45% | 50% | - | - | – | – |
| Morning Consult | Jun 16–25, 2020 | – (LV)[ei] | – | 45% | 49% | - | - | – | – |
| Fox News | Jun 20–23, 2020 | 1,010 (RV) | ± 3% | 40% | 49% | - | - | 6%[fs] | 6% |
| Siena College/NYT Upshot | Jun 8–18, 2020 | 651 (RV) | ± 4.6% | 41% | 47% | - | - | 4%[ft] | 7% |
| Redfield & Wilton Strategies | Jun 14–15, 2020 | 1,079 (LV) | ± 2.98% | 41% | 45% | 1% | 1% | 1%[aw] | 11% |
| Morning Consult | Jun 6–15, 2020 | – (LV)[ei] | – | 45% | 50% | - | - | – | – |
| Change Research/CNBC | Jun 12–14, 2020 | 713 (LV)[al] | – | 43% | 50% | - | - | 3%[fu] | – |
| Gravis Marketing/OANN | Released Jun 11, 2020 | – (V)[ei] | – | 50% | 50% | - | - | – | – |
| TIPP/American Greatness PAC Archived June 16, 2020, at the Wayback Machine[H] | Jun 9–11, 2020 | 875 (LV) | – | 40% | 51% | - | - | 4%[fv] | 5% |
| Morning Consult | May 27 – Jun 5, 2020 | – (LV)[ei] | – | 48% | 47% | - | - | – | – |
| Change Research/CNBC | May 29–31, 2020 | 1,186 (LV)[al] | – | 45% | 48% | - | - | 2% | 4% |
| Cygnal (R) | May 18–30, 2020 | 881 (LV) | ± 3.3% | 43.8% | 47% | - | - | 3.3%[fw] | 5.9% |
| St. Pete Polls | May 26–27, 2020 | 4,763 (RV) | ± 1.4% | 46.7% | 47.5% | - | - | 2.7%[fx] | 3.1% |
| Morning Consult | May 17–26, 2020 | 3,593 (LV) | – | 48%[bg] | 47% | - | - | – | – |
| Morning Consult | May 16–25, 2020 | – (LV)[ei] | – | 48% | 47% | - | - | – | – |
| Point Blank Political | May 14–17, 2020 | 2,149 (LV) | ± 3.5% | 44% | 45% | 1%[fy] | <1%[fz] | 2% | 8% |
| Point Blank Political | May 14–17, 2020 | 2,149 (LV) | ± 3.5% | 48% | 52% | - | - | – | – |
| Morning Consult | May 6–15, 2020 | – (LV)[ei] | – | 50% | 45% | - | - | – | – |
| Redfield & Wilton Strategies | May 10–14, 2020 | 1,014 (LV) | ± 3.1% | 43% | 45% | - | - | 3%[ga] | 10% |
| Florida Atlantic University | May 8–12, 2020 | 928 (RV) | ± 3.1% | 47% | 53% | - | - | – | – |
| Fox News | Apr 18–21, 2020 | 1,004 (RV) | ± 3.0% | 43% | 46% | - | - | 3% | 7% |
| Quinnipiac University | Apr 16–20, 2020 | 1,385 (RV) | ± 2.6% | 42% | 46% | - | - | 3% | 7% |
| St. Pete Polls | Apr 16–17, 2020 | 5,659 (RV) | ± 1.3% | 48% | 48% | - | - | – | 4% |
| University of North Florida | Mar 31 – Apr 4, 2020 | 3,244 (RV) | ± 1.7% | 40% | 46% | - | - | – | 8% |
| AtlasIntel | Mar 14–16, 2020 | 1,100 (RV) | ± 3.0% | 45% | 45% | - | - | 10% | – |
| Univision | Mar 6–12, 2020 | 1,071 (RV) | ± 3.0% | 48% | 45% | - | - | – | 7% |
| Florida Atlantic University | Mar 5–7, 2020 | 1,216 (RV) | ± 2.7% | 51% | 49% | - | - | – | – |
| University of North Florida | Feb, 2020 | 696 (LV) | – | 45% | 45% | - | - | – | 10%[dx] |
| Saint Leo University | Feb 17–22, 2020 | 900 (LV) | ± 3.5% | 40% | 51% | - | - | – | 8% |
| University of North Florida | Feb 10–18, 2020 | 668 (RV) | – | 48% | 49% | - | - | – | 3% |
| Florida Atlantic University | Jan 9–12, 2020 | 1,285 (RV) | ± 2.6% | 49% | 51% | - | - | – | – |
| Cherry Communications/Florida Chamber of Commerce[X] | Jan 3–12, 2020 | 608 (LV) | ± 4% | 49% | 45% | - | - | – | – |
| Mason-Dixon | Dec 11–16, 2019 | 625 (RV) | ± 4.0% | 45% | 47% | - | - | – | 8% |
| Siena College/NYT Upshot | Oct 13–26, 2019 | 650 (LV) | ± 4.4% | 44% | 46% | - | - | – | – |
| University of North Florida | Oct 14–20, 2019 | 643 (RV) | ± 3.8% | 43% | 48% | - | - | 6%[gb] | 3% |
| Florida Atlantic University | Sep 12–15, 2019 | 934 (RV) | ± 3.1% | 50.5% | 49.5% | - | - | – | – |
| Quinnipiac University | Jun 12–17, 2019 | 1,279 (RV) | ± 3.3% | 41% | 50% | - | - | 1% | 6% |
| St. Pete Polls | Jun 15–16, 2019 | 3,095 (LV) | ± 1.8% | 47% | 47% | - | - | – | 6% |
| Florida Atlantic University | May 16–19, 2019 | 1,007 (RV) | ± 3.0% | 50% | 50% | - | - | – | – |
| WPA Intelligence | Apr 27–30, 2019 | 200 (LV) | ± 6.9% | 48% | 44% | - | - | – | 7% |
Georgia
Graphical summary
Graphs are unavailable due to technical issues. There is more info on Phabricator and on MediaWiki.org. |
- Aggregate polls
| Source of poll aggregation |
Dates administered |
Dates updated |
Joe Biden Democratic |
Donald Trump Republican |
Other/ Undecided [a] |
Margin |
|---|---|---|---|---|---|---|
| 270 to Win | Oct 29 – Nov 2, 2020 | November 3, 2020 | 47.6% | 47.4% | 5.0% | Biden +0.2 |
| Real Clear Politics | Oct 23 – Nov 2, 2020 | November 3, 2020 | 47.2% | 48.2% | 4.6% | Trump +1.0 |
| FiveThirtyEight | until November 2, 2020 | November 3, 2020 | 48.5% | 47.4% | 4.1% | Biden +1.2 |
| Average | 47.8% | 47.7% | 4.6% | Biden +0.1 | ||
Polls
| Poll source | Date(s) administered |
Sample size[dk] |
Margin of error |
Donald Trump Republican |
Joe Biden Democratic |
Jo Jorgensen Libertarian |
Other | Undecided |
|---|---|---|---|---|---|---|---|---|
| Trafalgar Group | Oct 31 – Nov 2, 2020 | 1,041 (LV) | ± 2.96% | 50% | 45% | 3% | 1%[dn] | 1% |
| SurveyMonkey/Axios | Oct 20 – Nov 2, 2020 | 3,962 (LV) | ± 2.5% | 48%[gc] | 50% | – | – | – |
| Landmark Communications/WSBTV | Nov 1, 2020 | 500 (LV) | ± 4.4% | 50% | 46% | 3% | – | 1% |
| Insider Advantage/Center for American Greatness Archived November 2, 2020, at the Wayback Machine[H] | Nov 1, 2020 | 500 (LV) | ± 4.4% | 48% | 46% | 4% | – | 2% |
| AYTM/Aspiration | Oct 30 – Nov 1, 2020 | 380 (LV) | – | 48% | 52% | – | – | – |
| Swayable Archived November 13, 2020, at the Wayback Machine | Oct 27 – Nov 1, 2020 | 438 (LV) | ± 6.2% | 44% | 54% | 2% | – | – |
| Data for Progress | Oct 27 – Nov 1, 2020 | 1,036 (LV) | ± 3% | 48% | 50% | 1% | 0%[gd] | – |
| AtlasIntel | Oct 30–31, 2020 | 679 (LV) | ± 4% | 48% | 46% | – | 6% | – |
| Emerson College | Oct 29–31, 2020 | 749 (LV) | ± 3.5% | 49%[ai] | 48% | – | 2%[ah] | – |
| Morning Consult | Oct 22–31, 2020 | 1,743 (LV) | ± 2.0% | 46% | 49% | – | – | – |
| Landmark Communications/WSBTV | Oct 28, 2020 | 750 (LV) | ± 3.6% | 48% | 47% | 3% | – | 3% |
| Public Policy Polling | Oct 27–28, 2020 | 661 (V) | – | 46% | 48% | – | 4%[ge] | 2% |
| SurveyMonkey/Axios | Oct 1–28, 2020 | 7,019 (LV) | – | 48% | 50% | – | – | – |
| Monmouth University | Oct 23–27, 2020 | 504 (RV) | ± 4.4% | 45% | 50% | 2% | 1%[gf] | 2% |
| 504 (LV) | 46%[gg] | 50% | – | – | – | |||
| 48%[gh] | 50% | – | – | – | ||||
| Swayable | Oct 23–26, 2020 | 373 (LV) | ± 6.9% | 48% | 51% | 1% | – | – |
| Civiqs/Daily Kos | Oct 23–26, 2020 | 1,041 (LV) | ± 3.3% | 46% | 51% | – | 2%[ah] | 0% |
| Wick Surveys | Oct 24–25, 2020 | 1,000 (LV) | ± 3.1% | 49% | 47% | – | – | – |
| YouGov/CBS | Oct 20–23, 2020 | 1,090 (LV) | ± 3.4% | 49% | 49% | – | 2%[gi] | 0% |
| University of Georgia/AJC | Oct 14–23, 2020 | 1,145 (LV) | ± 4% | 46% | 47% | 3% | – | 4% |
| Landmark Communications/WSBTV | Oct 21, 2020 | 500 (LV) | ± 4.4% | 49% | 45% | – | – | 4% |
| Citizen Data | Oct 17–20, 2020 | 1,000 (LV) | ± 3% | 44% | 48% | 1% | 2%[gj] | 5% |
| Morning Consult | Oct 11–20, 2020 | 1,672 (LV) | ± 2.4% | 48% | 48% | – | – | – |
| Emerson College | Oct 17–19, 2020 | 506 (LV) | ± 4.3% | 48%[ai] | 47% | – | 5%[gk] | – |
| Siena College/NYT Upshot | Oct 13–19, 2020 | 759 (LV) | ± 4.1% | 45% | 45% | 2% | 2%[gl] | 7%[aa] |
| Opinion Insight/American Action Forum[J] | Oct 12–15, 2020 | 801 (LV) | ± 3.46% | 46%[ai] | 49% | – | 3%[gm] | 4%[aa] |
| Garin-Hart-Yang/Jon Ossoff[Y] | Oct 11–14, 2020 | 600 (LV) | – | 44% | 51% | – | – | – |
| Quinnipiac University | Oct 8–12, 2020 | 1,040 (LV) | ± 3.0% | 44% | 51% | – | 1%[dn] | 4% |
| SurveyUSA | Oct 8–12, 2020 | 677 (LV) | ± 5.7% | 46% | 48% | – | 2%[gn] | 4% |
| Data for Progress | Oct 8–11, 2020 | 782 (LV) | ± 3.5% | 46% | 46% | 2% | 1%[go] | 5% |
| Morning Consult | Oct 2–11, 2020 | 1,837 (LV) | ± 2.3% | 49% | 47% | – | – | – |
| Public Policy Polling | Oct 8–9, 2020 | 528 (V) | ± 4.3% | 46% | 47% | – | 3%[cv] | 3% |
| Landmark Communications | Oct 7, 2020 | 600 (LV) | ± 4.0% | 48.6% | 46.8% | 0.7% | – | 3.9% |
| YouGov/CCES Archived November 1, 2020, at the Wayback Machine | Sep 29 – Oct 7, 2020 | 1,456 (LV) | – | 47% | 48% | – | – | – |
| University of Georgia/AJC | Sep 27 – Oct 6, 2020 | 1,106 (LV) | ± 2.9% | 47% | 46% | 3% | – | 3% |
| Landmark Communications/WSB | Sep 30, 2020 | 500 (LV) | ± 4% | 45% | 47% | 3% | – | – |
| SurveyMonkey/Tableau | Sep 1–30, 2020 | 3,468 (LV) | – | 48% | 49% | – | – | 2% |
| Civiqs/Daily Kos | Sep 26–29, 2020 | 969 (LV) | ± 3.5% | 47% | 50% | – | 2%[ah] | 1% |
| Hart Research Associates/Human Rights Campaign[Z] | Sep 24–27, 2020 | 400 (LV) | ± 4.9% | 47% | 50% | – | – | – |
| Quinnipiac University | Sep 23–27, 2020 | 1,125 (LV) | ± 2.9% | 47% | 50% | – | 1%[dn] | 2% |
| Redfield & Wilton Strategies | Sep 23–26, 2020 | 789 (LV) | ± 3.49% | 44% | 45% | 2% | 1%[gp] | 8% |
| YouGov/CBS | Sep 22–25, 2020 | 1,164 (LV) | ± 3.4% | 47% | 46% | – | 2%[ah] | 5% |
| Monmouth University | Sep 17–21, 2020 | 402 (RV) | ± 4.9% | 47% | 46% | 2% | 0%[gq] | 4% |
| 402 (LV) | 48%[gg] | 46% | 2% | – | 4% | |||
| 50%[gh] | 45% | 1% | – | 3% | ||||
| Siena College/NYT Upshot | Sep 16–21, 2020 | 523 (LV) | ± 4.9% | 45% | 45% | 2% | 0%[gr] | 8%[aa] |
| University of Georgia/AJC | Sep 11–20, 2020 | 1,150 (LV) | ± 4% | 47% | 47% | 1% | – | 4% |
| Data for Progress (D) | Sep 14–19, 2020 | 800 (LV) | ± 3.5% | 45%[gs] | 45% | 1% | 0%[gt] | 8% |
| 46%[gu] | 46% | – | – | 8% | ||||
| GBAO Strategies/Warnock for Georgia[AA] | Sep 14–16, 2020 | 600 (LV) | ± 4% | 46% | 49% | – | – | – |
| Redfield & Wilton Strategies | Sep 12–16, 2020 | 800 (LV) | ± 3.46% | 46% | 45% | 2% | 1%[gp] | 6% |
| Morning Consult | Aug 29 – Sep 7, 2020 | 1,486 (LV) | ± (2%–4%) | 48%[gv] | 46% | – | – | – |
| Fabrizio Ward/Hart Research Associates/AARP | Aug 30 – Sep 5, 2020 | 800 (LV) | ± 3.5% | 46% | 47% | – | 1%[gw] | 6% |
| Opinion Insight/American Action Forum[J] | Aug 30 – Sep 2, 2020 | 800 (LV) | ± 3.46% | 46%[ai] | 47% | 2% | 1%[gx] | 4% |
| Landmark Communications/WSB | Aug 29–31, 2020 | 500 (LV) | ± 4.4% | 48% | 41% | 2% | – | 9% |
| SurveyMonkey/Tableau | Aug 1–31, 2020 | 2,772 (LV) | – | 49% | 49% | – | – | 2% |
| Morning Consult | Aug 21–30, 2020 | 1,392 (LV) | ± (2%–4%) | 46% | 49% | – | – | – |
| HarrisX/Matt Lieberman[AB] | Aug 20–30, 2020 | 1,616 (RV) | ± 2.4% | 46% | 52% | – | 2%[gy] | – |
| PPP/Fair Fight Action[AC] | Aug 24–25, 2020 | 782 (V) | ± 3.5% | 46% | 47% | – | – | 6% |
| Morning Consult | Aug 7–16, 2020 | 1,265 (LV) | ± (2%–4%) | 47% | 46% | – | – | – |
| Landmark Communications | Aug 14–15, 2020 | 500 (LV) | ± 4.4% | 48% | 45% | 4% | – | 3% |
| SurveyUSA | Aug 6–8, 2020 | 623 (LV) | ± 5.3% | 44% | 46% | – | 4%[gz] | 6% |
| YouGov/CBS | Jul 28–31, 2020 | 1,109 (LV) | ± 3.4% | 45% | 46% | – | 3%[ha] | 5% |
| HIT Strategies/DFER[AD] | Jul 23–31, 2020 | 400 (RV) | ± 4.9% | 40% | 44% | – | 6%[hb] | 10%[aa] |
| SurveyMonkey/Tableau | Jul 1–31, 2020 | 3,745 (LV) | – | 53% | 45% | – | – | 2% |
| Monmouth University | Jul 23–27, 2020 | 402 (RV) | ± 2% | 47% | 47% | 3% | – | 3% |
| 402 (LV) | 48%[gg] | 47% | 2% | – | 3% | |||
| 49%[gh] | 46% | 2% | – | 4% | ||||
| Morning Consult | Jul 17–26, 2020 | 1,337 (LV) | ± 2.7% | 46% | 47% | – | – | – |
| Public Policy Polling/AFSCME[F] | Jul 23–24, 2020 | 722 (V) | – | 45% | 46% | – | – | 9% |
| Trafalgar Group | Jul 15–18, 2020 | 1,023 (LV) | ± 3.0% | 50% | 43% | 2% | 2%[hc] | 2% |
| Spry Strategies/American Principles Project[AE] | Jul 11–16, 2020 | 700 (LV) | ± 3.7% | 49% | 46% | – | – | 5% |
| Garin-Hart-Yang/Jon Ossoff[Y] | Jul 9–15, 2020 | 800 (LV) | ± 3.5% | 43% | 47% | – | – | 10% |
| Gravis Marketing/OANN | Jul 2, 2020 | 513 (LV) | ± 4.3% | 48% | 45% | - | – | 8% |
| SurveyMonkey/Tableau | Jun 8–30, 2020 | 2,059 (LV) | – | 49% | 49% | – | – | 2% |
| Public Policy Polling/End Citizens United[AF] | Jun 25–26, 2020 | 734 (RV) | ± 3.6% | 45% | 49% | - | – | 6% |
| Fox News | Jun 20–23, 2020 | 1,013 (RV) | ± 3.0% | 45% | 47% | - | 4%[hd] | 5% |
| Public Policy Polling | Jun 12–13, 2020 | 661 (V) | ± 3.4% | 46% | 48% | - | – | 6% |
| TargetSmart | May 21–27, 2020 | 321 (RV) | ± 5.5% | 44% | 40% | - | 10%[he] | 6% |
| Morning Consult | May 17–26, 2020 | 1,396 (LV) | – | 49% | 47% | – | – | – |
| Civiqs/Daily Kos | May 16–18, 2020 | 1,339 (RV) | ± 3.1% | 47% | 48% | - | 3%[cv] | 2% |
| The Progress Campaign (D)[12] | May 6–15, 2020 | 2,893 (LV) | ± 2% | 47% | 47% | - | – | 6%[hf] |
| BK Strategies/Republican State Leadership Committee[AG] | May 11–13, 2020 | 700 (LV) | ± 3.7% | 48% | 46% | - | – | – |
| Public Opinion Strategies (R) | May 4–7, 2020 | 500 (LV) | ± 4.38% | 46% | 47% | - | – | 7%[hg] |
| Cygnal/David Ralston[13][AH] | Apr 25–27, 2020 | 591 (LV) | ± 4.0% | 45% | 44% | - | 7% | 5% |
| Battleground Connect/Doug Collins for Senate[AI] | Mar 31 – Apr 1, 2020 | 1,035 (LV) | ± 3.0% | 48% | 46% | - | – | 6% |
| The Progress Campaign (D) | Mar 12–21, 2020 | 3,042 (RV) | ± 4.5% | 49% | 47% | - | 4% | – |
| University of Georgia | Feb 24 – Mar 2, 2020 | 1,117 (LV) | ± 2.9% | 51% | 43% | - | 4% | 2% |
| Mason-Dixon | Dec 19–23, 2019 | 625 (RV) | ± 4.0% | 51% | 44% | - | – | 5% |
| SurveyUSA | Nov 15–18, 2019 | 1,303 (LV) | ± 3.2% | 43% | 47% | - | – | 10% |
| Climate Nexus | Nov 4–10, 2019 | 688 (LV) | – | 47% | 48% | - | – | 5% |
| University of Georgia | Oct 30 – Nov 8, 2019 | 1,028 (RV) | ± 3% | 43% | 51% | - | 3% | 4%[hh] |
| Zogby Analytics | Oct 28–30, 2019 | 550 (LV) | ± 4.2% | 44% | 46% | - | – | 11% |
Hawaii
Graphical summary
Graphs are unavailable due to technical issues. There is more info on Phabricator and on MediaWiki.org. |
Aggregate polls
| Source of poll aggregation |
Dates administered |
Dates updated |
Joe Biden Democratic |
Donald Trump Republican |
Other/ Undecided [a] |
Margin |
|---|---|---|---|---|---|---|
| 270 to Win | October 1–16, 2020 | November 2, 2020 | 63.5% | 30.5% | 5.9% | Biden +33.0 |
| FiveThirtyEight | until November 2, 2020 | November 3, 2020 | 64.3% | 30.0% | 5.7% | Biden +34.3 |
| Average | 63.8% | 30.6% | 5.6% | Biden +33.2 | ||
Polls
| Poll source | Date(s) administered |
Sample size[dk] |
Margin of error |
Donald Trump Republican |
Joe Biden Democratic |
Jo Jorgensen Libertarian |
Howie Hawkins Green |
Other | Undecided |
|---|---|---|---|---|---|---|---|---|---|
| SurveyMonkey/Axios | Oct 20 – Nov 2, 2020 | 688 (LV) | ± 5% | 31%[hi] | 67% | - | - | – | – |
| SurveyMonkey/Axios | Oct 1–28, 2020 | 1,263 (LV) | – | 34% | 63% | - | - | – | – |
| Mason-Dixon | Oct 12–14, 2020 | 625 (LV) | ± 4% | 29% | 58% | - | - | 5% | 8% |
| MRG Research/Civil Beat/HNN | Oct 2–7, 2020 | 988 (RV) | ± 3.1% | 28% | 61% | - | - | 4%[hj] | 7% |
| SurveyMonkey/Axios | Sep 1–30, 2020 | 474 (LV) | – | 33% | 66% | - | - | – | 1% |
| SurveyMonkey/Axios | Aug 1–31, 2020 | 362 (LV) | – | 37% | 61% | - | - | – | 2% |
| SurveyMonkey/Axios | Jul 1–31, 2020 | 356 (LV) | – | 37% | 62% | - | - | – | 2% |
| MRG Research | Jul 27–30, 2020 | 975 (RV) | ± 3.1% | 29% | 56% | - | - | 6%[hk] | 10% |
| SurveyMonkey/Axios | Jun 8–30, 2020 | 207 (LV) | – | 30% | 67% | - | - | – | 3% |
Indiana
Graphical summary
Graphs are unavailable due to technical issues. There is more info on Phabricator and on MediaWiki.org. |
Aggregate polls
| Source of poll aggregation |
Dates administered |
Dates updated |
Joe Biden Democratic |
Donald Trump Republican |
Other/ Undecided [a] |
Margin |
|---|---|---|---|---|---|---|
| 270 to Win | October 14 - November 2, 2020 | November 3, 2020 | 42.0% | 51.0% | 7.0% | Trump +9.0 |
| FiveThirtyEight | until November 2, 2020 | November 3, 2020 | 42.0% | 52.9% | 5.1% | Trump +10.8 |
Polls
| Poll source | Date(s) administered |
Sample size[dk] |
Margin of error |
Donald Trump Republican |
Joe Biden Democratic |
Jo Jorgensen Libertarian |
Other | Undecided |
|---|---|---|---|---|---|---|---|---|
| SurveyMonkey/Axios | Oct 20 – Nov 2, 2020 | 2,729 (LV) | ± 2.5% | 54%[hl] | 44% | – | – | – |
| Swayable Archived November 13, 2020, at the Wayback Machine | Oct 27 – Nov 1, 2020 | 264 (LV) | ± 7.8% | 55% | 43% | 2% | – | – |
| Morning Consult | Oct 22–31, 2020 | 1,147 (LV) | ± 3% | 53% | 42% | – | – | – |
| SurveyMonkey/Axios | Oct 1–28, 2020 | 4,734 (LV) | – | 55% | 43% | – | – | – |
| Swayable | Oct 23–26, 2020 | 301 (LV) | ± 7.4% | 53% | 42% | 5% | – | – |
| Ragnar Research (R) | Oct 18–21, 2020 | 529 (LV) | ± 4% | 48% | 40% | 5% | – | 7% |
| SurveyUSA/Election Twitter | Oct 10–13, 2020 | 527 (LV) | ± 5.2% | 49% | 42% | – | 3% | 6% |
| SurveyMonkey/Axios | Sep 1–30, 2020 | 2,367 (LV) | – | 53% | 45% | – | – | – |
| Change Research/IndyPolitics | Sep 3–7, 2020 | 1,033 (LV) | ± 3.1% | 53% | 39% | 5% | – | 3% |
| SurveyMonkey/Axios | Aug 1–31, 2020 | 1,672 (LV) | – | 55% | 43% | – | – | – |
| Morning Consult | Jul 24 – Aug 2, 2020[hm] | 900 (LV) | ± 3.5% | 55% | 38% | – | – | – |
| SurveyMonkey/Axios | Jul 1–31, 2020 | 2,175 (LV) | – | 56% | 43% | – | – | – |
| SurveyMonkey/Axios | Jun 8–30, 2020 | 929 (LV) | – | 57% | 40% | – | – | – |
| Victoria Research/Tallian for Attorney General[14][AJ] | May 21–23, 2020 | 894 (LV) | ± 3.3% | 49% | 39% | – | – | – |
| Indy Politics/Change Research | Apr 10–13, 2020 | 1,021 (LV) | ± 3.1% | 52% | 39% | – | 5% | 3% |
Iowa
Graphical summary
Graphs are unavailable due to technical issues. There is more info on Phabricator and on MediaWiki.org. |
Aggregate polls
| Source of poll aggregation |
Dates administered |
Dates updated |
Joe Biden Democratic |
Donald Trump Republican |
Other/ Undecided [a] |
Margin |
|---|---|---|---|---|---|---|
| 270 to Win | October 31 – November 2, 2020 | November 3, 2020 | 46.2% | 47.8% | 6.0% | Trump +1.6 |
| Real Clear Politics | October 23 – November 2, 2020 | November 3, 2020 | 45.6% | 47.6% | 6.8% | Trump +2.0 |
| FiveThirtyEight | until November 2, 2020 | November 3, 2020 | 46.3% | 47.6% | 6.1% | Trump +1.3 |
| Average | 46.0% | 47.7% | 6.3% | Trump +1.5 | ||
Polls
| Poll source | Date(s) administered |
Sample size[dk] |
Margin of error |
Donald Trump Republican |
Joe Biden Democratic |
Jo Jorgensen Libertarian |
Howie Hawkins Green |
Other | Undecided |
|---|---|---|---|---|---|---|---|---|---|
| Public Policy Polling | Nov 1–2, 2020 | 871 (V) | – | 48% | 49% | – | – | 2%[ah] | 1% |
| SurveyMonkey/Axios | Oct 20 – Nov 2, 2020 | 1,489 (LV) | ± 3.5% | 51%[hn] | 48% | – | – | – | – |
| Change Research | Oct 29 – Nov 1, 2020 | 1,084 (LV) | ± 3.2% | 47% | 47% | 3% | 0% | 2%[ho] | 1% |
| Civiqs/Daily Kos | Oct 29 – Nov 1, 2020 | 853 (LV) | ± 3.7% | 48% | 49% | – | – | 3%[hp] | 0% |
| Data for Progress | Oct 27 – Nov 1, 2020 | 951 (LV) | ± 3.2% | 49% | 47% | 3% | 1% | 1%[hq] | – |
| Emerson College | Oct 29–31, 2020 | 604 (LV) | ± 3.9% | 49%[ai] | 47% | – | – | 4% | 0% |
| InsiderAdvantage/Center for American Greatness Archived November 1, 2020, at the Wayback Machine[H] | October 30, 2020 | 400 (LV) | ± 4.9% | 48% | 46% | 1% | – | – | 6% |
| Selzer & Co./Des Moines Register | Oct 26–29, 2020 | 814 (LV) | ± 3.4% | 48% | 41% | – | – | 8%[hr] | 2%[hs] |
| SurveyMonkey/Axios | Oct 1–28, 2020 | 3,005 (LV) | ± 2.5% | 50% | 49% | – | – | – | 2% |
| Quinnipiac University | Oct 23–27, 2020 | 1,225 (LV) | ± 2.8% | 47% | 46% | – | – | 1%[ht] | 6% |
| RABA Research/WHO13 News | Oct 21–24, 2020 | 693 (LV) | ± 4% | 46% | 50% | – | – | 2%[ah] | 1% |
| Emerson College | Oct 19–21, 2020 | 435 (LV) | ± 4.7% | 48%[ai] | 48% | – | – | 4%[eu] | 0% |
| RMG Research/PoliticalIQ | Oct 15–21, 2020 | 800 (LV) | ± 3.5% | 47%[o] | 47% | – | – | 2%[ah] | 4% |
| 45%[hu] | 49% | – | – | 2%[ah] | 4% | ||||
| 49%[hv] | 48% | – | – | 2%[ah] | 4% | ||||
| Siena College/NYT Upshot | Oct 18–20, 2020 | 753 (LV) | ± 3.9% | 43% | 46% | 2% | 1% | 1%[z] | 7%[hw] |
| Insider Advantage/Center for American Greatness Archived October 21, 2020, at the Wayback Machine[H] | Oct 18–19, 2020 | 400 (LV) | ± 4.9% | 45% | 45% | 2% | – | – | 8% |
| Monmouth University | Oct 15–19, 2020 | 501 (RV) | ± 4.4% | 48% | 47% | 1% | 0%[hx] | 2%[hy] | 2% |
| 501 (LV)[gg] | 47% | 50% | – | – | – | – | |||
| 501 (LV)[gh] | 46% | 51% | – | – | – | – | |||
| David Binder Research/Focus on Rural America | Oct 10–13, 2020 | 200 (LV) | – | 50% | 44% | – | – | – | – |
| Data for Progress (D) | Oct 8–11, 2020 | 822 (LV) | ± 3.4% | 48% | 47% | 2% | 0% | – | 3% |
| YouGov/CBS | Oct 6–9, 2020 | 1,035 (LV) | ± 3.5% | 49% | 49% | – | – | 2%[hz] | 0% |
| Opinion Insight/American Action Forum[J] | Oct 5–8, 2020 | 800 (LV) | ± 3.46% | 46%[ai] | 47% | – | – | 3%[ia] | 4%[hw] |
| Civiqs/Daily Kos | Oct 3–6, 2020 | 756 (LV) | ± 3.9% | 47% | 48% | – | – | 4%[eu] | 1% |
| Quinnipiac University | Oct 1–5, 2020 | 1,205 (LV) | ± 2.8% | 45% | 50% | – | – | 2%[ah] | 3% |
| SurveyMonkey/Axios | Sep 1–30, 2020 | 1,276 (LV) | – | 52% | 46% | – | – | – | 2% |
| Data for Progress (D) | Sep 23–28, 2020 | 743 (LV) | ± 3.6% | 47%[o] | 44% | 1% | 1% | – | 6% |
| 50%[ib] | 45% | – | – | – | 5% | ||||
| Hart Research Associates/Human Rights Campaign[AK] | Sep 24–27, 2020 | 400 (LV) | ± 4.9% | 49% | 47% | – | – | – | – |
| RABA Research/WHO13 News | Sep 23–26, 2020 | 780 (LV) | ± 4% | 46% | 48% | – | – | 2%[ic] | 4% |
| Monmouth University | Sep 18–22, 2020 | 402 (RV) | ± 4.9% | 50% | 44% | 2% | 0% | 1%[id] | 2% |
| 402 (LV) | 49%[gg] | 46% | 2% | – | 2%[ie] | 2% | |||
| 49%[gh] | 46% | 2% | – | 2%[ie] | 2% | ||||
| Siena College/NYT Upshot | Sep 16–22, 2020 | 501 (LV) | ± 4.99% | 42% | 45% | 2% | 0% | 1%[z] | 10%[hw] |
| Selzer & Co./Des Moines Register | Sep 14–17, 2020 | 658 (LV) | ± 3.8% | 47% | 47% | – | – | 4%[eu] | 3% |
| Fabrizio Ward/Hart Research Associates/AARP | Aug 30 – Sep 5, 2020 | 800 (LV) | ± 3.5% | 47% | 45% | – | – | 1%[if] | 6% |
| Opinion Insight/American Action Forum[J] | Aug 30 – Sep 2, 2020 | 800 (LV) | ± 3.46% | 51%[ai] | 43% | 3% | 1% | – | 2% |
| SurveyMonkey/Axios | Aug 1–31, 2020 | 983 (LV) | – | 53% | 46% | – | – | – | 2% |
| Monmouth University | Jul 30 – Aug 3, 2020 | 401 (RV) | ± 4.9% | 48% | 45% | 3% | – | <1%[ig] | 3% |
| 401 (LV) | 48%[gg] | 46% | 2% | <1%[ih] | 3% | ||||
| 47%[gh] | 47% | 2% | 0%[ii] | 3% | |||||
| Data for Progress | Jul 24 – Aug 2, 2020 | 1,101 (LV) | – | 44%[o] | 42% | 3% | 1% | – | 10% |
| 46%[ib] | 45% | – | – | – | 9% | ||||
| David Binder Research/Focus on Rural America | Jul 30–31, 2020 | 200 (LV) | – | 43% | 49% | – | – | – | – |
| SurveyMonkey/Axios | Jul 1–31, 2020 | 1,095 (LV) | – | 54% | 45% | – | – | – | 1% |
| RMG Research | Jul 27–30, 2020 | 500 (RV) | ± 4.5% | 41% | 40% | – | – | 7% | 13% |
| Public Policy Polling/AFSCME[F] | Jul 23–24, 2020 | 1,118 (V) | – | 48% | 47% | – | – | – | 6% |
| Spry Strategies/American Principles Project[AL] | Jul 11–16, 2020 | 701 (LV) | ± 3.7% | 46% | 48% | – | – | – | 7% |
| SurveyMonkey/Axios | Jun 8–30, 2020 | 455 (LV) | – | 50% | 48% | – | – | – | 2% |
| Selzer/Des Moines Register | Jun 7–10, 2020 | 674 (LV) | ± 3.8% | 44% | 43% | – | – | 10%[ij] | 3% |
| Civiqs/Daily Kos | Jun 6–8, 2020 | 865 (RV) | ± 3.8% | 46% | 46% | – | – | 7%[ik] | 1% |
| Public Policy Polling/Emily's List Archived November 13, 2020, at the Wayback Machine[AM] | Jun 3–4, 2020 | 963 (V) | – | 48% | 47% | – | – | – | 5% |
| Public Policy Polling[15] | Apr 30 – May 1, 2020 | 1,222 (V) | ± 2.8% | 48% | 46% | – | – | – | 6% |
| GBAO Strategies/PLUS Paid Family Leave Archived May 16, 2020, at the Wayback Machine | Apr 13–16, 2020 | 500 (LV) | – | 48% | 45% | – | – | 1% | 6% |
| Selzer/Des Moines Register | Mar 2–5, 2020 | 667 (LV) | ± 3.8% | 51% | 41% | – | – | – | – |
| The New York Times/Siena College | Jan 20–23, 2020 | 1,689 (RV) | ± 2.8% | 46% | 44% | – | – | 5%[il] | 6% |
| Public Policy Polling | Dec 29–31, 2019 | 964 (V) | – | 49% | 46% | – | – | – | 5% |
| Emerson College Archived December 13, 2019, at the Wayback Machine | Dec 7–10, 2019 | 1,043 (RV) | ± 3% | 49% | 45% | – | – | – | 6% |
| NYT Upshot/Siena College | Oct 25–30, 2019 | 1,435 (RV) | ± 3.1% | 45% | 44% | – | – | 3% | 5% |
| Emerson College | Oct 13–16, 2019 | 888 (RV) | ± 3.2% | 51% | 49% | – | – | – | – |
| WPA Intelligence (R) | Apr 27–30, 2019 | 200 (LV) | ± 6.9% | 49% | 44% | – | – | – | 5% |
| Emerson College Archived May 20, 2020, at the Wayback Machine | Mar 21–24, 2019 | 707 (RV) | ± 3.6% | 47% | 53% | – | – | – | – |
| Emerson College | Jan 30 – Feb 2, 2019 | 831 (RV) | ± 3.4% | 49% | 51% | – | – | – | – |
Kansas
Graphical summary
Graphs are unavailable due to technical issues. There is more info on Phabricator and on MediaWiki.org. |
Aggregate polls
| Source of poll aggregation |
Dates administered |
Dates updated |
Joe Biden Democratic |
Donald Trump Republican |
Other/ Undecided [a] |
Margin |
|---|---|---|---|---|---|---|
| 270 to Win | October 17–22, 2020 | November 3, 2020 | 43.0% | 51.7% | 5.3% | Trump +8.7 |
| FiveThirtyEight | until November 2, 2020 | November 3, 2020 | 41.0% | 53.9% | 5.1% | Trump +12.9 |
| Average | 42.0% | 52.8% | 5.2% | Trump +10.8 | ||
Polls
| Poll source | Date(s) administered |
Sample size[dk] |
Margin of error |
Donald Trump Republican |
Joe Biden Democratic |
Jo Jorgensen Libertarian |
Other | Undecided |
|---|---|---|---|---|---|---|---|---|
| SurveyMonkey/Axios | Oct 20 – Nov 2, 2020 | 2,321 (LV) | ± 3% | 55%[im] | 44% | – | – | – |
| Data For Progress | Oct 27 – Nov 1, 2020 | 1,121 (LV) | ± 2.9% | 55% | 41% | 3% | 2%[in] | – |
| SurveyMonkey/Axios | Oct 1–28, 2020 | 3,442 (LV) | ± 2.5% | 51% | 47% | – | – | – |
| PPP/Protect Our Care[AN] | Oct 19–20, 2020 | 897 (V) | ± 3.3% | 54% | 42% | – | – | 4% |
| Siena College/NYT Upshot | Oct 18–20, 2020 | 755 (LV) | ± 4% | 48% | 41% | 4% | 2%[io] | 6%[ip] |
| co/efficient/Keep Kansas Great PAC[AO] | Oct 18–20, 2020 | 2,453 (LV) | ± 3.7% | 56% | 39% | 2% | – | 3% |
| Fort Hays State University | Sep 21 – Oct 1, 2020 | 306 (RV) | ± 4.8% | 52% | 38% | – | 11%[iq] | – |
| SurveyMonkey/Axios | Sep 1–30, 2020 | 1,135 (LV) | – | 52% | 47% | – | – | 1% |
| Civiqs/Daily Kos | Sep 26–29, 2020 | 677 (LV) | ± 4.5% | 52% | 42% | – | 4%[ir] | 1% |
| Data For Progress (D) | Sep 14–19, 2020 | 883 (LV) | ± 3.3% | 48%[is] | 42% | 3% | 1%[it] | 7% |
| 49%[iu] | 45% | – | – | 6% | ||||
| co/efficient/Keep Kansas Great PAC[AO] | Sep 15–16, 2020 | 794 (LV) | ± 3.5% | 53% | 41% | – | – | – |
| SurveyMonkey/Axios | Aug 1–31, 2020 | 922 (LV) | – | 54% | 45% | – | – | 1% |
| SurveyUSA | Aug 5–9, 2020 | 1,202 (LV) | ± 3.3% | 48% | 41% | – | 5%[iv] | 6% |
| Public Policy Polling[AP] | Aug 5–6, 2020 | 864 (V) | ± 3.3% | 50% | 43% | – | – | 7% |
| SurveyMonkey/Axios | Jul 1–31, 2020 | 1,295 (LV) | – | 51% | 47% | – | – | 2% |
| SurveyMonkey/Axios | Jun 8–30, 2020 | 466 (LV) | – | 53% | 45% | – | – | 2% |
| Civiqs/Daily Kos | May 30 – Jun 1, 2020 | 699 (RV) | ± 4.2% | 52% | 40% | – | 6%[iw] | 2% |
| The Progress Campaign (D) Archived May 14, 2020, at the Wayback Machine | Apr 15–22, 2020 | 1,632 (LV) | ± 4.7% | 51% | 41% | – | – | 8% |
| Public Policy Polling | Mar 10–11, 2020 | 1,567 (V) | – | 52% | 40% | – | – | 8% |
| DFM Research Archived February 10, 2020, at the Wayback Machine | Jan 30 – Feb 6, 2020 | 600 (A) | ±4% | 51% | 43% | – | 3%[cv] | 3% |
Kentucky
Graphical summary
Graphs are unavailable due to technical issues. There is more info on Phabricator and on MediaWiki.org. |
Aggregate polls
| Source of poll aggregation |
Dates administered |
Dates updated |
Joe Biden Democratic |
Donald Trump Republican |
Other/ Undecided [a] |
Margin |
|---|---|---|---|---|---|---|
| 270 to Win | October 17–20, 2020 | November 3, 2020 | 40.0% | 57.0% | 3.0% | Trump +17.0 |
| FiveThirtyEight | until November 2, 2020 | November 3, 2020 | 39.9% | 55.6% | 4.5% | Trump +15.7 |
| Average | 40.0% | 56.3% | 3.7% | Trump +16.4 | ||
Polls
| Poll source | Date(s) administered |
Sample size[dk] |
Margin of error |
Donald Trump Republican |
Joe Biden Democratic |
Jo Jorgensen Libertarian |
Other | Undecided |
|---|---|---|---|---|---|---|---|---|
| SurveyMonkey/Axios | Oct 20 – Nov 2, 2020 | 2,009 (LV) | ± 3% | 59%[ix] | 40% | - | – | – |
| Swayable Archived November 27, 2020, at the Wayback Machine | Oct 23 – Nov 1, 2020 | 383 (LV) | ± 7.4% | 55% | 42% | 4% | – | – |
| Bluegrass Community & Technical College Archived October 30, 2020, at the Wayback Machine | Oct 12–28, 2020 | 250 (RV) | – | 52% | 39% | – | – | 9% |
| SurveyMonkey/Axios | Oct 1–28, 2020 | 3,621 (LV) | – | 56% | 42% | – | – | – |
| Mason-Dixon | Oct 12–15, 2020 | 625 (LV) | ± 4% | 56% | 39% | - | 1% | 4% |
| SurveyMonkey/Axios | Sep 1–30, 2020 | 1,479 (LV) | – | 59% | 39% | - | – | 1% |
| Data for Progress (D) | Sep 14–19, 2020 | 807 (LV) | ± 3.5% | 55%[iy] | 35% | 1% | 1%[iz] | 8% |
| 56%[ja] | 38% | - | – | 6% | ||||
| Quinnipiac University | Sep 10–14, 2020 | 1,164 (LV) | ± 2.9% | 58% | 38% | - | 1%[jb] | 4% |
| SurveyMonkey/Axios | Aug 1–31, 2020 | 1,231 (LV) | – | 60% | 38% | - | – | 2% |
| Quinnipiac University Archived August 7, 2020, at the Wayback Machine | Jul 30 – Aug 3, 2020 | 909 (RV) | ± 3.3% | 50% | 41% | - | 4%[jc] | 5% |
| Morning Consult | Jul 24 – Aug 2, 2020 | 793 (LV) | ± 3.0% | 59% | 35% | - | 2%[jd] | 4% |
| SurveyMonkey/Axios | Jul 1–31, 2020 | 1,709 (LV) | – | 62% | 37% | - | – | 1% |
| Bluegrass Data/Ditch Mitch Fund Archived August 9, 2020, at the Wayback Machine[AQ] | Jul 25–29, 2020 | 3,020 (RV) | ± 2.0% | 52% | 45% | - | – | – |
| Spry Strategies/American Principles Project[AR] | Jul 11–16, 2020 | 600 (LV) | ± 3.7% | 60% | 34% | - | – | 6% |
| Garin-Hart-Yang/Amy McGrath Archived July 16, 2020, at the Wayback Machine[AS] | Jul 7–12, 2020 | 800 (LV) | ± 3.5% | 53% | 41% | - | – | – |
| SurveyMonkey/Axios | Jun 8–30, 2020 | 596 (LV) | – | 60% | 38% | - | – | 2% |
| Garin-Hart-Yang/Amy McGrath Archived July 16, 2020, at the Wayback Machine[AS] | Jun 2020 | – (V)[bo] | – | 54% | 39% | - | – | – |
| Civiqs/Data for Progress | Jun 13–15, 2020 | 898 (RV) | ± 3.8% | 57% | 37% | - | 5%[je] | 1% |
| Garin-Hart-Yang/Amy McGrath Archived July 16, 2020, at the Wayback Machine[AS] | May 2020 | – (V)[bo] | – | 57% | 36% | - | – | – |
| RMG Research/U.S. Term Limits[AT] | May 21–24, 2020 | 500 (RV) | ± 4.5% | 53% | 36% | - | 6%[jf] | 5% |
| Public Policy Polling | May 14–15, 2020 | 1,104 (V) | – | 55% | 39% | - | 5%[je] | 2% |
| Bluegrass Data/Ditch Mitch Fund Archived August 9, 2020, at the Wayback Machine[AU] | Apr 7–12, 2020[jg] | 4,000 (RV) | – | 55% | 34% | - | – | – |
| Fabrizio Ward/AARP | Jul 29–31, 2019 | 600 (LV) | ± 4.0% | 53% | 41% | - | – | 4% |
| Gravis Marketing | Jun 11–12, 2019 | 741 (LV) | ± 3.6% | 57% | 37% | - | – | 6% |
Maine
Graphical summary (statewide)
Graphs are unavailable due to technical issues. There is more info on Phabricator and on MediaWiki.org. |
Aggregate polls
| Source of poll aggregation |
Dates administered |
Dates updated |
Joe Biden Democratic |
Donald Trump Republican |
Other/ Undecided [a] |
Margin |
|---|---|---|---|---|---|---|
| 270 to Win | October 6 – November 1, 2020 | November 3, 2020 | 51.8% | 40.2% | 8.0% | Biden +11.6 |
| FiveThirtyEight | until November 2, 2020 | November 3, 2020 | 53.3% | 40.3% | 6.4% | Biden +13.0 |
| Average | 53.1% | 40.3% | 7.2% | Biden +12.3 | ||
Statewide polls
| Poll source | Date(s) administered |
Sample size[dk] |
Margin of error |
Donald Trump Republican |
Joe Biden Democratic |
Jo Jorgensen Libertarian |
Howie Hawkins Green |
Other | Undecided |
|---|---|---|---|---|---|---|---|---|---|
| Change Research | Oct 29 – Nov 2, 2020 | 1,024 (LV) | ± 3.5% | 40% | 52% | 4% | 2% | 1%[jh] | 1% |
| SurveyMonkey/Axios | Oct 20 – Nov 2, 2020 | 1,274 (LV) | ± 4% | 42%[ji] | 56% | – | – | – | – |
| Emerson College | Oct 29–31, 2020 | 611 (LV) | ± 3.9% | 43%[jj] | 54% | – | – | 2%[jk] | – |
| SurveyMonkey/Axios | Oct 1–28, 2020 | 1,995 (LV) | – | 43% | 56% | – | – | – | – |
| SurveyUSA/FairVote | Oct 23–27, 2020 | 1,007 (LV) | ± 3.7% | 40%[o] | 53% | 2% | 2% | 1%[jl] | 2% |
| 42%[jm] | 55% | – | – | 1%[jn] | 2% | ||||
| Colby College | Oct 21–25, 2020 | 879 (LV) | ± 3.3% | 38% | 51% | – | – | 4%[jo] | 8% |
| Pan Atlantic Research | Oct 2–6, 2020 | 600 (LV) | ± 4.5% | 40% | 50% | – | – | 6%[jp] | 4% |
| Critical Insights/Digital Research/Bangor Daily News | Sep 25 – Oct 4, 2020 | 466 (LV) | ± 4.4% | 40%[o] | 51% | 3% | 1% | 2%[jq] | 3% |
| 40%[jr] | 52% | – | – | 5%[js] | 3% | ||||
| SurveyMonkey/Axios | Sep 1–30, 2020 | 729 (LV) | – | 38% | 60% | – | – | – | 2% |
| Data for Progress (D) | Sep 23–28, 2020 | 718 (LV) | ± 3.7% | 39%[o] | 53% | 2% | 1% | – | 5% |
| 41%[jt] | 55% | – | – | – | 4% | ||||
| Colby College | Sep 17–23, 2020 | 847 (LV) | ± 3.4% | 39% | 50% | – | – | 4%[ju] | 6% |
| Suffolk University/Boston Globe | Sep 17–20, 2020 | 500 (LV) | ± 4.4% | 39%[o] | 51% | 1% | 0% | 1%[jv] | 7% |
| 39%[jm] | 51% | – | – | 2%[jw] | 8% | ||||
| Siena College/NYT Upshot | Sep 11–16, 2020 | 663 (LV) | ± 5.1% | 38%[jx] | 55% | 0% | 0% | 1%[jy] | 6%[jz] |
| Quinnipiac University | Sep 10–14, 2020 | 1,183 (LV) | ± 2.9% | 38% | 59% | – | – | 0%[ka] | 3% |
| Fabrizio Ward/Hart Research Associates/AARP | Aug 30 – Sep 5, 2020 | 800 (LV) | ± 3.5% | 40% | 54% | – | – | 1%[kb] | 5% |
| SurveyMonkey/Axios | Aug 1–31, 2020 | 502 (LV) | – | 37% | 61% | – | – | – | 1% |
| Critical Insights/Digital Research/Bangor Daily News | Jul 28 – Aug 9, 2020 | 453 (LV) | – | 38% | 45% | – | – | 11%[kc] | 6% |
| Quinnipiac University Archived August 7, 2020, at the Wayback Machine | Jul 30 – Aug 3, 2020 | 805 (RV) | ± 3.7% | 37% | 52% | – | – | 6%[kd] | 4% |
| RMG Research | Jul 27 – Aug 2, 2020 | 500 (RV) | ± 4.5% | 39% | 50% | – | – | 7%[ke] | 4% |
| Data for Progress | Jul 24 – Aug 2, 2020 | 866 (LV) | – | 42%[o] | 49% | 1% | 1% | – | 7% |
| 43%[kf] | 53% | – | – | – | 4% | ||||
| SurveyMonkey/Axios | Jul 1–31, 2020 | 733 (LV) | – | 41% | 57% | – | – | – | 1% |
| Public Policy Polling/AFSCME[F] | Jul 23–24, 2020 | 962 (V) | – | 42% | 53% | – | – | – | 5% |
| Colby College/SocialSphere | Jul 18–24, 2020 | 888 (RV) | ± 3.9% | 38% | 50% | – | – | 5%[kg] | 7% |
| Public Policy Polling | Jul 2–3, 2020 | 1,022 (V) | ± 3.1% | 42% | 53% | – | – | – | 5% |
| SurveyMonkey/Axios | Jun 8–30, 2020 | 202 (LV) | – | 46% | 51% | – | – | – | 3% |
| Public Policy Polling | Mar 2–3, 2020 | 872 (V) | ± 3.3% | 42% | 52% | – | – | – | 6% |
| Public Policy Polling | Oct 11–13, 2019 | 939 (LV) | ± 3.2% | 42% | 54% | – | – | – | 4% |
| Fabrizio Ward/AARP | Jul 29–31, 2019 | 600 (LV) | ± 4.0% | 44% | 50% | – | – | – | 5% |
| Gravis Marketing | Jun 24, 2019 | 767 (RV) | ± 3.5% | 46% | 54% | – | – | – | – |
Maryland
Graphical summary
Graphs are unavailable due to technical issues. There is more info on Phabricator and on MediaWiki.org. |
Aggregate polls
| Source of poll aggregation |
Dates administered |
Dates updated |
Joe Biden Democratic |
Donald Trump Republican |
Other/ Undecided [a] |
Margin |
|---|---|---|---|---|---|---|
| 270 to Win | October 7–26 2020 | November 3, 2020 | 60.0% | 31.7% | 8.3% | Biden +28.3 |
| Real Clear Politics | September 4 – October 24, 2020 | November 3, 2020 | 60.3% | 31.0% | 8.7% | Biden +29.3 |
| FiveThirtyEight | until November 2, 2020 | November 3, 2020 | 63.1% | 31.6% | 5.3% | Biden +31.4 |
| Average | 61.1% | 31.4% | 7.4% | Biden +29.7 | ||
Polls
| Poll source | Date(s) administered |
Sample size[dk] |
Margin of error |
Donald Trump Republican |
Joe Biden Democratic |
Jo Jorgensen Libertarian |
Howie Hawkins Green |
Other | Undecided |
|---|---|---|---|---|---|---|---|---|---|
| SurveyMonkey/Axios | Oct 20 – Nov 2, 2020 | 3,216 (LV) | ± 2.5% | 31%[kh] | 66% | – | – | – | – |
| Swayable Archived November 27, 2020, at the Wayback Machine | Oct 23 – Nov 1, 2020 | 503 (LV) | ± 5.7% | 31% | 67% | 2% | 0% | – | – |
| SurveyMonkey/Axios | Oct 1–28, 2020 | 5,820 (LV) | – | 32% | 66% | – | – | – | – |
| Gonzalez Maryland Poll | Oct 19–24, 2020 | 820 (RV) | ± 3.5% | 33% | 58% | – | – | 3%[cv] | 6% |
| Goucher College | Sep 30 – Oct 4, 2020 | 776 (LV) | ± 3.5% | 30% | 61% | 2% | 2% | 3%[ki] | 2% |
| Change Research/Our Voice Maryland | Sep 29 – Oct 1, 2020 | 650 (V) | ± 4.55% | 32% | 61% | – | – | – | – |
| SurveyMonkey/Axios | Sep 1–30, 2020 | 2,364 (LV) | – | 31% | 67% | – | – | – | 2% |
| OpinionWorks | Sep 4–11, 2020 | 753 (LV) | – | 30% | 62% | – | – | 3%[cv] | 5% |
| SurveyMonkey/Axios | Aug 1–31, 2020 | 1,813 (LV) | – | 31% | 66% | – | – | – | 3% |
| SurveyMonkey/Axios | Jul 1–31, 2020 | 1,911 (LV) | – | 32% | 66% | – | – | – | 2% |
| SurveyMonkey/Axios | Jun 8–30, 2020 | 1,175 (LV) | – | 34% | 64% | – | – | – | 2% |
| Gonzalez Maryland Poll | May 19–23, 2020 | 810 (LV) | ± 3.5% | 31% | 59% | – | – | – | 6% |
| Goucher College | Feb 13–19, 2020 | 718 (LV) | ± 3.6% | 35% | 60% | – | – | 1%[kj] | 4%[kk] |
Massachusetts
Graphical summary
Graphs are unavailable due to technical issues. There is more info on Phabricator and on MediaWiki.org. |
Aggregate polls
| Source of poll aggregation |
Dates administered |
Dates updated |
Joe Biden Democratic |
Donald Trump Republican |
Other/ Undecided [a] |
Margin |
|---|---|---|---|---|---|---|
| 270 to Win | October 17 – November 2, 2020 | November 3, 2020 | 65.0% | 28.7% | 6.3% | Biden +36.3 |
| RealClearPolitics | July 31 – August 27, 2020 | September 15, 2020 | 64.0% | 28.3% | 7.7% | Biden +35.7 |
| FiveThirtyEight | until November 2, 2020 | November 3, 2020 | 64.6% | 28.9% | 6.5% | Biden +35.8 |
| Average | 64.5% | 28.6% | 6.8% | Biden +35.9 | ||
- Polls
| Poll source | Date(s) administered |
Sample size[dk] |
Margin of error |
Donald Trump Republican |
Joe Biden Democratic |
Jo Jorgensen Libertarian |
Howie Hawkins Green |
Other | Undecided |
|---|---|---|---|---|---|---|---|---|---|
| MassInc | Oct 23–30, 2020 | 929 (LV) | – | 28% | 62% | - | - | 8%[kl] | 2% |
| SurveyMonkey/Axios | Oct 1–28, 2020 | 5,848 (LV) | – | 28% | 70% | - | - | – | – |
| YouGov/UMass Amherst | Oct 14–21, 2020 | 713 (LV) | – | 29% | 64% | - | - | 3%[km] | 3% |
| SurveyMonkey/Axios | Sep 1–30, 2020 | 2,655 (LV) | – | 32% | 66% | - | - | – | 2% |
| SurveyMonkey/Axios | Aug 1–31, 2020 | 2,286 (LV) | – | 29% | 69% | - | - | – | 2% |
| Emerson College/WHDH | Aug 25–27, 2020 | 763 (LV) | ± 3.5% | 31% | 69% | - | - | – | – |
| MassINC/WBUR | Aug 6–9, 2020 | 501 (LV) | ± 4.4% | 27% | 63% | - | - | 5%[kn] | 4% |
| UMass/YouGov | Jul 31 – Aug 7, 2020 | 500 (RV) | ± 5.9% | 28% | 61% | - | - | – | – |
| SurveyMonkey/Axios | Jul 1–31, 2020 | 2,509 (LV) | – | 26% | 72% | - | - | – | 2% |
| MassINC | Jul 17–20, 2020 | 797 (RV) | – | 23% | 55% | - | - | 10%[ko] | 12% |
| SurveyMonkey/Axios | Jun 8–30, 2020 | 1,091 (LV) | – | 27% | 71% | - | - | – | 2% |
| Emerson College/7 News | May 4–5, 2020 | 740 (RV) | ± 3.5% | 33%[kp] | 67% | - | - | – | – |
| University of Massachusetts Lowell/YouGov | Apr 27 – May 1, 2020 | 1,000 (RV) | ± 3.6% | 30% | 58% | - | - | 7%[kq] | 4% |
| Emerson College Archived April 20, 2019, at the Wayback Machine | Apr 4–7, 2019 | 761 (RV) | ± 3.5% | 31% | 69% | - | - | – | – |
Michigan
Graphical summary
Graphs are unavailable due to technical issues. There is more info on Phabricator and on MediaWiki.org. |
Aggregate polls
| Source of poll aggregation |
Dates administered |
Dates updated |
Joe Biden Democratic |
Donald Trump Republican |
Other/ Undecided [a] |
Margin |
|---|---|---|---|---|---|---|
| 270 to Win | October 22 – November 2, 2020 | November 3, 2020 | 49.9% | 44.4% | 5.7% | Biden +5.5 |
| Real Clear Politics | October 29 – November 1, 2020 | November 3, 2020 | 50.0% | 45.8% | 4.2% | Biden +4.2 |
| FiveThirtyEight | until November 1, 2020 | November 3, 2020 | 51.2% | 43.2% | 5.6% | Biden +7.9 |
| Average | 50.4% | 44.5% | 5.1% | Biden +5.9 | ||
2020 polls
| Poll source | Date(s) administered |
Sample size[dk] |
Margin of error |
Donald Trump Republican |
Joe Biden Democratic |
Jo Jorgensen Libertarian |
Howie Hawkins Green |
Other | Undecided |
|---|---|---|---|---|---|---|---|---|---|
| SurveyMonkey/Axios | Oct 20 – Nov 2 | 4,549 (LV) | ± 2% | 46%[kr] | 52% | - | - | – | – |
| Research Co. | Oct 31 – Nov 1 | 450 (LV) | ± 4.6% | 43% | 50% | - | - | 2%[ah] | 5% |
| Change Research/CNBC | Oct 29 – Nov 1 | 383 (LV) | ± 5.01% | 44% | 51% | 3% | 1% | – | 1% |
| Swayable Archived November 13, 2020, at the Wayback Machine | Oct 27 – Nov 1 | 413 (LV) | ± 6.5% | 45% | 54% | 1% | 0% | – | – |
| Ipsos/Reuters | Oct 27 – Nov 1 | 654 (LV) | ± 4.4% | 43%[o] | 53% | 1% | 0% | 2%[ks] | – |
| 42%[kt] | 52% | - | - | 3%[af] | 3% | ||||
| 45%[ku] | 53% | - | - | 2%[kv] | – | ||||
| Trafalgar Group | Oct 30–31 | 1,033 (LV) | ± 2.97% | 48% | 46% | 2% | - | 1% | 3% |
| AtlasIntel | Oct 30–31 | 686 (LV) | ± 4% | 46% | 48% | - | - | 6% | – |
| Insider Advantage/Center for American Greatness[H] | Oct 30–31 | 500 (LV) | ± 4.4% | 47% | 49% | 2% | - | – | 3% |
| Morning Consult | Oct 22–31 | 1,736 (LV) | ± 2.0% | 44.5% | 52% | - | - | – | – |
| Emerson College | Oct 29–30 | 700 (LV) | ± 3.4% | 45%[ai] | 52% | - | - | 3%[cv] | – |
| Public Policy Polling/Progress Michigan[AV] | Oct 29–30 | 745 (V) | ± 3.6% | 44% | 54% | 1% | 0% | – | 1% |
| Targoz Market Research/PollSmart | Oct 25–30 | 993 (LV) | – | 39% | 53% | - | - | 8%[kw] | – |
| CNN/SSRS Archived October 31, 2020, at the Wayback Machine | Oct 23–30 | 907 (LV) | ± 3.8% | 41% | 53% | 2% | 1% | 1%[kx] | 2% |
| Mitchell Research (R)/MIRS | Oct 29 | 817 (LV) | ± 3.43% | 45% | 52% | 1% | 1% | 0%[ky] | 0% |
| RMG Research/PoliticalIQ | Oct 27–29 | 800 (LV) | ± 3.5% | 44%[o] | 51% | - | - | 3% | 2% |
| 42%[dy] | 53% | - | - | 3% | 2% | ||||
| 45%[dz] | 50% | - | - | 3% | 2% | ||||
| Redfield & Wilton Strategies | Oct 26–29 | 1,212 (LV) | – | 41% | 54% | 1% | 0% | 1% | 4% |
| EPIC-MRA | Oct 25–28 | 600 (LV) | ± 4% | 41% | 48% | - | - | 5%[kz] | 6%[dx] |
| Trafalgar Group | Oct 25–28 | 1,058 (LV) | ± 2.93% | 49% | 47% | 2% | - | 1%[dn] | 1% |
| Kiaer Research | Oct 21–28 | 669 (LV) | ± 5.6% | 41% | 54% | - | - | 2%[la] | 4% |
| SurveyMonkey/Axios | Oct 1–28, 2020 | 7,541 (LV) | – | 45% | 53% | - | - | – | – |
| Mitchell Research (R)/MIRS Archived October 29, 2020, at the Wayback Machine | Oct 25–27 | 759 (LV) | ± 3.56% | 42% | 52% | 3% | 0% | 0%[lb] | 2% |
| Swayable | Oct 23–26, 2020 | 394 (LV) | ± 6.7% | 40% | 59% | 2% | 0% | – | – |
| Siena College/NYT Upshot | Oct 23–26 | 856 (LV) | ± 3.8% | 41% | 49% | 2% | 1% | 0%[lc] | 6%[dx] |
| Ipsos/Reuters | Oct 20–26 | 652 (LV) | ± 4.4% | 43%[o] | 53% | 1% | 0% | 2%[ks] | – |
| 43%[kt] | 52% | - | - | 3%[af] | 3% | ||||
| Wick Surveys | Oct 24–25 | 1,000 (LV) | ± 3.1% | 48% | 48% | - | - | – | – |
| Glengariff Group/Detroit News | Oct 23–25 | 600 (LV) | ± 4% | 42% | 49% | - | - | 2%[ld] | 4% |
| ABC/Washington Post | Oct 20–25 | 789 (LV) | ± 4% | 44% | 51% | 3% | 0% | 0%[le] | 1% |
| Gravis Marketing | Oct 24 | 679 (LV) | ± 3.8% | 42% | 55% | - | - | – | 3% |
| Public Policy Polling/American Bridge PAC[AW] | Oct 21–22 | 804 (V) | – | 43% | 50% | - | - | – | 6% |
| YouGov/University of Wisconsin-Madison | Oct 13–21 | 681 (LV) | ± 4.2% | 42% | 52% | - | - | 5%[lf] | – |
| Citizen Data | Oct 17–20 | 1,000 (LV) | ± 3.1% | 41% | 50% | 1% | 0% | 1% | 7% |
| Fox News | Oct 17–20 | 1,032 (LV) | ± 3.0% | 40% | 52% | 3% | 0% | 2%[lg] | 3% |
| Ipsos/Reuters | Oct 14–20 | 686 (LV) | ± 4.3% | 44%[o] | 52% | 2% | 0% | 2%[ks] | – |
| 44%[kt] | 51% | - | - | 3%[af] | 2% | ||||
| Morning Consult | Oct 11–20 | 1,717 (LV) | ± 2.4% | 44% | 52% | - | - | – | – |
| Change Research/CNBC | Oct 16–19 | 718 (LV)[al] | – | 44% | 51% | - | - | – | – |
| EPIC-MRA | Oct 15–19 | 600 (LV) | ± 4% | 39% | 48% | - | - | 5%[lh] | 8%[dx] |
| Mitchell Research (R)/MIRS | Oct 18 | 900 (LV) | ± 3.27% | 41% | 51% | 3% | 1% | 1%[dn] | 3% |
| Trafalgar Group/Restoration PAC[AX] | Oct 15–18 | 1,034 (LV) | ± 2.97% | 47% | 45% | 3% | 2% | 2%[ah] | 2% |
| Data For Progress | Oct 15–18 | 830 (LV) | ± 3.4% | 45% | 50% | 2% | 0% | – | 3% |
| Zia Poll/Painter Communications/MIRS News | Oct 11–18 | 2,851 (LV) | ± 2.5% | 49% | 45% | - | - | 2% | 3% |
| HarrisX/The Hill | Oct 12–15 | 1,289 (LV) | – | 43% | 54% | - | - | – | – |
| Trafalgar Group | Oct 11–14 | 1,025 (LV) | ± 2.97% | 47% | 46% | 3% | 2% | 2%[ah] | 2% |
| Redfield & Wilton Strategies | Oct 10–13 | 972 (LV) | – | 42%[al] | 51% | 1% | 0% | – | – |
| RMG Research/PoliticalIQ | Oct 8–13 | 800 (LV) | – | 42%[o] | 48% | 2% | 1% | 1% | 5% |
| 39%[dy] | 51% | 2% | 1% | 1% | 5% | ||||
| 44%[dz] | 46% | 2% | 1% | 1% | 5% | ||||
| Ipsos/Reuters | Oct 7–13 | 620 (LV) | ± 4.5% | 44%[o] | 51% | 2% | 1% | 2%[li] | – |
| 43%[kt] | 51% | - | - | 3%[af] | 2% | ||||
| EPIC-MRA/Detroit Free Press | Oct 8–12 | 600 (LV) | ± 4% | 39% | 48% | - | - | 4%[lj] | 9%[dx] |
| Civiqs/Rust Belt Rising[AY] | Oct 8–11 | 543 (LV) | ± 4.6% | 43% | 52% | - | - | 4%[lk] | 2% |
| Siena College/NYT Upshot | Oct 6–11 | 614 (LV) | ± 4.6% | 40% | 48% | 1% | 1% | 1%[ll] | 8%[dx] |
| Morning Consult | Oct 2–11 | 1,710 (LV) | ± 2.4% | 44% | 51% | - | - | – | – |
| Redfield & Wilton Strategies | Oct 9–10 | 827 (LV) | – | 41%[al] | 51% | 2% | 1% | – | – |
| YouGov/CBS | Oct 6–9 | 1,190 (LV) | ± 3.3% | 46% | 52% | - | - | 2%[lm] | 0% |
| Baldwin Wallace University | Sep 30 – Oct 8 | 1,134 (LV) | ± 3.2% | 43% | 50% | 1% | 1% | 0%[ln] | 4% |
| Emerson College | Oct 6–7 | 716 (LV) | ± 3.6% | 43%[ai] | 54% | - | - | 2%[ah] | – |
| Redfield & Wilton Strategies | Oct 4–6 | 700 (LV) | ± 3.7% | 42% | 50% | 1% | 0% | 1%[aw] | 6% |
| Opinion Insight/American Action Forum[J] | Oct 3–6 | 800 (LV) | ± 3.46% | 44%[ai] | 52% | - | - | 2% | 3% |
| Ipsos/Reuters | Sep 29 – Oct 6 | 709 (LV) | ± 4.2% | 43% | 51% | - | - | 2%[r] | 3% |
| Change Research/CNBC | Oct 2–4 | 676 (LV) | – | 43% | 51% | - | - | – | – |
| Glengariff Group/Detroit News | Sep 30 – Oct 3 | 600 (LV) | ± 4% | 39% | 48% | - | - | 5%[lo] | 7% |
| Public Policy Polling/Progress Michigan[AV] | Sep 30 – Oct 1 | 746 (V) | – | 44% | 50% | 2% | 1% | – | 3% |
| SurveyMonkey/Axios | Sep 1–30 | 3,297 (LV) | – | 44% | 53% | - | - | – | 3% |
| Trafalgar Group/Restoration PAC[AX] | Sep 26–28 | 1,042 (LV) | ± 2.95% | 47% | 49% | 2% | 0% | 1%[dn] | 2% |
| Redfield & Wilton Strategies | Sep 23–26 | 785 (LV) | ± 3.5% | 42% | 51% | 1% | 0% | 0%[lp] | 6% |
| Marist College/NBC | Sep 19–23 | 799 (LV) | ± 4.3% | 44% | 52% | - | - | 1% | 3% |
| ALG Research/Committee to Protect Medicare[AZ] | Sep 17–23 | 800 (LV) | ± 3.5% | 44% | 52% | - | - | – | – |
| Trafalgar Group | Sep 20–22 | 1,015 (LV) | ± 2.99% | 46.7% | 46.0% | 2.1% | 0.8% | 1.2%[lq] | 3.2% |
| Baldwin Wallace University | Sep 9–22 | 1,001 (LV) | ± 3.6% | 42% | 50% | 1% | 0% | 1%[lr] | 6% |
| YouGov/UW-Madison Elections Research Center/Wisconsin State Journal |
Sep 10–21 | 641 (LV) | – | 45% | 51% | - | - | – | – |
| Change Research/CNBC | Sep 18–20 | 568 (LV) | – | 43% | 51% | - | - | – | – |
| Hart Research Associates/Human Rights Campaign[permanent dead link][BA] | Sep 17–19 | 400 (LV) | ± 4.9% | 45% | 50% | - | - | – | – |
| Data for Progress (D) | Sep 14–19 | 455 (LV) | ± 4.6% | 42%[o] | 48% | 1% | 0% | – | 9% |
| 44%[ls] | 50% | - | - | – | 6% | ||||
| MRG | Sep 14–19 | 600 (LV) | ± 4% | 41% | 46% | - | - | 8%[lt] | 5% |
| Ipsos/Reuters | Sep 11–16 | 637 (LV) | ± 4.4% | 44% | 49% | - | - | 2%[r] | 4% |
| Civiqs/Rust Belt Rising[AY] | Sep 11–15 | 517 (RV) | – | 42% | 53% | - | - | 3%[cv] | 1% |
| Redfield & Wilton Strategies | Sep 12–14 | 930 (LV) | ± 3.21% | 39% | 49% | 2% | 1% | 0%[lp] | 9% |
| EPIC-MRA | Sep 10–15 | 600 (LV) | ± 4% | 40% | 48% | - | - | 5%[lh] | 7%[dx] |
| Benenson Strategy Group/GS Strategy Group/AARP | Aug 28 – Sep 8 | 1,600 (LV) | ± 2.5% | 43% | 50% | - | - | 1%[lu] | 5% |
| Morning Consult | Aug 29 – Sep 7 | 1,455 (LV) | ± (2%–4%) | 42%[lv] | 52% | - | - | – | – |
| Change Research/CNBC | Sep 4–6 | 876 (LV) | – | 43% | 49% | - | - | 7%[lw] | – |
| Pulse Opinion Research/Rasmussen Reports[16] | Sep 2–3 | 1,000 (LV) | ± 3% | 44%[ai] | 53% | - | - | 3%[lx] | – |
| Glengariff Group | Sep 1–3 | 600 (LV) | ± 4% | 42% | 47% | - | - | 4%[ly] | 7% |
| Redfield & Wilton Strategies | Aug 30 – Sep 3 | 967 (LV) | ± 3.15% | 40% | 51% | 1% | 0% | 1%[aw] | 7% |
| Opinion Insight/American Action Forum[J] | Aug 30 – Sep 2 | 802 (LV) | ± 3.46% | 44%[ai] | 51% | 2% | 1% | 0%[lz] | 3% |
| SurveyMonkey/Axios | Aug 1–31 | 2,962 (LV) | – | 48% | 49% | - | - | – | 3% |
| Morning Consult | Aug 21–30 | 1,424 (LV) | ± (2%–4%) | 42% | 52% | - | - | – | – |
| Public Policy Polling/Progress Michigan[AV] | Aug 28–29 | 897 (V) | – | 44% | 48% | 3% | 1% | – | 3% |
| Change Research/CNBC | Aug 21–23 | 809 (LV) | – | 44% | 50% | - | - | – | – |
| Trafalgar Group | Aug 14–23 | 1,048 (LV) | ± 2.98% | 47% | 45% | 3% | - | 1%[ma] | 4% |
| Redfield and Wilton Strategies | Aug 16–19 | 812 (LV) | – | 38% | 50% | 1% | 1% | 1%[mb] | 9% |
| Civiqs/Rust Belt Rising[AY] | Aug 13–17 | 631 (RV) | – | 46% | 49% | - | - | 3%[cv] | 1% |
| Morning Consult | Aug 7–16 | 1,212 (LV) | ± (2%–4%) | 44% | 50% | - | - | – | – |
| Hodas & Associates/Restoration PAC[AX] | Aug 11–15 | 600 (LV) | – | 41% | 52% | - | - | – | 7% |
| Change Research/CNBC | Aug 7–9 | 413 (LV) | – | 43% | 48% | - | - | – | – |
| YouGov/University of Wisconsin-Madison | Jul 27 – Aug 6 | 761 (RV) | ± 5.1% | 43% | 47% | - | - | 5%[mc] | 6% |
| GQR Research/Unite the Country PAC[BB] | Jul 30 – Aug 4 | 1,245 (LV) | – | 43% | 52% | - | - | – | – |
| David Binder Research | Jul 30–31 | 200 (LV) | – | 41% | 51% | - | - | – | – |
| SurveyMonkey/Axios | Jul 1–31 | 3,083 (LV) | – | 48% | 49% | - | - | – | 2% |
| EPIC-MRA | Jul 25–30 | 600 (LV) | ± 4.0% | 40% | 51% | 3% | - | - | 6% |
| Public Policy Polling/Progress Michigan[AV] | Jul 28–29 | 876 (V) | – | 43% | 49% | - | - | 6%[md] | 3% |
| Change Research/CNBC[17] | Jul 24–26 | 413 (LV) | – | 42% | 46% | - | - | – | – |
| Morning Consult | Jul 17–26 | 1,320 (LV) | ± 2.7% | 42% | 52% | - | - | – | – |
| YouGov/CBS | Jul 21–24 | 1,156 (LV) | ± 3.4% | 42% | 48% | - | - | 2%[me] | 7% |
| Redfield & Wilton Strategies | Jul 19–24 | 811 (LV) | – | 37% | 49% | 1% | 1% | 2%[mf] | 10% |
| CNN/SSRS | Jul 18–24 | 927 (RV) | ± 3.8% | 40% | 52% | - | - | 5%[mg] | 2% |
| Gravis Marketing[18] | Jul 22 | 754 (RV) | ± 3.6% | 42% | 51% | - | - | – | 7% |
| Fox News | Jul 18–20 | 756 (RV) | ± 3.5% | 40% | 49% | - | - | 4%[mh] | 7% |
| Hodas & Associates/Restoration PAC[AX] | Jul 13–16 | 600 (LV) | ± 4.0% | 41% | 53% | - | - | – | 7% |
| Spry Strategies/American Principles Project[BC] | Jul 11–16 | 600 (LV) | ± 3.7% | 50% | 45% | - | - | – | 5% |
| Change Research/CNBC | Jul 10–12 | 824 (LV) | – | 42% | 48% | - | - | – | – |
| Public Policy Polling/Giffords (D)[BD] | Jul 9–10 | 1,041 (V) | ± 3.2% | 44% | 51% | - | - | – | 5% |
| SurveyMonkey/Axios | Jun 8–30 | 1,238 (LV) | – | 46% | 51% | - | - | – | 3% |
| Change Research/CNBC | Jun 26–28 | 699 (LV)[al] | – | 43% | 48% | - | - | – | – |
| Public Policy Polling/Progress Michigan (D)[AV] | Jun 26–27 | 1,237 (V) | – | 44% | 50% | - | - | 5%[mi] | 1% |
| Hodas & Associates/Restoration PAC (R) | Jun 17–20 | 600 (LV) | ± 4.0% | 38% | 56% | - | - | 2%[mj] | 7% |
| Trafalgar Group | Jun 16–18 | 1,101 (LV) | ± 2.95% | 45% | 46% | - | - | 5%[lh] | 4% |
| NYT Upshot/Siena College | Jun 8–17 | 610 (RV) | ± 4.3% | 36% | 47% | - | - | 8%[mk] | 9% |
| Redfield & Wilton Strategies | Jun 14–16 | 826 (LV) | ± 3.41% | 36% | 47% | 2% | 1% | 2%[ml] | 12% |
| TargetPoint | Jun 11–16 | 1,000 (A) | – | 33% | 49% | - | - | 4%[mm] | 14% |
| Change Research/CNBC | Jun 12–14 | 353 (LV)[al] | – | 45% | 47% | - | - | 3%[mn] | – |
| TIPP/American Greatness PAC Archived June 16, 2020, at the Wayback Machine[H] | Jun 9–12 | 859 (LV) | – | 38% | 51% | - | - | 4%[mo] | 7% |
| Kiaer Research | May 31 – Jun 7 | 543 (LV) | ± 6.4% | 35% | 50% | - | - | 6%[mp] | 8% |
| EPIC-MRA | May 31 – Jun 4 | 600 (LV) | ± 4% | 39% | 55% | - | - | – | – |
| EPIC-MRA | May 30 – Jun 3 | 600 (LV) | ± 4% | 41% | 53% | - | - | – | 6%[dx] |
| Change Research/CNBC | May 29–31 | 620 (LV)[al] | – | 46% | 48% | - | - | 3% | 3% |
| Public Policy Polling/Progress Michigan[AV] | May 29–30 | 1,582 (V) | ± 2.5% | 44% | 50% | - | - | 4%[mq] | 2% |
| Morning Consult | May 17–26 | 1,325 (LV) | – | 42% | 50% | - | - | – | – |
| Public Policy Polling/Protect Our Care[BE] | May 18–19 | 1,234 (V) | ± 2.8% | 45% | 51% | - | - | – | 5% |
| Change Research/Crooked Media | May 11–17 | 3,070 (LV) | – | 46% | 49% | - | - | – | – |
| Redfield & Wilton Strategies | May 10–14 | 970 (LV) | ± 3.2% | 39% | 47% | - | - | 3%[mr] | 11% |
| Hodas & Associates/Restoration PAC (R) | May 1–5 | 600 (LV) | ± 3% | 42% | 50% | - | - | – | 8% |
| Public Policy Polling[BF] | Apr 28–29 | 1,270 (V) | – | 42% | 50% | - | - | – | 8% |
| Public Policy Polling[BG] | Apr 20–21 | 1,277 (RV) | – | 44% | 51% | - | - | – | 5% |
| Fox News | Apr 18–21 | 801 (RV) | ± 3.5% | 41% | 49% | - | - | 3% | 6% |
| Ipsos/Reuters | Apr 15–20 | 612 (RV) | ± 5.0% | 38% | 46% | - | - | – | – |
| Hodas & Associates/Restoration PAC (R) | Apr 9–11 | 600 (RV) | ± 3.0% | 43% | 49% | - | - | – | – |
| Hart Research/CAP Action[BH] | Apr 6–8 | 303 (RV) | – | 41% | 50% | - | - | 4% | 5% |
| Public Policy Polling | Mar 31 – Apr 1 | 1,019 (RV) | ± 3.1% | 45% | 48% | - | - | – | 7% |
| SPRY Strategies | Mar 30 – Apr 1 | 602 (LV) | ± 4.0% | 46% | 46% | - | - | – | 8% |
| Baldwin Wallace University Great Lakes | Mar 17–25 | 997 (RV) | ± 3.7% | 42% | 47% | - | - | – | 11% |
| Change Research | Mar 21–23 | 510 (LV) | – | 47% | 48% | - | - | 5% | |
| Marketing Resource Group Archived March 25, 2020, at the Wayback Machine | Mar 16–20 | 600 (LV) | ± 4.0% | 41% | 44% | - | - | 9%[ms] | 6% |
| Hodas & Associates/Restoration PAC (R) | Mar 12–16 | 600 (RV) | – | 44% | 50% | - | - | – | – |
| AtlasIntel | Mar 7–9 | 1,100 (RV) | ± 3.0% | 46% | 44% | - | - | 10% | – |
| YouGov/Yahoo News | Mar 6–8 | 566 (RV) | – | 41% | 45% | - | - | 6%[mt] | 7% |
| Monmouth University | Mar 5–8 | 977 (RV) | ± 3.1% | 41% | 48% | - | - | 2% | 9% |
| Firehouse Strategies/Øptimus Archived December 9, 2019, at the Wayback Machine | Mar 5–7 | 550 (RV) | ± 5.3% | 46% | 44% | - | - | – | – |
| YouGov | Feb 11–20 | 1,249 (RV) | ± 4.0% | 43% | 47% | - | - | – | – |
| Quinnipiac University Archived May 13, 2020, at the Wayback Machine | Feb 12–18 | 845 (RV) | ± 3.4% | 43% | 47% | - | - | 6%[mu] | 3% |
| Expedition Strategies/Progressive Policies Institute | Feb 6–18 | 500 (RV) | – | 43% | 43% | - | - | – | 14% |
| EPIC-MRA/Detroit Free Press[19] | Jan 9–12 | 600 (LV) | ± 4% | 44% | 50% | - | - | – | 6% |
| Glengariff Group Inc. | Jan 3–7 | 600 (LV) | ± 4% | 43% | 50% | - | - | – | 5% |
2017–2019 polls
| Poll source | Date(s) administered |
Sample size[dk] |
Margin of error |
Donald Trump Republican |
Joe Biden Democratic |
Other | Undecided |
|---|---|---|---|---|---|---|---|
| Firehouse Strategies/Øptimus Archived December 9, 2019, at the Wayback Machine | Dec 3–5, 2019 | 551 (LV) | ± 4.3% | 46% | 41% | 8% [mv] | 5% [dx] |
| Emerson College | Oct 31 – Nov 3, 2019 | 1,051 (RV) | ± 3.0% | 44% | 56% | – | – |
| NYT Upshot/Siena College | Oct 13–25, 2019 | 501 (LV) | ± 5.1% | 44% | 45% | – | – |
| Target Insyght | Sep 24–26, 2019 | 800 (LV) | – | 35% | 54% | – | – |
| Firehouse Strategies/Øptimus Archived September 12, 2019, at the Wayback Machine | Sep 7–9, 2019 | 529 (LV) | ± 4.0% | 41% | 42% | 17% | – |
| EPIC-MRA | Aug 17–21, 2019 | 600 (LV) | ± 4.0% | 41% | 51% | – | 8% |
| Climate Nexus | Jul 14–17, 2019 | 820 (RV) | ± 4.0% | 36% | 49% | 5%[mw] | 10% |
| Firehouse Strategies/Øptimus | Jun 11–13, 2019 | 587 (LV) | ± 4.2% | 43% | 46% | 11% | – |
| EPIC-MRA | Jun 8–12, 2019 | 600 (LV) | ± 4.0% | 41% | 52% | – | 7% |
| Glengariff Group | May 28–30, 2019 | 600 (LV) | ± 4.0% | 41% | 53% | – | 4% |
| WPA Intelligence | Apr 27–30, 2019 | 200 (LV) | ± 6.9% | 42% | 45% | – | 12% |
| Firehouse Strategies/Øptimus Archived April 3, 2019, at the Wayback Machine | Mar 19–21, 2019 | 530 (LV) | ± 4.5% | 46% | 45% | 4% | – |
| Emerson College Archived March 10, 2019, at the Wayback Machine | Mar 7–10, 2019 | 743 (RV) | ± 3.5% | 46% | 54% | – | – |
| Glengariff Group Archived April 22, 2019, at the Wayback Machine | Jan 24–26, 2019 | 600 (LV) | ± 4.0% | 40% | 53% | – | 5% |
| EPIC-MRA | Apr 28–30, 2018 | 600 (LV) | ± 4.0% | 39% | 52% | – | 9% |
| Zogby Analytics | Sep 2017 | 800 (V) | – | 35% | 52% | – | 13% |
Minnesota
- Graphical summary
Graphs are unavailable due to technical issues. There is more info on Phabricator and on MediaWiki.org. |
Aggregate polls
| Source of poll aggregation |
Dates administered |
Dates updated |
Joe Biden Democratic |
Donald Trump Republican |
Other/ Undecided [a] |
Margin |
|---|---|---|---|---|---|---|
| 270 to Win | October 27 – November 2, 2020 | November 3, 2020 | 51.6% | 41.8% | 6.6% | Biden +9.8 |
| Real Clear Politics | October 12–27, 2020 | November 3, 2020 | 48.0% | 43.7% | 8.3% | Biden +4.3 |
| FiveThirtyEight | until November 2, 2020 | November 3, 2020 | 51.8% | 42.7% | 5.5% | Biden +9.2 |
| Average | 50.5% | 42.7% | 6.8% | Biden +7.8 | ||
- Polls
| Poll source | Date(s) administered |
Sample size[dk] |
Margin of error |
Donald Trump Republican |
Joe Biden Democratic |
Jo Jorgensen Libertarian |
Howie Hawkins Green |
Other | Undecided |
|---|---|---|---|---|---|---|---|---|---|
| SurveyMonkey/Axios | Oct 20 – Nov 2, 2020 | 3,031 (LV) | ± 2.5% | 41%[mx] | 56% | - | - | – | – |
| Research Co. | Oct 31 – Nov 1, 2020 | 450 (LV) | ± 4.6% | 45% | 54% | - | - | 1%[my] | 4% |
| Data for Progress | Oct 27 – Nov 1, 2020 | 1,259 (LV) | ± 2.8% | 43% | 51% | 4% | 2% | 1%[mz] | – |
| Swayable Archived November 27, 2020, at the Wayback Machine | Oct 23 – Nov 1, 2020 | 466 (LV) | ± 5.9% | 43% | 53% | 4% | 0% | – | – |
| Morning Consult | Oct 22–31, 2020 | 883 (LV) | ± 3.0% | 42% | 52% | - | - | – | – |
| Public Policy Polling | Oct 29–30, 2020 | 770 (V) | – | 43% | 54% | - | - | 2%[ah] | 1% |
| Targoz Market Research/PollSmart | Oct 25–30, 2020 | 1,138 (LV) | – | 44% | 53% | - | - | 3%[na] | – |
| St. Cloud State University | Oct 10–29, 2020 | 372 (A) | ± 6.7% | 39% | 54% | - | - | – | – |
| SurveyMonkey/Axios | Oct 1–28, 2020 | 5,498 (LV) | – | 42% | 55% | - | - | – | – |
| SurveyUSA/KSTP/ABC6 News Archived October 31, 2020, at the Wayback Machine | Oct 23–27, 2020 | 649 (LV) | ± 4.3% | 42% | 47% | - | - | 5%[nb] | 6% |
| Gravis Marketing | Oct 24–26, 2020 | 657 (LV) | ± 3.8% | 39% | 53% | - | - | – | 8% |
| Trafalgar Group | Oct 24–25, 2020 | 1,065 (LV) | ± 2.92% | 45% | 48% | 2% | - | 4%[nc] | 1% |
| Civiqs/Daily Kos | Oct 17–20, 2020 | 840 (LV) | ± 3.6% | 43% | 53% | - | - | 3%[cv] | 1% |
| SurveyUSA/KSTP | Oct 16–20, 2020 | 625 (LV) | ± 5% | 42% | 48% | - | - | – | – |
| Morning Consult | Oct 11–20, 2020 | 864 (LV) | ± 3.3% | 42% | 51% | - | - | – | – |
| Change Research/MinnPost | Oct 12–15, 2020[nd] | 1,021 (LV) | ± 3.1% | 44% | 49% | 2% | 0% | 2%[ne] | 2% |
| David Binder Research/Focus on Rural America | Oct 10–13, 2020 | 200 (LV) | – | 41% | 52% | - | - | – | – |
| Morning Consult | Oct 2–11, 2020 | 898 (LV) | ± 3.3% | 44% | 50% | - | - | – | – |
| SurveyUSA/ABC6 News Archived October 11, 2020, at the Wayback Machine | Oct 1–6, 2020 | 929 (LV) | ± 3.9% | 40% | 47% | - | - | 3%[nf] | 10% |
| SurveyMonkey/Axios | Sep 1–30, 2020 | 2,808 (LV) | – | 43% | 55% | - | - | – | 2% |
| Suffolk University | Sep 20–24, 2020 | 500 (LV) | ± 4.4% | 40% | 47% | 2% | 0% | 4%[ng] | 6% |
| Mason-Dixon/StarTribune /MPR News/KARE 11 |
Sep 21–23, 2020 | 800 (LV) | ± 3.5% | 42% | 48% | - | - | 2% | 8% |
| Redfield & Wilton Strategies | Sep 12–17, 2020 | 718 (LV) | ± 3.66% | 42% | 51% | 0% | 0% | 1%[nh] | 5% |
| ABC/Washington Post | Sep 8–13, 2020 | 615 (LV) | ± 4.5% | 41% | 57% | - | - | 1%[ni] | 1% |
| Morning Consult | Sep 4–13, 2020 | 643 (LV) | ± 4% | 44%[bg] | 48% | - | - | 2%[ah] | 6% |
| YouGov/CBS | Sep 9–11, 2020 | 1,087 (LV) | ± 3.9% | 41% | 50% | - | - | 2%[nj] | 6% |
| Siena College/NYT Upshot | Sep 8–10, 2020 | 814 (LV) | ± 3.9% | 41% | 50% | 2% | 1% | 0%[nk] | 5%[nl] |
| SurveyUSA | Sep 4–7, 2020 | 553 (LV) | ± 5.2% | 40% | 49% | - | - | 4%[nm] | 7% |
| Morning Consult | Aug 29 – Sep 7, 2020 | 649 (LV) | ± (2%–4%) | 44%[bg] | 49% | - | - | – | – |
| PPP | Sep 3–4, 2020 | 877 (V) | ± 3.3% | 44% | 52% | - | - | 3%[cv] | 1% |
| Harper Polling/Jason Lewis[BI] | Aug 30 – Sep 1, 2020 | 501 (LV) | ± 4.38% | 45% | 48% | – | – | – | 4% |
| SurveyMonkey/Axios | Aug 1–31, 2020 | 1,939 (LV) | – | 43% | 56% | - | - | – | 1% |
| Morning Consult | Aug 21–30, 2020 | 647 (LV) | ± (2%–4%) | 43% | 50% | - | - | – | – |
| Trafalgar Group | Aug 15–18, 2020 | 1,141 (LV) | ± 3.0% | 47% | 47% | 4% | - | 1%[nn] | 2% |
| Morning Consult | Aug 7–16, 2020 | 615 (LV) | ± (2%–4%) | 42% | 50% | - | - | – | – |
| Emerson College | Aug 8–10, 2020 | 733 (LV) | ± 3.6% | 49%[no] | 51% | - | - | – | – |
| David Binder Research | Jul 30–31, 2020 | 200 (LV) | – | 36% | 54% | - | - | – | – |
| SurveyMonkey/Axios | Jul 1–31, 2020 | 2,288 (LV) | – | 47% | 51% | - | - | – | 2% |
| Morning Consult | Jul 17–26, 2020 | 662 (LV) | ± 3.8% | 44% | 47% | - | - | – | – |
| Trafalgar Group | Jul 23–25, 2020 | 1,129 (LV) | ± 2.8% | 44% | 49% | 2% | - | 3%[np] | 2% |
| Public Policy Polling/Giffords Archived July 31, 2020, at the Wayback Machine[BJ] | Jul 22–23, 2020 | 1,218 (V) | ± 3.2% | 42% | 52% | - | - | – | 6% |
| FOX News | Jul 18–20, 2020 | 776 (RV) | ± 3.5% | 38% | 51% | - | - | 6%[nq] | 6% |
| SurveyMonkey/Axios | Jun 8–30, 2020 | 860 (LV) | – | 42% | 57% | - | - | – | 1% |
| Gravis Marketing | Jun 19, 2020 | 600 (RV) | ± 4.0% | 42%[nr] | 58%[ns] | - | - | – | – |
| Morning Consult | May 27– Jun 5, 2020 | 600 (LV) | ± 4% | 45% | 48% | - | - | – | – |
| Harper Polling/Jason Lewis[BI] | May 26–28, 2020 | 510 (LV) | – | 42% | 50% | – | – | – | 8% |
| Morning Consult | May 17–26, 2020 | 647 (LV) | – | 42% | 49% | - | - | – | – |
| Mason-Dixon/StarTribune /MPR News/KARE 11 |
May 18–20, 2020 | 800 (RV) | ± 3.5% | 44% | 49% | - | - | – | 7% |
| Morning Consult | May 7–16, 2020 | 600 (LV) | ± 4% | 38% | 55% | - | - | – | – |
| Mason-Dixon/StarTribune | Oct 14–16, 2019 | 800 (RV) | ± 3.5% | 38% | 50% | - | - | – | 12% |
Mississippi
Graphical summary
Graphs are unavailable due to technical issues. There is more info on Phabricator and on MediaWiki.org. |
Aggregate polls
| Source of poll aggregation |
Dates administered |
Dates updated |
Joe Biden Democratic |
Donald Trump Republican |
Other/ Undecided [a] |
Margin |
|---|---|---|---|---|---|---|
| 270 to Win | October 17–27, 2020 | November 3, 2020 | 40.0% | 57.0% | 3.0% | Trump +17.0 |
| FiveThirtyEight | until November 2, 2020 | November 3, 2020 | 39.6% | 55.5% | 4.9% | Trump +15.9 |
| Average | 39.8% | 56.3% | 3.9% | Trump +16.5 | ||
Polls
| Poll source | Date(s) administered |
Sample size[dk] |
Margin of error |
Donald Trump Republican |
Joe Biden Democratic |
Jo Jorgensen Libertarian |
Howie Hawkins Green |
Other | Undecided |
|---|---|---|---|---|---|---|---|---|---|
| SurveyMonkey/Axios | Oct 20 – Nov 2, 2020 | 1,461 (LV) | ± 4% | 61%[nt] | 37% | - | - | – | – |
| Data For Progress | Oct 27 – Nov 1, 2020 | 562 (LV) | ± 4.1% | 55% | 41% | 2% | 1% | 1%[nu] | – |
| Civiqs/Daily Kos | Oct 23–26, 2020 | 507 (LV) | ± 5.3% | 55% | 41% | - | - | 3%[nv] | 1% |
| SurveyMonkey/Axios | Oct 1–28, 2020 | 2,116 (LV) | – | 62% | 37% | - | - | – | – |
| SurveyMonkey/Axios | Sep 1–30, 2020 | 782 (LV) | – | 55% | 44% | - | - | – | 1% |
| SurveyMonkey/Axios | Aug 1–31, 2020 | 607 (LV) | – | 61% | 36% | - | - | – | 3% |
| Tyson Group/Consumer Energy Alliance[BK] | Aug 28–30, 2020 | 600 (LV) | ± 4% | 50% | 40% | No voters | - | No voters[nw] | 6% |
| Garin-Hart-Yang Research Group/Mike Espy[BL] | Jul 30 – Aug 9, 2020 | 600 (LV) | ± 4.1% | 53%[nx] | 43% | - | - | – | – |
| SurveyMonkey/Axios | Jul 1–31, 2020 | 733 (LV) | – | 59% | 39% | - | - | – | 2% |
| SurveyMonkey/Axios | Jun 8–30, 2020 | 425 (LV) | – | 63% | 35% | - | - | – | 2% |
| Chism Strategies (D) | Jun 2–4, 2020 | 568 (LV) | ± 4.1% | 50% | 41% | - | - | 6%[ny] | 3% |
| Chism Strategies/Millsaps College | Apr 8–9, 2020 | 508 (RV) | ± 4.4% | 49% | 38% | - | - | 7% | 7% |
| Mason-Dixon | Feb 26–28, 2020 | 625 (RV) | ± 4.0% | 56% | 41% | - | - | – | 3% |
Missouri
- Graphical summary
Graphs are unavailable due to technical issues. There is more info on Phabricator and on MediaWiki.org. |
Aggregate polls
| Source of poll aggregation |
Dates administered |
Dates updated |
Joe Biden Democratic |
Donald Trump Republican |
Other/ Undecided [a] |
Margin |
|---|---|---|---|---|---|---|
| 270 to Win | October 13 – November 2, 2020 | November 3, 2020 | 43.7% | 51.3% | 5.0% | Trump +7.6 |
| FiveThirtyEight | until November 2, 2020 | November 3, 2020 | 43.6% | 51.6% | 4.8% | Trump +8.0 |
| Average | 43.7% | 51.5% | 4.9% | Trump +7.8 | ||
Polls
| Poll source | Date(s) administered |
Sample size[dk] |
Margin of error |
Donald Trump Republican |
Joe Biden Democratic |
Jo Jorgensen Libertarian |
Howie Hawkins Green |
Other | Undecided |
|---|---|---|---|---|---|---|---|---|---|
| SurveyMonkey/Axios | Oct 20 – Nov 2, 2020 | 2,926 (LV) | ± 2.5% | 54%[nz] | 44% | - | - | – | – |
| Swayable Archived November 27, 2020, at the Wayback Machine | Oct 23 – Nov 1, 2020 | 487 (LV) | ± 6.6% | 55% | 43% | 2% | 0% | – | – |
| Morning Consult | Oct 22–31, 2020 | 1,109 (LV) | ± 3% | 52% | 43% | - | - | – | – |
| Remington Research Group/Missouri Scout | Oct 28–29, 2020 | 1,010 (LV) | ± 3% | 50% | 45% | 2% | 1% | – | 2% |
| SurveyMonkey/Axios | Oct 1–28, 2020 | 4,759 (LV) | – | 53% | 45% | - | - | – | – |
| Remington Research Group/Missouri Scout | Oct 14–15, 2020 | 1,010 (LV) | ± 3% | 51% | 45% | 1% | 1% | - | 2% |
| YouGov/SLU | Sep 24 – Oct 7, 2020 | 931 (LV) | ± 3.9% | 52% | 43% | - | - | 3% | 2% |
| Garin-Hart-Yang/Galloway for Missouri[BM] | Sep 28 – Oct 2, 2020 | 600 (LV) | ± 4.1% | 50% | 48% | - | - | – | – |
| Remington Research Group/Missouri Scout | Sep 30 – Oct 1, 2020 | 980 (LV) | ± 3% | 51% | 46% | - | - | – | 3% |
| SurveyMonkey/Axios | Sep 1–30, 2020 | 2,157 (LV) | – | 53% | 45% | - | - | – | 2% |
| Remington Research Group/Missouri Scout | Sep 16–17, 2020 | 1,046 (LV) | ± 3% | 53% | 45% | - | - | – | 2% |
| We Ask America | Sep 1–3, 2020 | 500 (LV) | ± 4.38% | 49% | 44% | - | - | 5%[oa] | 2% |
| SurveyMonkey/Axios | Aug 1–31, 2020 | 1,863 (LV) | – | 54% | 44% | - | - | – | 2% |
| Trafalgar Group (R) | Aug 26–28, 2020 | 1,015 (LV) | ± 2.99% | 52% | 41% | 3% | - | 1%[ob] | 3% |
| SurveyMonkey/Axios | Jul 1–31, 2020 | 2,261 (LV) | – | 54% | 44% | - | - | – | 2% |
| YouGov/Saint Louis University | Jun 23 – Jul 1, 2020 | 900 (LV) | ± 3.95% | 50% | 43% | - | - | 4% | 4% |
| SurveyMonkey/Axios | Jun 8–30, 2020 | 868 (LV) | – | 51% | 47% | - | - | – | 1% |
| Garin-Hart-Yang/Galloway for Governor/Missouri Scout[BM] | Jun 16–22, 2020 | 800 (LV) | ± 3.5% | 46% | 48% | - | - | – | – |
| Remington Research Group/Missouri Scout | Jun 10–11, 2020 | 1,152 (LV) | ± 2.9% | 51% | 43% | - | - | – | 6% |
| We Ask America | May 26–27, 2020 | 500 (LV) | ± 4.38% | 48% | 44% | - | - | 3%[oc] | 5% |
| Remington Research Group/Missouri Scout | Feb 26–27, 2020 | 1,050 (LV) | – | 53% | 42% | - | - | – | 5% |
| American Viewpoint/Uniting Missouri[BN] | Jan 20–22, 2020 | 1,200 (LV) | – | 50% | 43% | - | - | – | 7% |
| Remington Research Group | Sep 18–19, 2019 | 1,046 (LV) | ± 3.0% | 53% | 42% | - | - | – | 5% |
| Remington Research Group | Apr 10–11, 2019 | 955 (LV) | ± 3.3% | 51% | 43% | - | - | – | 6% |
Montana
Graphical summary
Graphs are unavailable due to technical issues. There is more info on Phabricator and on MediaWiki.org. |
Aggregate polls
| Source of poll aggregation |
Dates administered |
Dates updated |
Joe Biden Democratic |
Donald Trump Republican |
Other/ Undecided [a] |
Margin |
|---|---|---|---|---|---|---|
| 270 to Win | October 22–28, 2020 | November 3, 2020 | 44.8% | 50.2% | 5.0% | Trump +5.4 |
| FiveThirtyEight | until November 2, 2020 | November 3, 2020 | 45.4% | 49.8% | 4.8% | Trump +4.4 |
| Average | 45.1% | 50.0% | 4.9% | Trump +4.9 | ||
Polls
| Poll source | Date(s) administered |
Sample size[dk] |
Margin of error |
Donald Trump Republican |
Joe Biden Democratic |
Jo Jorgensen Libertarian |
Other | Undecided |
|---|---|---|---|---|---|---|---|---|
| Change Research | Oct 29 – Nov 2, 2020 | 920 (LV) | ± 3.5% | 50% | 45% | 2% | 1%[od] | 1% |
| SurveyMonkey/Axios | Oct 20 – Nov 2, 2020 | 1,021 (LV) | ± 4% | 52%[oe] | 46% | – | – | – |
| SurveyMonkey/Axios | Oct 1–28, 2020 | 1,471 (LV) | ± 4.0% | 50% | 48% | – | – | – |
| Public Policy Polling/Protect Our Care[BO] | Oct 26–27, 2020 | 886 (LV) | ± 3.3% | 49% | 47% | – | – | 3% |
| Montana State University Billings | Oct 19–24, 2020 | 546 (LV) | ± 4.2% | 52% | 45% | 1% | – | 2% |
| Siena College/NYT Upshot | Oct 18–20, 2020 | 758 (LV) | ± 4.4% | 49% | 43% | 3% | 2%[of] | 3%[og] |
| Strategies 360/NBCMT | Oct 15–20, 2020 | 500 (LV) | ± 4.4% | 51% | 43% | 3% | – | 4% |
| RMG Research/PoliticalIQ | Oct 15–18, 2020 | 800 (LV) | ± 3.5% | 50%[oh] | 46% | 2% | 4%[eu] | 0% |
| 48%[oi] | 48% | 2% | 4%[eu] | 0% | ||||
| 52%[oj] | 44% | 2% | 4%[eu] | 0% | ||||
| Public Policy Polling | Oct 9–10, 2020 | 798 (V) | ± 3.5% | 52% | 46% | - | 2%[ok] | 0% |
| Emerson College | Oct 4–7, 2020 | 500 (LV) | ± 3.7% | 56% | 44% | – | – | – |
| Data For Progress (D) | Sep 30 – Oct 5, 2020 | 737 (LV) | ± 3.6% | 49% | 43% | 3% | 0%[ol] | 5% |
| Montana State University Bozeman | Sep 14 – Oct 2, 2020 | 1,607 (LV) | ± 3.9% | 51% | 44% | – | 4% | 2% |
| SurveyMonkey/Axios | Sep 1–30, 2020 | 480 (LV) | – | 57% | 41% | – | – | 2% |
| Siena College/NYT Upshot | Sep 14–16, 2020 | 625 (LV) | ± 4.8% | 49% | 42% | 2% | 2%[om] | 5%[og] |
| Fabrizio Ward/Hart Research Associates/AARP | Aug 30 – Sep 5, 2020 | 800 (LV) | ± 3.5% | 50% | 43% | – | 0%[on] | 6% |
| SurveyMonkey/Axios | Aug 1–31, 2020 | 562 (LV) | – | 52% | 46% | – | – | 1% |
| Expedition Strategies/House Majority PAC Archived September 2, 2020, at the Wayback Machine[BP] | Aug 22–27, 2020 | 400 (LV) | ± 4.9% | 48% | 44% | – | – | 7%[og] |
| Emerson College | Jul 31 – Aug 2, 2020 | 584 (LV) | ± 4.0% | 54%[oo] | 46% | – | – | – |
| SurveyMonkey/Axios | Jul 1–31, 2020 | 527 (LV) | – | 53% | 44% | – | – | 3% |
| Public Policy Polling/AFSCME[F] | Jul 23–24, 2020 | 917 (V) | – | 50% | 45% | – | – | 5% |
| Spry Strategies/American Principles Project[BQ] | Jul 11–16, 2020 | 700 (LV) | ± 3.7% | 52% | 42% | – | – | 6% |
| Civiqs/Daily Kos | Jul 11–13, 2020 | 873 (RV) | ± 4.2% | 49% | 45% | - | 5%[op] | 1% |
| Public Policy Polling/Election Twitter | Jul 9–10, 2020 | 1,224 (V) | ± 2.8% | 51% | 42% | – | – | 7% |
| SurveyMonkey/Axios | Jun 8–30, 2020 | 166 (LV) | – | 57% | 41% | – | – | 2% |
| University of Montana | Jun 17–26, 2020 | 517 (RV) | ± 4.3% | 52% | 38% | – | – | 10% |
| Montana State University Bozeman | Apr 10–27, 2020 | 459 (LV) | ± 4.6% | 45% | 40% | – | 11% | 5% |
| The Progress Campaign (D) | Apr 14–21, 2020 | 1,712 (RV) | ± 4.6% | 51% | 42% | – | – | 7%[oq] |
| University of Montana | Feb 12–22, 2020 | 498 (LV) | ± 4.4% | 56% | 34% | – | – | 10% |
| University of Montana | Sep 26 – Oct 3, 2019 | 303 (RV) | ± 5.6% | 54% | 47% | – | – | – |
Nebraska
Aggregate polls
| Source of poll aggregation |
Dates administered |
Dates updated |
Joe Biden Democratic |
Donald Trump Republican |
Other/ Undecided [a] |
Margin |
|---|---|---|---|---|---|---|
| FiveThirtyEight | until November 2, 2020 | November 3, 2020 | 42.5% | 52.1% | 5.4% | Trump +9.7 |
- Statewide
Graphs are unavailable due to technical issues. There is more info on Phabricator and on MediaWiki.org. |
| Poll source | Date(s) administered |
Sample size[dk] |
Margin of error |
Donald Trump Republican |
Joe Biden Democratic |
Jo Jorgensen Libertarian |
Other | Undecided |
|---|---|---|---|---|---|---|---|---|
| SurveyMonkey/Axios | Oct 20 – Nov 2, 2020 | 1,742 (LV) | ± 3.5% | 56%[or] | 43% | - | - | – |
| SurveyMonkey/Axios | Oct 1–28, 2020 | 2,423 (LV) | – | 53% | 46% | - | - | – |
| SurveyMonkey/Axios | Sep 1–30, 2020 | 799 (LV) | – | 57% | 41% | - | - | 2% |
| SurveyMonkey/Axios | Aug 1–31, 2020 | 560 (LV) | – | 53% | 47% | - | - | 1% |
| SurveyMonkey/Axios | Jul 1–31, 2020 | 910 (LV) | – | 54% | 44% | - | - | 2% |
| SurveyMonkey/Axios | Jun 8–30, 2020 | 267 (LV) | – | 56% | 42% | - | - | 2% |
- in Nebraska's 1st congressional district
| Poll source | Date(s) administered |
Sample size[dk] |
Margin of error |
Donald Trump Republican |
Joe Biden Democratic |
Jo Jorgensen Libertarian |
Other | Undecided |
|---|---|---|---|---|---|---|---|---|
| Strategies 360/Kate Bolz[BR] | Jul 16–22, 2020 | 400 (LV) | ± 4.9% | 48% | 46% | - | - | – |
- in Nebraska's 2nd congressional district
Graphs are unavailable due to technical issues. There is more info on Phabricator and on MediaWiki.org. |
| Poll source | Date(s) administered |
Sample size[dk] |
Margin of error |
Donald Trump Republican |
Joe Biden Democratic |
Jo Jorgensen Libertarian |
Other | Undecided |
|---|---|---|---|---|---|---|---|---|
| University of Nevada | Oct 30 – Nov 2, 2020 | 191 (LV) | ± 7% | 44% | 50% | 5% | – | – |
| Change Research | Oct 29 – Nov 2, 2020 | 920 (LV) | ± 3.5% | 47% | 50% | 2% | 0%[os] | 0% |
| Emerson College | Oct 29–30, 2020 | 806 (LV) | ± 3.5% | 48%[ot] | 50% | - | 2%[ou] | – |
| FM3 Research/Congressional Progressive Caucus PAC[BS] | Oct 1–4, 2020 | 450 (LV) | ± 4.6% | 42% | 53% | - | 5%[ov] | – |
| Siena College/NYT | Sep 25–27, 2020 | 420 (LV) | ± 5.3% | 41% | 48% | 4% | 1%[ow] | 6%[og] |
| Global Strategy Group/House Majority PAC[BT] | Sep 14–16, 2020 | 400 (LV) | ± 4.9% | 44% | 50% | - | 1%[ox] | 3%[og] |
| Global Strategy Group/House Majority PAC[BT] | Jul 27–29, 2020 | 400 (LV) | – | 45% | 51% | - | 2%[oy] | 3%[og] |
| GQR/Kara Eastman[BU] | Jun 30 – Jul 5, 2020 | 502 (LV) | ± 4.37% | 44% | 51% | - | – | – |
| DCCC Targeting and Analytics Department/Ally Mutnick[BV] | May 7–10, 2020 | 448 (LV) | ± 4.6% | 41% | 52% | - | – | – |
Nevada
Graphical summary
Graphs are unavailable due to technical issues. There is more info on Phabricator and on MediaWiki.org. |
Aggregate polls
| Source of poll aggregation |
Dates administered |
Dates updated |
Joe Biden Democratic |
Donald Trump Republican |
Other/ Undecided [a] |
Margin |
|---|---|---|---|---|---|---|
| 270 to Win | October 16–31, 2020 | November 1, 2020 | 49.4% | 44.4% | 6.2% | Biden +5.0 |
| Real Clear Politics | October 23 – November 2, 2020 | November 1, 2020 | 48.7% | 46.3% | 5.0% | Biden +2.4 |
| FiveThirtyEight | until November 2, 2020 | November 3, 2020 | 49.7% | 44.4% | 5.9% | Biden +5.3 |
| Average | 49.3% | 45.0% | 5.7% | Biden +4.3 | ||
Polls
| Poll source | Date(s) administered |
Sample size[dk] |
Margin of error |
Donald Trump Republican |
Joe Biden Democratic |
Jo Jorgensen Libertarian |
Other | Undecided |
|---|---|---|---|---|---|---|---|---|
| Trafalgar Group | Oct 31 – Nov 2, 2020 | 1,024 (LV) | ± 2.98% | 49% | 48% | 1% | 1%[dn] | 1% |
| SurveyMonkey/Axios | Oct 20 – Nov 2, 2020 | 2,366 (LV) | ± 3% | 49%[oz] | 49% | - | – | – |
| Data for Progress | Oct 27 – Nov 1, 2020 | 1,442 (LV) | ± 2.6% | 44% | 51% | 3% | 2%[pa] | – |
| Emerson College | Oct 29–31, 2020 | 720 (LV) | ± 3.6% | 47% | 49% | - | 4%[pb] | – |
| Trafalgar Group | Oct 28–29, 2020 | 1,024 (LV) | ± 2.98% | 47% | 49% | 2% | 1%[dn] | 1% |
| Gravis Marketing | Oct 27–28, 2020 | 688 (LV) | ± 3.7% | 44% | 50% | – | – | 6% |
| SurveyMonkey/Axios | Oct 1–28, 2020 | 3,333 (LV) | – | 49% | 50% | - | – | – |
| Siena College/NYT Upshot | Oct 23–26, 2020 | 809 (LV) | ± 3.8% | 43% | 49% | 3% | 2%[pc] | 4%[og] |
| BUSR/University of Nevada | Oct 16–21, Oct 23, 2020 |
809 (LV) | ± 4% | 41% | 50% | – | – | – |
| Civiqs/Daily Kos | Oct 17–20, 2020 | 712 (LV) | ± 5.3% | 43% | 52% | - | 3%[pd] | 1% |
| WPA Intelligence/Las Vegas Review-Journal/AARP | Oct 7–11, 2020 | 512 (LV) | ± 4.4% | 42% | 44% | 3% | 5%[pe] | 6% |
| YouGov/CBS | Oct 6–9, 2020 | 1,036 (LV) | ± 4.1% | 46% | 52% | - | 2%[pf] | 0% |
| Siena College/NYT Upshot | Oct 2–6, 2020 | 660 (LV) | ± 4.3% | 42% | 48% | 3% | 1%[pg] | 6%[og] |
| SurveyMonkey/Axios | Sep 1–30, 2020 | 1,239 (LV) | – | 47% | 51% | - | - | 2% |
| Pulse Opinion Research/Rasmussen Reports/American Greatness PAC[H] | Sep 23–25, 2020 | 750 (LV) | – | 48% | 49% | - | 2%[ph] | 1% |
| Qualtrics/University of Nevada/BUSR | Sep 10–25, 2020 | 641 (LV) | ± 4% | 41% | 46% | - | 7%[pi] | 6% |
| Fox News | Sep 20–23, 2020 | 810 (LV) | ± 3% | 41% | 52% | 3% | 2%[pj] | 2% |
| 911 (RV) | ± 3% | 40% | 50% | 3% | 3%[pk] | 4% | ||
| ALG Research/The Nevada Independent (D)[BW] | Sep 15–21, 2020 | 800 (LV) | ± 3.5% | 43% | 47% | – | – | – |
| Siena College/NYT Upshot | Sep 8–10, 2020 | 462 (LV) | ± 5.3% | 42% | 46% | 3% | 1%[pl] | 7%[og] |
| SurveyMonkey/Axios | Aug 1–31, 2020 | 998 (LV) | – | 49% | 50% | - | – | 1% |
| Qualtrics/University of Nevada/BUSR | Aug 20–30, 2020 | 682 (LV) | ± 4% | 39% | 44% | – | 5%[pm] | 12% |
| SurveyMonkey/Axios | Jul 1–31, 2020 | 1,021 (LV) | – | 52% | 47% | - | - | 2% |
| SurveyMonkey/Axios | Jun 8–30, 2020 | 609 (LV) | – | 49% | 50% | - | - | 1% |
| ALG Research/The Nevada Independent (D)[BX] | Apr 27–30, 2020 | 763 (LV) | ± 3.6% | 45% | 49% | – | – | – |
| AtlasIntel | Feb 19–21, 2020 | 1,100 (RV) | ± 3.0% | 41% | 44% | – | 15% | – |
| FOX News | Jan 5–8, 2020 | 1,505 (RV) | ± 2.5% | 39% | 47% | – | 9%[pn] | 4% |
| FOX News | Nov 10–13, 2019 | 1,506 (RV) | ± 2.5% | 40% | 47% | – | 9%[pn] | 4% |
| Emerson College | Oct 31 – Nov 2, 2019 | 1,089 (RV) | ± 2.9% | 51% | 49% | – | – | – |
| Gravis Marketing | Aug 14–16, 2019 | 926 (RV) | ± 3.2% | 43% | 49% | – | – | 8% |
| Emerson College Archived April 20, 2019, at the Wayback Machine | Mar 28–30, 2019 | 719 (RV) | ± 3.6% | 48% | 52% | – | – | – |
New Hampshire
Graphical summary
Graphs are unavailable due to technical issues. There is more info on Phabricator and on MediaWiki.org. |
Aggregate polls
| Source of poll aggregation |
Dates administered |
Dates updated |
Joe Biden Democratic |
Donald Trump Republican |
Other/ Undecided [a] |
Margin |
|---|---|---|---|---|---|---|
| 270 to Win | October 14–29, 2020 | November 3, 2020 | 53.4% | 42.4% | 4.2% | Biden +11.0 |
| FiveThirtyEight | until November 2, 2020 | November 3, 2020 | 53.9% | 42.8% | 3.3% | Biden +11.1 |
| Average | 53.7% | 42.6% | 3.8% | Biden +11.1 | ||
Polls
| Poll source | Date(s) administered |
Sample size[dk] |
Margin of error |
Donald Trump Republican |
Joe Biden Democratic |
Jo Jorgensen Libertarian |
Other | Undecided |
|---|---|---|---|---|---|---|---|---|
| SurveyMonkey/Axios | Oct 20 – Nov 2, 2020 | 1,013 (LV) | ± 4.5% | 45%[po] | 54% | - | – | – |
| American Research Group | Oct 26–28, 2020 | 600 (LV) | ± 4% | 39% | 58% | 1% | – | 2% |
| University of New Hampshire | Oct 24–28, 2020 | 864 (LV) | ± 3.3% | 45% | 53% | 1% | 1% | 1% |
| SurveyMonkey/Axios | Oct 1–28, 2020 | 1,791 (LV) | – | 44% | 55% | - | – | – |
| Saint Anselm College | Oct 23–26, 2020 | 1,018 (LV) | ± 3.1% | 44% | 52% | 2% | – | 2% |
| YouGov/UMass Amherst | Oct 16–26, 2020 | 757 (LV) | ± 4.5% | 43% | 53% | 2% | 1%[pp] | 2% |
| University of New Hampshire | Oct 9–12, 2020 | 899 (LV) | ± 3.3% | 43% | 55% | 0% | 0%[pq] | 2% |
| Suffolk University/Boston Globe | Oct 8–12, 2020 | 500 (LV) | ± 4.4% | 41% | 51% | 2% | 3%[pr] | 5% |
| Saint Anselm College | Oct 1–4, 2020 | 1,147 (LV) | ± 2.9% | 41% | 53% | - | 4%[eu] | 2% |
| Emerson College | Sep 30 – Oct 1, 2020 | 700 (LV) | ± 3.6% | 45%[ai] | 53% | - | 2%[ps] | – |
| SurveyMonkey/Axios | Sep 1–30, 2020 | 637 (LV) | – | 43% | 55% | - | – | 2% |
| American Research Group | Sep 25–28, 2020 | 600 (LV) | ± 4% | 44% | 53% | 1% | – | 2% |
| University of New Hampshire | Sep 24–28, 2020 | 972 (LV) | ± 3.1% | 44% | 53% | 1% | 0%[pq] | 3% |
| Pulse Opinion Research/Center for American Greatness[H] | Sep 23–25, 2020 | 850 (LV) | ± 4% | 42%[ai] | 56% | - | 1%[pt] | 1% |
| YouGov/UMass Lowell | Sep 17–25, 2020 | 657 (LV) | ± 4.6% | 44%[pu] | 52% | 1% | 2%[pv] | 1% |
| 44%[pw] | 53% | - | 0%[pq] | 1% | ||||
| Siena College/NYT Upshot | Sep 8–11, 2020 | 445 (LV) | ± 5.5% | 42% | 45% | 4% | 2%[px] | 7%[py] |
| SurveyMonkey/Axios | Aug 1–31, 2020 | 444 (LV) | – | 39% | 60% | - | – | 1% |
| Saint Anselm College | Aug 15–17, 2020 | 1,042 (RV) | ± 3.0% | 43% | 51% | - | 4%[eu] | 2% |
| SurveyMonkey/Axios | Jul 1–31, 2020 | 574 (LV) | – | 39% | 60% | - | – | 2% |
| University of New Hampshire | Jul 16–28, 2020 | 1,893 (LV) | ± 2.3% | 40% | 53% | - | 4%[pz] | 3% |
| SurveyMonkey/Axios | Jun 8–30, 2020 | 191 (LV) | – | 39% | 61% | - | – | 1% |
| University of New Hampshire | Jun 18–22, 2020 | 936 (LV) | – | 39% | 52% | - | 6%[qa] | 3% |
| Saint Anselm College | Jun 13–16, 2020 | 1,072 (RV) | ± 3% | 42% | 49% | - | 5% | 3% |
| University of New Hampshire | May 14–18, 2020 | 790 (LV) | – | 46% | 44% | - | 5%[qb] | 5% |
| Saint Anselm College | Apr 23–27, 2020 | 820 (RV) | ± 3.4% | 42% | 50% | - | 2% | 7% |
| University of New Hampshire | Feb 19–25, 2020 | 569 (LV) | ± 4.1% | 46% | 44% | - | 8%[qc] | 2% |
| AtlasIntel | Feb 8–10, 2020 | 1,100 (RV) | ± 3% | 46% | 44% | - | 11% | – |
| McLaughlin & Associates/NH Journal[20] | Feb 4–5, 2020 | 400 (LV) | ± 4.9% | 49%[qd] | 45% | - | –[qe] | –[qe] |
| Marist College/NBC News | Jan 20–23, 2020 | 2,223 (RV) | ± 2.6% | 43% | 51% | - | 2% | 5% |
| Emerson College | Nov 23–26, 2019 | 637 (RV) | ± 3.8% | 48% | 52% | - | – | – |
| 547 (RV) | ± 4.1% | 42% | 46% | - | – | 13% | ||
| Saint Anselm College | Nov 13–18, 2019 | 512 (RV) | ± 4.3% | 43% | 51% | - | – | 6% |
| Emerson College | Sep 6–9, 2019 | 1,041 (RV) | ± 3.0% | 45% | 55% | - | – | – |
| Gravis Marketing | Aug 2–6, 2019 | 505 (RV) | ± 4.4% | 40% | 53% | - | – | 7% |
| Emerson College Archived February 23, 2019, at the Wayback Machine | Feb 21–22, 2019 | 910 (RV) | ± 3.2% | 45% | 55% | - | – | – |
| American Research Group | Mar 21–27, 2018 | 1,365 (RV) | ± 3.0% | 39% | 53% | - | – | 8% |
New Jersey
Graphical summary
Graphs are unavailable due to technical issues. There is more info on Phabricator and on MediaWiki.org. |
Aggregate polls
| Source of poll aggregation |
Dates administered |
Dates updated |
Joe Biden Democratic |
Donald Trump Republican |
Other/ Undecided [a] |
Margin |
|---|---|---|---|---|---|---|
| 270 to Win | October 9 – November 2, 2020 | November 3, 2020 | 56.5% | 37.3% | 6.2% | Biden +19.2 |
| Real Clear Politics | September 4 – October 13, 2020 | November 3, 2020 | 54.7% | 37.3% | 8.0% | Biden +17.4 |
| FiveThirtyEight | until November 2, 2020 | November 3, 2020 | 58.4% | 37.9% | 3.7% | Biden +20.4 |
| Average | 56.5% | 37.5% | 7.8% | Biden +19.0 | ||
- Polls
| Poll source | Date(s) administered |
Sample size[dk] |
Margin of error |
Donald Trump Republican |
Joe Biden Democratic |
Jo Jorgensen Libertarian |
Howie Hawkins Green |
Other | Undecided |
|---|---|---|---|---|---|---|---|---|---|
| SurveyMonkey/Axios | Oct 20 – Nov 2, 2020 | 3,870 (LV) | ± 2% | 38%[qf] | 59% | - | - | – | – |
| Research Co. | Oct 31 – Nov 1, 2020 | 450 (LV) | ± 4.6% | 40% | 59% | - | - | 1%[qg] | 5% |
| Swayable Archived November 13, 2020, at the Wayback Machine | Oct 27 – Nov 1, 2020 | 324 (LV) | ± 7.2% | 40% | 59% | 1% | 0% | – | – |
| SurveyMonkey/Axios | Oct 1–28, 2020 | 6,472 (LV) | – | 37% | 60% | - | - | – | – |
| Swayable | Oct 23–26, 2020 | 386 (LV) | ± 6.5% | 38% | 62% | 0% | 0% | – | – |
| Rutgers-Eagleton | Oct 19–24, 2020 | 834 (LV) | ± 4% | 37% | 59% | - | - | 1%[qh] | 1% |
| Stockton College | Oct 7–13, 2020 | 721 (LV) | ± 3.7% | 36% | 56% | - | - | – | – |
| DKC Analytics/Brach Eichler | Oct 5–13, 2020 | 500 (LV) | ± 4.4% | 34% | 56% | - | - | 10%[qi] | – |
| Fairleigh Dickinson University | Sep 30 – Oct 5, 2020 | 582 (LV) | ± 4.6% | 38% | 53% | - | - | 5%[qj] | 4% |
| SurveyMonkey/Axios | Sep 1–30, 2020 | 2,952 (LV) | – | 37% | 60% | - | - | – | 3% |
| DKC Analytics/Brach Eichler | Sep 8–16, 2020 | 501 (LV) | ± 4.4% | 38% | 52% | - | - | 10%[qi] | – |
| Emerson College | Sep 4–7, 2020 | 500 (LV) | ± 4.4% | 40%[qk] | 58% | - | - | 2%[ql] | – |
| SurveyMonkey/Axios | Aug 1–31, 2020 | 2,309 (LV) | – | 40% | 57% | - | - | – | 3% |
| DKC Analytics/Brach Eichler | Aug 5–13, 2020 | 500 (LV) | ± 4.383% | 33% | 52% | - | - | 15%[qm] | – |
| SurveyMonkey/Axios | Jul 1–31, 2020 | 2,426 (LV) | – | 37% | 61% | - | - | – | 2% |
| Pollfish/DKC Analytics/Brach Eichler | Jul 7–12, 2020 | 500 (LV) | ± 4.383% | 33% | 51% | - | - | 7%[qn] | 8% |
| SurveyMonkey/Axios | Jun 8–30, 2020 | 1,110 (LV) | – | 37% | 61% | - | - | – | 3% |
| Quinnipiac | Apr 30 – May 4, 2020 | 941 (RV) | ± 3.2% | 35% | 54% | - | - | 3%[qo] | 8% |
| Rutgers-Eagleton | Apr 22 – May 2, 2020 | 689 (RV) | ± 4.2% | 33% | 56% | - | - | 5%[qp] | 7% |
| Monmouth University | Apr 16–19, 2020 | 635 (RV) | ± 3.9% | 38% | 54% | - | - | 2% | 6% |
| Fairleigh Dickinson University | Feb 12–16, 2020 | 715 (RV) | – | 35% | 53% | - | - | – | – |
New Mexico
Graphical summary
Graphs are unavailable due to technical issues. There is more info on Phabricator and on MediaWiki.org. |
Aggregate polls
| Source of poll aggregation |
Dates administered |
Dates updated |
Joe Biden Democratic |
Donald Trump Republican |
Other/ Undecided [a] |
Margin |
|---|---|---|---|---|---|---|
| 270 to Win | October 6 – November 1, 2020 | November 3, 2020 | 53.5% | 40.5% | 6.0% | Biden +13.0 |
| FiveThirtyEight | until November 2, 2020 | November 3, 2020 | 53.8% | 42.3% | 3.9% | Biden +11.5 |
| Average | 53.7% | 41.4% | 4.9% | Biden +12.3 | ||
Polls
| Poll source | Date(s) administered |
Sample size[dk] |
Margin of error |
Donald Trump Republican |
Joe Biden Democratic |
Jo Jorgensen Libertarian |
Howie Hawkins Green |
Other | Undecided |
|---|---|---|---|---|---|---|---|---|---|
| SurveyMonkey/Axios | Oct 20 – Nov 2, 2020 | 1,481 (LV) | ± 3.5% | 42%[qq] | 56% | – | – | – | – |
| Research & Polling Inc./Albuquerque Journal | Oct 23–29, 2020 | 1,180 (LV) | ± 2.9% | 42% | 54% | – | – | 3%[qr] | 1% |
| SurveyMonkey/Axios | Oct 1–28, 2020 | 2,719 (LV) | – | 46% | 52% | – | – | – | – |
| GBAO Strategies/Ben Ray Luján (D)[BY] | Oct 14–17, 2020 | 600 (LV) | ± 4.0% | 41% | 54% | – | – | – | – |
| Public Policy Polling/NM Political Report | Sep 30 – Oct 1, 2020 | 886 (LV) | ± 3.3% | 39% | 53% | 2% | – | 2%[qs] | 4% |
| SurveyMonkey/Axios | Sep 1–30, 2020 | 1,015 (LV) | – | 44% | 54% | – | – | – | 1% |
| Research & Polling Inc./Albuquerque Journal | Aug 26 – Sep 2, 2020 | 1,123 (LV) | ± 2.9% | 39% | 54% | – | – | – | – |
| SurveyMonkey/Axios | Aug 1–31, 2020 | 1,087 (LV) | – | 43% | 56% | – | – | – | 2% |
| SurveyMonkey/Axios | Jul 1–31, 2020 | 904 (LV) | – | 48% | 49% | – | – | – | 2% |
| SurveyMonkey/Axios | Jun 8–30, 2020 | 506 (LV) | – | 50% | 49% | – | – | – | 1% |
| Public Policy Polling/NM Political Report | Jun 12–13, 2020 | 740 (V) | ± 3.6% | 39% | 53% | – | – | – | 8% |
| Public Policy Polling/The Majority Institute Archived April 25, 2020, at the Wayback Machine[BZ] | Apr 20–21, 2020 | 1,091 (RV) | ± 3.1% | 40% | 52% | – | – | – | – |
| Emerson College | Jan 3–6, 2020 | 967 (RV) | ± 3.1% | 46% | 54% | – | – | – | – |
New York
Graphical summary
Graphs are unavailable due to technical issues. There is more info on Phabricator and on MediaWiki.org. |
Aggregate polls
| Source of poll aggregation |
Dates administered |
Dates updated |
Joe Biden Democratic |
Donald Trump Republican |
Other/ Undecided [a] |
Margin |
|---|---|---|---|---|---|---|
| Real Clear Politics | April 30 – September 29, 2020 | November 3, 2020 | 59.7% | 31.0% | 9.3% | Biden +28.7 |
| FiveThirtyEight | until November 2, 2020 | November 3, 2020 | 62.3% | 32.9% | 4.8% | Biden +29.4 |
| Average | 61.0% | 32.0% | 7.1% | Biden +29.1 | ||
Polls
| Poll source | Date(s) administered |
Sample size[dk] |
Margin of error |
Donald Trump Republican |
Joe Biden Democratic |
Jo Jorgensen Libertarian |
Howie Hawkins Green |
Other | Undecided |
|---|---|---|---|---|---|---|---|---|---|
| SurveyMonkey/Axios | Oct 20 – Nov 2, 2020 | 6,548 (LV) | ± 2% | 35%[qt] | 63% | – | – | – | – |
| Research Co. | Oct 31 – Nov 1, 2020 | 450 (LV) | ± 4.6% | 34% | 64% | - | - | 2%[qu] | 4% |
| SurveyMonkey/Axios | Oct 1–28, 2020 | 10,220 (LV) | – | 34% | 63% | - | - | – | – |
| Swayable | Oct 23–26, 2020 | 495 (LV) | ± 5.8% | 33% | 65% | 1% | 1% | – | – |
| SurveyMonkey/Axios | Sep 1–30, 2020 | 10,007 (LV) | – | 34% | 64% | - | - | – | 2% |
| Siena College[permanent dead link] | Sep 27–29, 2020 | 504 (LV) | ± 4.4% | 29% | 61% | 0% | 1% | 2%[qv] | 7% |
| SurveyMonkey/Axios | Aug 1–31, 2020 | 9,969 (LV) | – | 34% | 64% | - | - | – | 2% |
| Public Policy Polling | Aug 20–22, 2020 | 1,029 (V) | ± 3.1% | 32% | 63% | - | - | – | 5% |
| SurveyMonkey/Axios | Jul 1–31, 2020 | 10,280 (LV) | – | 34% | 63% | - | - | – | 2% |
| SurveyMonkey/Axios | Jun 8–30, 2020 | 4,555 (LV) | – | 33% | 65% | - | - | – | 2% |
| Siena College | Jun 23–25, 2020 | 806 (RV) | ± 3.9% | 32% | 57% | - | - | – | 10% |
| Siena College | May 17–21, 2020 | 767 (RV) | ± 3.7% | 32% | 57% | - | - | – | 11% |
| Quinnipiac University | Apr 30 – May 4, 2020 | 915 (RV) | ± 3.2% | 32% | 55% | - | - | 5%[qw] | 8% |
| Siena College | Apr 19–23, 2020 | 803 (RV) | ± 3.7% | 29% | 65% | - | - | – | 6% |
| Siena College | Mar 22–26, 2020 | 566 (RV) | ± 4.5% | 33% | 58% | - | - | – | 10% |
| Siena College | Feb 16–20, 2020 | 658 (RV) | ± 4.5% | 36% | 55% | - | - | – | 5% |
North Carolina
Graphical summary
Graphs are unavailable due to technical issues. There is more info on Phabricator and on MediaWiki.org. |
Aggregate polls
| Source of poll aggregation |
Dates administered |
Dates updated |
Joe Biden Democratic |
Donald Trump Republican |
Other/ Undecided [a] |
Margin |
|---|---|---|---|---|---|---|
| 270 to Win | October 31 – November 2, 2020 | November 3, 2020 | 47.8% | 47.5% | 4.7% | Biden +0.3 |
| Real Clear Politics | October 26 – November 1, 2020 | November 3, 2020 | 47.6% | 47.8% | 4.6% | Trump +0.2 |
| FiveThirtyEight | until November 2, 2020 | November 3, 2020 | 48.9% | 47.1% | 4.0% | Biden +1.8 |
| Average | 48.1% | 47.5% | 4.4% | Biden +0.6 | ||
June 1 – October 31, 2020
| Poll source | Date(s) administered |
Sample size[dk] |
Margin of error |
Donald Trump Republican |
Joe Biden Democratic |
Jo Jorgensen Libertarian |
Howie Hawkins Green |
Other | Undecided |
|---|---|---|---|---|---|---|---|---|---|
| SurveyMonkey/Axios | Oct 20 – Nov 2, 2020 | 5,363 (LV) | ± 2% | 48%[qx] | 50% | - | - | – | – |
| Change Research/CNBC | Oct 29 – Nov 1, 2020 | 473 (LV) | ± 4.51% | 47% | 49% | 2% | 1% | – | 1% |
| Swayable Archived November 13, 2020, at the Wayback Machine | Oct 27 – Nov 1, 2020 | 690 (LV) | ± 5.3% | 46% | 52% | 1% | 0% | – | – |
| Ipsos/Reuters | Oct 27 – Nov 1, 2020 | 707 (LV) | ± 4.2% | 48%[o] | 49% | 1% | 1% | 2%[qy] | – |
| 48%[qz] | 49% | - | - | 3%[af] | 1% | ||||
| 48%[ra] | 50% | - | - | 2%[du] | – | ||||
| Data for Progress | Oct 27 – Nov 1, 2020 | 908 (LV) | ± 3.3% | 48% | 50% | 1% | 1% | 0%[rb] | – |
| Frederick Polls/Compete Everywhere[CA] | Oct 30–31, 2020 | 676 (LV) | ± 3.7% | 49% | 51% | - | - | – | – |
| AtlasIntel | Oct 30–31, 2020 | 812 (LV) | ± 3.0% | 50% | 48% | - | - | 3% | – |
| Insider Advantage/Center for American Greatness[H] | Oct 30–31, 2020 | 450 (LV) | ± 4.6% | 48% | 44% | 2% | - | – | 7% |
| Emerson College | Oct 29–31, 2020 | 855 (LV) | ± 3.3% | 47%[ai] | 47% | - | - | 6%[rc] | – |
| Morning Consult | Oct 22–31, 2020 | 1,982 (LV) | ± 2% | 48% | 49% | - | - | – | – |
| CNN/SSRS | Oct 23–30, 2020 | 901 (LV) | ± 4.1% | 45% | 51% | 2% | 1% | 1%[rd] | 1% |
| Pulse Opinion Research/Rasmussen Reports | Oct 28–29, 2020 | 800 (LV) | ± 3.5% | 48% | 47% | - | - | 2%[du] | – |
| Trafalgar Group | Oct 27–29, 2020 | 1,082 (LV) | ± 2.9% | 49% | 47% | 3% | - | 1%[dn] | 1% |
| Redfield & Wilton Strategies | Oct 26–29, 2020 | 1,489 (LV) | – | 47% | 49% | 2% | 0% | 0% | 2% |
| Harvard-Harris/The Hill | Oct 26–29, 2020 | 903 (LV) | – | 48% | 49% | - | - | – | 3% |
| East Carolina University | Oct 27–28, 2020 | 1,103 (LV) | ± 3.4% | 48%[ai] | 50% | - | - | 2%[re] | 0%[rf] |
| Cardinal Point Analytics (R)/NSJ | Oct 27–28, 2020 | 750 (LV) | ± 3.6% | 48% | 46% | 1% | 1% | 2%[rg] | 2% |
| Marist College/NBC | Oct 25–28, 2020 | 800 (LV) | ± 4.7% | 46% | 52% | - | - | 2% | 1% |
| SurveyMonkey/Axios | Oct 1–28, 2020 | 8,720 (LV) | – | 47% | 52% | - | - | – | – |
| Gravis Marketing | Oct 26–27, 2020 | 614 (LV) | ± 4% | 46% | 49% | - | - | – | 4% |
| Public Policy Polling/Protect Our Care[CB] | Oct 26–27, 2020 | 937 (V) | ± 3.2% | 47% | 51% | - | - | – | 3% |
| Meeting Street Insights/Carolina Partnership for Reform (R) Archived October 31, 2020, at the Wayback Machine | Oct 24–27, 2020 | 600 (LV) | ± 4% | 45% | 48% | - | - | – | – |
| Siena College/NYT Upshot | Oct 23–27, 2020 | 1,034 (LV) | ± 3.4% | 45% | 48% | 2% | 1% | 0%[dw] | 4%[og] |
| Ipsos/Reuters | Oct 21–27, 2020 | 647 (LV) | ± 4.4% | 48%[o] | 49% | 1% | 1% | 1%[rh] | – |
| 48%[qz] | 49% | - | - | 2%[r] | 1% | ||||
| RMG Research/PoliticalIQ | Oct 24–26, 2020 | 800 (LV) | ± 3.5% | 47%[o] | 48% | - | - | 3%[ri] | 2% |
| 46%[dy] | 50% | - | - | 3%[ri] | 2% | ||||
| 49%[dz] | 47% | - | - | 3%[ri] | 2% | ||||
| Swayable | Oct 23–26, 2020 | 396 (LV) | ± 6.8% | 48% | 50% | 2% | 0% | – | – |
| SurveyUSA/WRAL-TV | Oct 23–26, 2020 | 627 (LV) | ± 4.9% | 48% | 48% | - | - | 2%[du] | 2% |
| YouGov/UMass Amherst | Oct 20–26, 2020 | 911 (LV) | ± 4.2% | 48% | 48% | 1% | 0% | 1%[rj] | 2% |
| Wick Surveys | Oct 24–25, 2020 | 1,000 (LV) | ± 3.1% | 49% | 47% | - | - | – | – |
| Harper Polling/Civitas (R) | Oct 22–25, 2020 | 504 (LV) | ± 4.37% | 46% | 47% | 1% | 0% | 0%[rk] | 6% |
| YouGov/CBS | Oct 20–23, 2020 | 1,022 (LV) | ± 4.1% | 47% | 51% | – | – | 2%[rl] | 0% |
| Trafalgar Group | Oct 20–22, 2020 | 1,098 (LV) | ± 2.9% | 48.8% | 46% | 2.3% | 0.4% | 0.8%[rm] | 1.7% |
| Citizen Data | Oct 17–20, 2020 | 1000 (LV) | ± 3.1% | 44% | 50% | 1% | 0.2% | 1.3% | 3.6% |
| Pulse Opinion Research/Rasmussen Reports | Oct 20–21, 2020 | 800 (LV) | ± 3.5% | 48% | 47% | - | - | 2%[du] | 3% |
| Ipsos/Reuters | Oct 14–20, 2020 | 660 (LV) | ± 4.3% | 47%[o] | 49% | 1% | 1% | 1%[rh] | – |
| 46%[qz] | 49% | - | - | 2%[r] | 2% | ||||
| Morning Consult | Oct 11–20, 2020 | 1,904 (LV) | ± 2.2% | 47% | 50% | - | - | – | – |
| Meredith College | Oct 16–19, 2020 | 732 (LV) | ± 3.5% | 44% | 48% | 1% | 1% | 0%[rn] | 4% |
| Change Research/CNBC | Oct 16–19, 2020 | 521 (LV)[al] | – | 47% | 50% | - | - | – | – |
| Data for Progress (D) | Oct 15–18, 2020 | 929 (LV) | ± 3.2% | 44% | 48% | 1% | 1% | – | 5% |
| East Carolina University | Oct 15–18, 2020 | 1,155 (LV) | ± 3.4% | 47%[ai] | 51% | - | - | 2%[ro] | 0% |
| ABC/Washington Post | Oct 12–17, 2020 | 646 (LV) | ± 4.5% | 48%[o] | 49% | 1% | 0%[rf] | 0%[rp] | 1% |
| 48%[rq] | 50% | - | - | 0%[rp] | 1% | ||||
| Emerson College | Oct 11–14, 2020 | 721 (LV) | ± 3.6% | 49%[ai] | 49% | - | - | 2%[ah] | – |
| Civiqs/Daily Kos | Oct 11–14, 2020 | 1,211 (LV) | ± 3.3% | 46% | 51% | - | - | 2%[ah] | 1% |
| Redfield & Wilton Strategies | Oct 10–13, 2020 | 994 (LV) | – | 46%[al] | 49% | 1% | 0% | – | – |
| Siena College/NYT Upshot | Oct 9–13, 2020 | 627 (LV) | ± 4.5% | 42% | 46% | 2% | 1% | 1%[rr] | 8%[og] |
| Ipsos/Reuters | Oct 7–13, 2020 | 660 (LV) | ± 4.3% | 48%[o] | 48% | 2% | 0% | 1%[rh] | – |
| 47%[qz] | 48% | - | - | 3%[af] | 3% | ||||
| Monmouth University | Oct 8–11, 2020 | 500 (RV) | ± 4.4% | 46% | 49% | 3% | 0% | 0%[rs] | 2% |
| 500 (LV)[rt] | 46% | 50% | - | - | 2% | 2% | |||
| 500 (LV)[ru] | 48% | 49% | - | - | 2% | 1% | |||
| SurveyUSA/WRAL-TV | Oct 8–11, 2020 | 669 (LV) | ± 4.8% | 45% | 50% | - | - | 2%[du] | 3% |
| Susquehanna Polling & Research Inc./American Greatness PAC[H] | Oct 7–11, 2020 | 500 (LV) | ± 4.3% | 46% | 48% | 2% | - | 1%[rv] | 4% |
| RMG Research/PoliticalIQ | Oct 7–11, 2020 | 800 (LV) | – | 45%[o] | 47% | 2% | 1% | 1% | 4% |
| 43%[dy] | 49% | 2% | 1% | 1% | 4% | ||||
| 47%[dz] | 44% | 2% | 1% | 1% | 4% | ||||
| Morning Consult | Oct 2–11, 2020 | 1,993 (LV) | ± 2.2% | 46% | 50% | - | - | – | – |
| YouGov/CCES Archived November 1, 2020, at the Wayback Machine | Sep 29 – Oct 7, 2020 | 1,627 (LV) | – | 45% | 49% | - | - | – | – |
| Redfield & Wilton Strategies | Oct 9–10, 2020 | 750 (LV) | – | 42%[al] | 49% | 1% | 0% | – | – |
| Redfield & Wilton Strategies | Oct 4–6, 2020 | 938 (LV) | ± 3.2% | 44% | 49% | 1% | 0% | 0%[lp] | 5% |
| Ipsos/Reuters | Sep 29 – Oct 6, 2020 | 693 (LV) | ± 4.2% | 47% | 47% | - | - | 2%[r] | 3% |
| Public Policy Polling | Oct 4–5, 2020 | 911 (V) | – | 46% | 50% | - | - | – | 3% |
| Data For Progress (D) | Sep 30 – Oct 5, 2020 | 1,285 (LV) | ± 2.7% | 44% | 51% | 2% | 0% | – | 3% |
| Change Research/CNBC | Oct 2–4, 2020 | 396 (LV) | – | 47% | 49% | - | - | – | – |
| East Carolina University | Oct 2–4, 2020 | 1,232 (LV) | ± 3.2% | 46% | 50% | - | - | 2%[rw] | 2% |
| SurveyMonkey/Axios | Sep 1–30, 2020 | 3,495 (LV) | – | 46% | 52% | - | - | – | 2% |
| ALG Research/Piedmont Rising[CC] | Sep 22–28, 2020 | 822 (V) | – | 47% | 50% | - | - | – | – |
| Hart Research Associates/Human Rights Campaign[CD] | Sep 24–27, 2020 | 400 (LV) | ± 4.9% | 47% | 49% | - | - | – | – |
| Redfield & Wilton Strategies | Sep 23–26, 2020 | 1,097 (LV) | ± 2.96% | 45% | 47% | 2% | 0% | 1%[aw] | 6% |
| YouGov/CBS | Sep 22–25, 2020 | 1,213 (LV) | ± 3.6% | 46% | 48% | - | - | 2%[rx] | 4% |
| YouGov/UMass Lowell | Sep 18–25, 2020 | 921 (LV) | ± 4.1% | 47%[o] | 47% | 2% | 1% | 0%[ry] | 2% |
| 49%[rz] | 48% | - | - | 2%[sa] | 2% | ||||
| Meredith College | Sep 18–22, 2020 | 705 (RV) | ± 3.5% | 45% | 46% | 2% | 0% | 1%[sb] | 6% |
| Change Research/CNBC | Sep 18–20, 2020 | 579 (LV) | – | 46% | 48% | - | - | – | – |
| Harper Polling/Civitas (R) | Sep 17–20, 2020 | 612 (LV) | ± 3.96% | 45% | 44% | 2% | 0% | 0%[rn] | 8% |
| Emerson College | Sep 16–18, 2020 | 717 (LV) | ± 3.6% | 49%[ai] | 51% | - | - | – | – |
| Siena College/NYT Upshot | Sep 11–16, 2020 | 653 (LV) | ± 4.3% | 44% | 45% | 2% | 1% | 0%[dw] | 8%[og] |
| Ipsos/Reuters | Sep 11–16, 2020 | 586 (LV) | ± 4.6% | 47% | 47% | - | - | 3%[af] | 3% |
| Redfield & Wilton Strategies | Sep 12–15, 2020 | 1,092 (LV) | ± 2.97% | 45% | 47% | 1% | 1% | 0%[lp] | 5% |
| Suffolk University/USA Today | Sep 11–14, 2020 | 500 (LV) | – | 42.8% | 46.2% | 4.8% | 0.2% | 1.8%[sc] | 4.2% |
| SurveyUSA/WRAL TV | Sep 10–13, 2020 | 596 (LV) | ± 5.6% | 47% | 47% | - | - | 2%[du] | 5% |
| CNN/SSRS | Sep 9–13, 2020 | 787 (LV) | ± 3.9% | 46% | 49% | 2% | 1% | 0%[sd] | 2% |
| Kaiser Family Foundation/Cook Political Report | Aug 29 – Sep 13, 2020 | 1,172 (RV) | ± 3% | 43% | 45% | - | - | 4%[se] | 9% |
| Trafalgar | Sep 9–11, 2020 | 1,046 (LV) | ± 3% | 47.8% | 46.1% | 1.6% | 0.5% | 1.5%[sf] | 2.5% |
| Pulse Opinion Research/Rasmussen Reports[21] | Sep 7–8, 2020 | 1,000 (LV) | ± 3% | 49%[ai] | 48% | - | - | 3%[sg] | – |
| Benenson Strategy Group/GS Group/AARP | Aug 28 – Sep 8, 2020 | 1,600 (LV) | ± 2.5% | 48% | 48% | - | - | 1%[sh] | 4% |
| Morning Consult | Aug 29 – Sep 7, 2020 | 1,592 (LV) | ± (2%-4%) | 47%[si] | 48% | - | - | – | – |
| Change Research/CNBC | Sep 4–6, 2020 | 442 (LV) | – | 47% | 49% | - | - | 4%[sj] | – |
| Redfield & Wilton Strategies | Aug 30 – Sep 3, 2020 | 951 (LV) | ± 3.18% | 44% | 43% | 1% | 1% | 1%[aw] | 9% |
| Monmouth University | Aug 29 – Sep 1, 2020 | 401 (RV) | ± 4.9% | 45% | 47% | 3% | 0% | 1%[sk] | 3% |
| 401 (LV)[sl] | 46% | 48% | - | - | 3% | 3% | |||
| 401 (LV)[sm] | 46% | 48% | - | - | 3% | 3% | |||
| Fox News | Aug 29 – Sep 1, 2020 | 722 (LV) | ± 3.5% | 46% | 50% | 1% | 0% | 0%[sn] | 2% |
| 804 (RV) | ± 3.5% | 45% | 49% | 2% | 1% | 2%[so] | 3% | ||
| SurveyMonkey/Axios | Aug 1–31, 2020 | 2,914 (LV) | – | 51% | 48% | - | - | – | 2% |
| East Carolina University | Aug 29–30, 2020 | 1,101 (LV) | ± 3.4% | 49% | 47% | - | - | 2%[du] | 3% |
| Morning Consult | Aug 21–30, 2020 | 1,567 (LV) | ± (2%–4%) | 47% | 49% | - | - | – | – |
| Change Research/CNBC | Aug 21–23, 2020 | 560 (LV) | – | 47% | 48% | – | – | – | – |
| Morning Consult | Aug 14–23, 2020 | 1,541 (LV) | ± 2.0% | 46% | 49% | – | – | 1%[dn] | 3% |
| Redfield & Wilton Strategies | Aug 16–17, 2020 | 967 (LV) | ± 3.09% | 46% | 44% | 2% | 0% | 1%[aw] | 7% |
| Morning Consult | Aug 7–16, 2020 | 1,493 (LV) | ± (2%–4%) | 46% | 49% | - | - | – | – |
| East Carolina University | Aug 12–13, 2020 | 1,255 (RV) | ± 3.2% | 47% | 47% | – | – | 3%[sp] | 4% |
| Emerson College | Aug 8–10, 2020 | 673 (LV) | ± 3.8% | 51%[sq] | 49% | – | – | – | – |
| Harper Polling/Civitas | Aug 6–10, 2020 | 600 (LV) | ± 4.0% | 44% | 45% | 2% | 1% | 1%[sb] | 7% |
| Change Research/CNBC | Aug 7–9, 2020 | 493 (LV) | – | 48% | 47% | – | – | – | – |
| Pulse Opinion Research/Rasmussen Reports/American Greatness PAC[H] | Aug 6–8, 2020 | 750 (LV) | ± 3.6% | 48%[al] | 47% | – | – | – | – |
| Data for Progress | Jul 24 – Aug 2, 2020 | 1,170 (LV) | – | 45% | 49% | – | – | – | 6% |
| 44% | 46% | 2% | 1% | – | 7% | ||||
| Public Policy Polling/Giffords[CE] | Jul 30–31, 2020 | 934 (V) | – | 46% | 49% | – | – | – | 6% |
| YouGov/CBS | Jul 28–31, 2020 | 1,129 (LV) | ± 3.9% | 44% | 48% | – | – | 2%[sr] | 5% |
| HIT Strategies/DFER[CF] | Jul 23–31, 2020 | 400 (RV) | ± 4.9% | 37% | 47% | – | – | 4%[ss] | 10%[og] |
| SurveyMonkey/Axios | Jul 1–31, 2020 | 3,466 (LV) | – | 50% | 49% | - | - | – | 2% |
| Change Research/CNBC[22] | Jul 24–26, 2020 | 284 (LV) | – | 46% | 49% | – | – | – | – |
| Morning Consult | Jul 17–26, 2020 | 1,504 (LV) | ± 2.5% | 47% | 47% | – | – | – | – |
| Public Policy Polling/AFSCME[F] | Jul 23–24, 2020 | 884 (V) | – | 46% | 49% | – | – | – | 5% |
| Cardinal Point Analytics Archived July 30, 2020, at the Wayback Machine | Jul 22–24, 2020 | 735 (LV) | ± 3.6% | 48% | 47% | 1% | – | – | 4% |
| Zogby Analytics | Jul 21–23, 2020 | 809 (RV) | ± 3.4% | 40% | 44% | 4% | 1% | – | 11% |
| Marist College/NBC News | Jul 14–22, 2020 | 882 (RV) | ± 4.0% | 44% | 51% | – | – | 2% | 4% |
| Redfield & Wilton Strategies | Jul 19–21, 2020 | 919 (LV) | – | 42% | 43% | 2% | 1% | 1% | 11% |
| Spry Strategies/American Principles Project[CG] | Jul 11–16, 2020 | 600 (LV) | ± 3.7% | 49% | 46% | – | – | – | 5% |
| Cardinal Point Analytics | Jul 13–15, 2020 | 547 (LV) | ± 4.2% | 49% | 48% | 1% | – | – | 3% |
| Change Research/CNBC | Jul 10–12, 2020 | 655 (LV) | – | 46% | 47% | – | – | – | – |
| Public Policy Polling | Jul 7–8, 2020 | 818 (V) | ± 3.4% | 46% | 50% | – | – | – | 5% |
| SurveyMonkey/Axios | Jun 8–30, 2020 | 1,498 (LV) | – | 49% | 49% | - | - | – | 1% |
| Change Research/CNBC | Jun 26–28, 2020 | 468 (LV)[al] | – | 44% | 51% | – | – | – | – |
| East Carolina University | Jun 22–25, 2020 | 1,149 (RV) | ± 3.4% | 44% | 45% | – | – | 7%[st] | 4% |
| Public Policy Polling | Jun 22–23, 2020 | 1,157 (V) | – | 46% | 48% | – | – | – | 6% |
| Fox News | Jun 20–23, 2020 | 1,012 (RV) | ± 3% | 45% | 47% | – | – | 5%[su] | 3% |
| NYT Upshot/Siena College | Jun 8–18, 2020 | 653 (RV) | ± 4.1% | 40% | 49% | – | – | 4%[sv] | 7% |
| Gravis Marketing/OANN | Jun 17, 2020 | 631 (RV) | ± 3.9% | 46% | 43% | – | – | – | 10% |
| Redfield & Wilton Strategies | Jun 14–17, 2020 | 902 (LV) | ± 3.26% | 40% | 46% | 1% | 0% | 1% | 11% |
| Change Research/CNBC | Jun 12–14, 2020 | 378 (LV)[al] | – | 45% | 47% | 1% | 1% | – | – |
| Public Policy Polling[23] | Jun 2–3, 2020 | 913 (V) | ± 3.2% | 45% | 49% | – | – | – | 6% |
January 1, 2020 – May 31, 2020
| Poll source | Date(s) administered |
Sample size[dk] |
Margin of error |
Donald Trump Republican |
Joe Biden Democratic |
Other | Undecided |
|---|---|---|---|---|---|---|---|
| Change Research/CNBC | May 29–31, 2020 | 806 (LV) | – | 45% | 46% | 4% | 4% |
| Harper Polling/Civitas | May 26–28, 2020 | 500 (LV) | ± 4.38% | 47% | 44% | – | 9% |
| Morning Consult | May 17–26, 2020 | 1,403 (LV) | – | 49% | 46% | – | – |
| Neighbourhood Research & Media | May 12–21, 2020 | 391 (LV) | – | 42% | 42% | – | – |
| Redfield & Wilton Strategies | May 10–14, 2020 | 859 (LV) | ± 3.3% | 43% | 45% | 3%[sw] | 8% |
| Meeting Street Insights (R) Archived June 5, 2020, at the Wayback Machine | May 9–13, 2020 | 500 (RV) | – | 47% | 47% | – | 6% |
| East Carolina University | May 7–9, 2020 | 1,111 (RV) | ± 3.4% | 46% | 43% | 7%[sx] | 4% |
| Civiqs/Daily Kos | May 2–4, 2020 | 1,362 (RV) | ± 3% | 46% | 49% | 4%[sy] | 2% |
| Meredith College | Apr 27–28, 2020 | 604 (RV) | ± 4.0% | 40% | 47% | 5%[sz] | 7% |
| SurveyUSA | Apr 23–26, 2020 | 580 (LV) | ± 5.5% | 45% | 50% | – | 5% |
| Public Policy Polling[CH] | Apr 20–21, 2020 | 1,275 (RV) | – | 46% | 49% | – | 5% |
| Garin-Hart-Yang/Put NC First (D) Archived April 30, 2020, at the Wayback Machine | Apr 13–18, 2020 | 800 (LV) | – | 45% | 48% | – | – |
| GBAO Strategies/PLUS Paid Family Leave Archived May 16, 2020, at the Wayback Machine | Apr 13–16, 2020 | 500 (LV) | – | 46% | 48% | 1% | 4% |
| Public Policy Polling | Apr 14–15, 2020 | 1,318 (V) | – | 47% | 48% | – | 5% |
| Harper Polling | Apr 5–7, 2020 | 500 (LV) | ± 4.4% | 49% | 42% | – | 9% |
| East Carolina University | Feb 27–28, 2020 | 1,288 (RV) | ± 3.2% | 46% | 48% | – | – |
| NBC News/Marist College | Feb 23–27, 2020 | 2,120 (RV) | ± 2.4% | 45% | 49% | 1% | 5% |
| SurveyUSA | Feb 13–16, 2020 | 2,366 (RV) | ± 2.5% | 45% | 49% | – | 6% |
| Climate Nexus | Feb 11–15, 2020 | 675 (RV) | ± 3.9% | 44% | 46% | – | 11% |
January 1, 2018 – December 31, 2019
| Poll source | Date(s) administered |
Sample size[dk] |
Margin of error |
Donald Trump Republican |
Joe Biden Democratic |
Other | Undecided |
|---|---|---|---|---|---|---|---|
| Fox News | Nov 10–13, 2019 | 1,504 (RV) | ± 2.5% | 43% | 45% | 5% | 5% |
| NYT Upshot/Siena College | Oct 13–26, 2019 | 651 (LV) | ± 4.4% | 48% | 46% | – | – |
| East Carolina University Archived October 14, 2019, at the Wayback Machine | Oct 2–9, 2019 | 1,076 (RV) | ± 3.0% | 46% | 50% | 4% | –[ta] |
| Meredith College | Sep 29 – Oct 7, 2019 | 996 (RV) | ± 3.0% | 38% | 35% | 20%[tb] | 7% |
| Public Policy Polling | Oct 4–6, 2019 | 963 (V) | ± 3.2% | 46% | 51% | – | 4% |
| SurveyUSA | Aug 1–5, 2019 | 2,113 (RV) | ± 2.7% | 41% | 49% | – | 10% |
| Harper Polling | Aug 1–4, 2019 | 500 (LV) | ± 4.4% | 45% | 44% | – | 11% |
| Fabrizio Ward/AARP | Jul 29–31, 2019 | 600 (LV) | ± 4.0% | 45% | 49% | – | 5% |
| Public Policy Polling | Jun 17–18, 2019 | 610 (RV) | ± 4.0% | 46% | 49% | – | 5% |
| Emerson College Archived June 4, 2019, at the Wayback Machine | May 31 – Jun 3, 2019 | 932 (RV) | ± 3.1% | 44% | 56% | – | – |
| Spry Strategies (R)[CI] | May 25 – Jun 1, 2019 | 730 (LV) | – | 52% | 41% | – | 7% |
| Harper Polling | Feb 11–13, 2019 | 500 (LV) | ± 4.4% | 43% | 39% | 7% | 11% |
| Public Policy Polling | Jan 4–7, 2019 | 750 (RV) | ± 3.6% | 44% | 49% | – | 7% |
| Meredith College | Jan 21–25, 2018 | 621 (RV) | ± 4.0% | 45% | 46% | 8% | 1% |
North Dakota
Graphical summary
Graphs are unavailable due to technical issues. There is more info on Phabricator and on MediaWiki.org. |
Polls with a sample size of <100 have their sample size entries marked in red to indicate a lack of reliability.
Aggregate polls
| Source of poll aggregation |
Dates administered |
Dates updated |
Joe Biden Democratic |
Donald Trump Republican |
Other/ Undecided [a] |
Margin |
|---|---|---|---|---|---|---|
| 270 to Win | September 26 – October 17, 2020 | October 19, 2020 | 38.0% | 57.5% | 4.5% | Trump +19.5 |
| FiveThirtyEight | until November 2, 2020 | November 3, 2020 | 38.7% | 56.0% | 5.3% | Trump +17.3 |
| Average | 38.4% | 56.8% | 4.8% | Trump +18.4 | ||
Polls
| Poll source | Date(s) administered |
Sample size[dk] |
Margin of error |
Donald Trump Republican |
Joe Biden Democratic |
Jo Jorgensen Libertarian |
Other | Undecided |
|---|---|---|---|---|---|---|---|---|
| SurveyMonkey/Axios | Oct 20 – Nov 2, 2020 | 402 (LV) | ± 7% | 59%[tc] | 39% | – | – | – |
| SurveyMonkey/Axios | Oct 1–28, 2020 | 700 (LV) | – | 57% | 42% | – | – | – |
| SurveyMonkey/Axios | Sep 1–30, 2020 | 249 (LV) | – | 63% | 34% | – | – | 3% |
| DFM Research/North Dakota Voters First | Sep 26–29, 2020 | 460 (A) | ± 4.6% | 51% | 37% | – | 4%[td] | 7% |
| DFM Research/North Dakota Voters First | Sep 12–16, 2020 | 500 (LV) | ± 4.5% | 56% | 37% | – | 3%[te] | 4% |
| SurveyMonkey/Axios | Aug 1–31, 2020 | 269 (LV) | – | 66% | 32% | – | – | 2% |
| SurveyMonkey/Axios | Jul 1–31, 2020 | 261 (LV) | – | 63% | 36% | – | – | 1% |
| SurveyMonkey/Axios | Jun 8–30, 2020 | 88 (LV) | – | 71% | 28% | – | – | 1% |
| DFM Research | Mar 3–5, 2020 | 400 (LV) | ± 4.9% | 55% | 38% | – | 2% | 5% |
| DFM Research | Jan 28 – Feb 1, 2020 | 600 (A) | ± 4.0% | 59% | 34% | – | 2% | 5% |
| 1892 Polling/Doug Burgum[CJ] | Jul 15–17, 2019 | 500 (LV) | ± 4.4% | 60% | 34% | – | – | – |
| DFM Research | May 14–18, 2019 | 400 (A) | ± 4.9% | 54% | 39% | – | 2% | 5% |
Ohio
Graphical summary
Graphs are unavailable due to technical issues. There is more info on Phabricator and on MediaWiki.org. |
Aggregate polls
| Source of poll aggregation |
Dates administered |
Dates updated |
Joe Biden Democratic |
Donald Trump Republican |
Other/ Undecided [a] |
Margin |
|---|---|---|---|---|---|---|
| 270 to Win | November 1–2, 2020 | November 3, 2020 | 46.7% | 47.6% | 5.7% | Trump +0.9 |
| Real Clear Politics | October 28, 2020 – November 1, 2020 | November 3, 2020 | 46.3% | 47.3% | 6.4% | Trump +1.0 |
| FiveThirtyEight | until November 2, 2020 | November 3, 2020 | 46.6% | 47.5% | 5.7% | Trump +0.8 |
| Average | 46.6% | 47.5% | 5.9% | Trump +0.9 | ||
June 1, 2020 – October 31, 2020
| Poll source | Date(s) administered |
Sample size[dk] |
Margin of error |
Donald Trump Republican |
Joe Biden Democratic |
Jo Jorgensen Libertarian |
Howie Hawkins Green |
Other | Undecided |
|---|---|---|---|---|---|---|---|---|---|
| SurveyMonkey/Axios | Oct 20 – Nov 2 | 6,025 (LV) | ± 2% | 51%[tf] | 47% | – | – | – | – |
| Pulse Opinion Research/Rasmussen Reports | Oct 31 – Nov 1 | 800 (LV) | ± 3.5% | 49% | 45% | – | – | 3%[ac] | – |
| Research Co. | Oct 31 – Nov 1 | 450 (LV) | ± 4.6% | 47% | 47% | – | – | 2%[ah] | 4% |
| Swayable Archived November 13, 2020, at the Wayback Machine | Oct 27 – Nov 1 | 516 (LV) | ± 5.8% | 52% | 47% | 1% | 0% | – | – |
| Civiqs/Daily Kos | Oct 29 – Nov 1 | 1,136 (LV) | ± 3% | 49% | 48% | – | – | 1%[dn] | 1% |
| Quinnipiac University | Oct 28 – Nov 1 | 1,440 (LV) | ± 2.6% | 43% | 47% | – | – | 2%[ah] | 8% |
| Survey Monkey/Tableau | Oct 20 – Nov 1 | 5,305 (LV) | ± 2.0% | 50% | 47% | – | – | – | |
| Trafalgar Group | Oct 30–31 | 1,041 (LV) | ± 2.96% | 49% | 44% | – | – | – | – |
| Emerson College | Oct 29–31 | 656 (LV) | ± 3.8% | 49%[ai] | 50% | – | – | 2%[ah] | – |
| Morning Consult | Oct 22–31 | 2,179 (LV) | ± 2% | 49% | 47% | – | – | – | – |
| AtlasIntel | Oct 29–30 | 660 (LV) | ± 4% | 50% | 47% | – | – | 3% | – |
| Gravis Marketing | Oct 27–28 | 613 (LV) | ± 4% | 49% | 47% | – | – | – | 4% |
| SurveyMonkey/Axios | Oct 1–28, 2020 | 8,089 (LV) | – | 51% | 47% | – | – | – | – |
| Quinnipiac University | Oct 23–27 | 1,186 (LV) | ± 2.9% | 43% | 48% | – | – | 1%[dn] | 8% |
| Swayable | Oct 23–26 | 440 (LV) | ± 6.3% | 55% | 44% | 1% | 0% | – | – |
| Wick Surveys | Oct 24–25 | 1,000 (LV) | ± 3.1% | 49% | 47% | – | – | – | – |
| Citizen Data | Oct 17–20 | 1,000 (LV) | ± 3% | 44% | 43% | 2% | 1% | 2% | 8% |
| Fox News | Oct 17–20 | 1,018 (LV) | ± 3% | 48% | 45% | 3% | 1% | 1%[tg] | 3% |
| Morning Consult | Oct 11–20 | 2,271 (LV) | ± 2.1% | 49% | 47% | – | – | – | – |
| Pulse Opinion Research/Rasmussen Reports | Oct 18–19 | 800 (LV) | ± 3.5% | 47% | 48% | – | – | 2%[du] | 4% |
| Quinnipiac University | Oct 8–12 | 1,160 (LV) | ± 2.9% | 47% | 48% | – | – | 2%[ah] | 4% |
| Civiqs/Rust Belt Rising[AY] | Oct 8–11 | 586 (LV) | ± 4.2% | 50% | 47% | – | – | 2%[ah] | 1% |
| Morning Consult | Oct 2–11 | 2,283 (LV) | ± 2.1% | 49% | 46% | – | – | – | – |
| Baldwin Wallace University | Sep 30 – Oct 8 | 1,009 (LV) | ± 3.1% | 47% | 45% | 1% | 0% | 1%[th] | 5% |
| Siena College/NYT Upshot | Oct 2–6 | 661 (LV) | ± 4.3% | 44% | 45% | 2% | 1% | 0%[ti] | 7%[tj] |
| Trafalgar Group | Oct 1–3 | 1,035 (LV) | ± 2.97% | 48% | 44% | 3% | 1% | 1%[dn] | 4% |
| YouGov/CBS | Sep 30 – Oct 2 | 1,114 (LV) | ± 3.7% | 47% | 47% | – | – | 1%[tk] | 5% |
| OnMessage Inc./American Action Forum[J] | Sep 28 – Oct 1 | 800 (LV) | ± 3.46% | 48% | 47% | 2% | 1% | 0%[tl] | 3% |
| SurveyMonkey/Axios | Sep 1–30 | 4,012 (LV) | – | 51% | 47% | – | – | – | 2% |
| Hart Research Associates/Human Rights Campaign[CK] | Sep 24–27 | 400 (LV) | ± 4.9% | 49% | 47% | – | – | – | – |
| Fox News | Sep 20–23 | 830 (LV) | ± 3% | 45% | 50% | 1% | 1% | 0%[tm] | 2% |
| 907 (RV) | ± 3% | 44% | 49% | 1% | 2% | 2%[tn] | 3% | ||
| Quinnipiac University | Sep 17–21 | 1,078 (LV) | ± 3% | 47% | 48% | – | – | 2% | 4% |
| Baldwin Wallace University | Sep 9–22 | 1,011 (LV) | ± 3.3% | 44% | 45% | 2% | 0% | 1%[th] | 7% |
| Civiqs/Rust Belt Rising[AY] | Sep 11–15 | 556 (RV) | ± 4.3% | 48%[to] | 45% | – | – | 5%[tp] | 1% |
| Morning Consult | Aug 29 – Sep 7 | 1,963 (LV) | ± (2%–4%) | 50%[tq] | 45% | – | – | – | – |
| OnMessage Inc./American Action Forum[J] | Aug 31 – Sep 3 | 800 (LV) | ± 3.46% | 51% | 45% | – | – | 2%[tn] | 3% |
| Pulse Opinion Research/Rasmussen Reports[24] | Sep 1–2 | 1,000 (LV) | ± 3% | 47%[ai] | 51% | – | – | 3%[ac] | – |
| ALG Research/Progressive Policy Institute[CL] | Aug 26 – Sep 1 | 500 (LV) | – | 46% | 48% | – | – | – | – |
| SurveyMonkey/Axios | Aug 1–31 | 3,220 (LV) | – | 51% | 48% | – | – | – | 2% |
| Morning Consult | Aug 21–30 | 1,811 (LV) | ± (2%–4%) | 50% | 45% | – | – | – | – |
| Civiqs/Rust Belt Rising[AY] | Aug 13–17 | 631 (RV) | – | 47% | 47% | – | – | 4%[tr] | 2% |
| Morning Consult | Aug 7–16 | 1,744 (LV) | ± (2%–4%) | 49% | 45% | – | – | – | – |
| TargetSmart/Progress Ohio[CM] | Jul 28 – Aug 3 | 1,249 (LV) | ± 3.6% | 46% | 47% | – | – | 8%[ts] | – |
| SurveyMonkey/Axios | Jul 1–31 | 3,694 (LV) | – | 52% | 46% | – | – | – | 2% |
| Morning Consult | Jul 17–26 | 1,741 (LV) | ± 2.3% | 48% | 45% | – | – | – | – |
| YouGov/CBS | Jul 21–24 | 1,211 (LV) | ± 3.6% | 46% | 45% | – | – | 2%[tt] | 7% |
| Zogby Analytics | Jul 21–23 | 805 (RV) | ± 3.5% | 41% | 43% | 4% | 1% | – | 11% |
| Pulse Opinion Research/Rasmussen Reports/AGPAC Archived July 22, 2020, at the Wayback Machine[H] | Jul 15–16 | 750 (LV) | ± 4% | 46% | 50% | – | – | 2%[du] | 2% |
| University of Akron | Jun 24 – Jul 15 | 1,037 (RV) | ± 3.0% | 42% | 46% | – | – | 6%[tu] | 6% |
| SurveyMonkey/Axios | Jun 8–30 | 1,610 (LV) | – | 50% | 49% | – | – | – | 1% |
| Quinnipiac | Jun 18–22 | 1,139 (RV) | ± 2.9% | 45% | 46% | – | – | 4%[tv] | 5% |
| Fox News | May 30 – Jun 2 | 803 (RV) | ± 3.5% | 43% | 45% | – | – | 6%[tw] | 6% |
January 1, 2020 – May 31, 2020
| Poll source | Date(s) administered |
Sample size[dk] |
Margin of error |
Donald Trump Republican |
Joe Biden Democratic |
Other | Undecided | |
|---|---|---|---|---|---|---|---|---|
| Morning Consult | May 17–26 | 1,720 (LV) | – | 50% | 42% | – | – | |
| Emerson College | May 8–10 | 725 (RV) | ± 3.5% | 51%[tx] | 49% | – | – | |
| Baldwin Wallace University/Oakland University/Ohio Northern University | Apr 20–25 | 797 (RV) | ± 3.7% | 44% | 45% | – | 11% | |
| Baldwin Wallace University Great Lakes | Mar 17–25 | 1,025 (RV) | ± 3.3% | 47% | 43% | – | 10% | |
| Change Research | Mar 21–23 | 510 (LV) | – | 52% | 44% | – | 5% | |
| NBC News/Wall Street Journal/Marist College | Mar 10–13 | 1,710 (RV) | ± 2.9% | 45% | 49% | 1% | 5% | |
January 1, 2018 – December 31, 2019
| Poll source | Date(s) administered |
Sample size[dk] |
Margin of error |
Donald Trump Republican |
Joe Biden Democratic |
Other | Undecided |
|---|---|---|---|---|---|---|---|
| Public Policy Polling | Oct 10–11, 2019 | 776 (V) | ± 3.5% | 46% | 48% | – | 6% |
| Climate Nexus[ty] | Oct 1–7, 2019 | 1112 (LV) | ± 2.9% | 47% | 53% | – | – |
| 42% | 48% | – | 10% | ||||
| Emerson College | Sep 29 – October 2, 2019 | 837 (RV) | ± 3.2% | 47% | 53% | – | – |
| Quinnipiac University Archived July 30, 2019, at the Wayback Machine | Jul 17–22, 2019 | 1,431 (RV) | ± 3.2% | 42% | 50% | – | – |
| Public Policy Polling | Nov 27–28, 2018 | 648 (V) | ± 3.9% | 44% | 48% | – | 8% |
Oklahoma
Graphical summary

Aggregate polls
| Source of poll aggregation |
Dates administered |
Dates updated |
Joe Biden Democratic |
Donald Trump Republican |
Other/ Undecided [a] |
Margin |
|---|---|---|---|---|---|---|
| 270 to Win | October 17–21, 2020 | November 3, 2020 | 38.5% | 58.5% | 3.0% | Trump +20.0 |
| FiveThirtyEight | until November 2, 2020 | November 3, 2020 | 36.2% | 59.2% | 4.6% | Trump +23.0 |
| Average | 37.4% | 58.9% | 3.7% | Trump +21.5 | ||
Polls
| Poll source | Date(s) administered |
Sample size[dk] |
Margin of error |
Donald Trump Republican |
Joe Biden Democratic |
Jo Jorgensen Libertarian |
Other | Undecided |
|---|---|---|---|---|---|---|---|---|
| SurveyMonkey/Axios | Oct 20 – Nov 2, 2020 | 1,902 (LV) | ± 3% | 65%[tz] | 35% | – | ||
| SurveyMonkey/Axios | Oct 1–28, 2020 | 3,191 (LV) | – | 59% | 40% | – | – | – |
| SoonerPoll/News 9/News on 6 | Oct 15–20, 2020 | 5,466 (LV) | ± 1.33% | 59% | 37% | 1% | 2%[ua] | 2% |
| SurveyMonkey/Axios | Sep 1–30, 2020 | 1,174 (LV) | – | 63% | 35% | – | – | 2% |
| Amber Integrated | Sep 17–20, 2020 | 500 (LV) | ± 4.38% | 55% | 33% | 1% | 5%[ub] | 6% |
| SoonerPoll/News9[25] | Sep 2–8, 2020 | 486 (LV) | ± 4.45% | 60% | 35% | – | 1%[ua] | 4% |
| SoonerPoll | Aug 13–31, 2020 | 379 (LV) | ± 5.03% | 60% | 35% | – | 2%[uc] | 4% |
| SurveyMonkey/Axios | Aug 1–31, 2020 | 1,009 (LV) | – | 64% | 35% | – | – | 2% |
| SurveyMonkey/Axios | Jul 1–31, 2020 | 1,410 (LV) | – | 64% | 34% | – | – | 4% |
| DFM Research/Abby Broyles for US Senate[CN] | Jul 29–30, 2020 | 572 (LV) | ± 4.1% | 56% | 36% | – | 5%[ud] | 3% |
| SurveyMonkey/Axios | Jun 8–30, 2020 | 591 (LV) | – | 61% | 37% | – | – | 1% |
| Amber Integrated | Jun 3–4, 2020 | 500 (LV) | ± 4.4% | 55% | 36% | – | 4%[ue] | 5% |
| Amber Integrated | Mar 5–8, 2020 | 500 (LV) | ± 4.4% | 57% | 33% | – | 4% | 5% |
| Cole Hargrave Snodgrass & Associates/OK Sooner |
Feb 10–13, 2020 | 500 (RV) | ± 4.3% | 62% | 34% | – | – | 4% |
Pennsylvania
Graphical summary
Graphs are unavailable due to technical issues. There is more info on Phabricator and on MediaWiki.org. |
Aggregate polls
| Source of poll aggregation |
Dates administered |
Dates updated |
Joe Biden Democratic |
Donald Trump Republican |
Other/ Undecided [a] |
Margin |
|---|---|---|---|---|---|---|
| 270 to Win | October 22 – November 2, 2020 | November 3, 2020 | 49.4% | 45.7% | 4.9% | Biden +3.7 |
| Real Clear Politics | October 29 – November 2, 2020 | November 3, 2020 | 48.7% | 47.5% | 3.8% | Biden +1.2 |
| FiveThirtyEight | until November 2, 2020 | November 3, 2020 | 50.2% | 45.6% | 4.2% | Biden +4.6 |
| Average | 49.4% | 46.3% | 4.3% | Biden +3.1 | ||
2020 polls
| Poll source | Date(s) administered |
Sample size[dk] |
Margin of error |
Donald Trump Republican |
Joe Biden Democratic |
Jo Jorgensen Libertarian |
Howie Hawkins Green |
Other | Undecided |
|---|---|---|---|---|---|---|---|---|---|
| Susquehanna Polling & Research Inc. | Nov 1–2 | 499 (LV) | ± 4.3% | 49%[ai] | 48% | 1% | - | 0%[uf] | 0% |
| SurveyMonkey/Axios | Oct 20 – Nov 2 | 6,045 (LV) | ± 2% | 47%[ug] | 52% | - | - | – | – |
| Pulse Opinion Research/Rasmussen Reports | Oct 31 – Nov 1 | 800 (LV) | ± 3.5% | 47%[ai] | 50% | - | - | 1%[uh] | – |
| Research Co. | Oct 31 – Nov 1 | 450 (LV) | ± 4.6% | 46% | 52% | - | - | 2%[ah] | 4% |
| AYTM/Aspiration | Oct 30 – Nov 1 | 340 (LV) | – | 49% | 51% | - | - | – | – |
| Change Research/CNBC | Oct 29 – Nov 1 | 699 (LV) | ± 3.71% | 46% | 50% | 2% | - | – | 2% |
| Marist College/NBC | Oct 29 – Nov 1 | 772 (LV) | ± 4.4% | 46% | 51% | - | - | 1% | 2% |
| Monmouth University | Oct 28 – Nov 1 | 502(RV) | ± 4.4% | 45% | 50% | 1% | - | 0%[ui] | 4% |
| 502 (LV) | 44%[uj] | 51% | - | - | – | – | |||
| 45%[uk] | 50% | - | - | – | – | ||||
| Swayable Archived November 13, 2020, at the Wayback Machine | Oct 27 – Nov 1 | 1,107 (LV) | ± 3.9% | 48% | 50% | 2% | - | – | – |
| Data for Progress | Oct 27 – Nov 1 | 1,417 (LV) | ± 2.6% | 45% | 52% | 2% | 0% | 0%[ul] | – |
| Ipsos/Reuters | Oct 27 – Nov 1 | 673 (LV) | ± 4.3% | 45%[o] | 51% | 1% | 1% | 2%[um] | – |
| 44%[un] | 51% | - | - | 3%[af] | 2% | ||||
| 46%[uo] | 52% | - | - | 2%[du] | – | ||||
| Trafalgar | Oct 30–31 | 1,062 (LV) | ± 2.93% | 48% | 46% | 2% | - | 1%[dn] | 4% |
| Frederick Polls/Compete Everywhere[CO] | Oct 30–31 | 879 (LV) | ± 3% | 48% | 52% | - | - | – | – |
| Insider Advantage/Center for American Greatness[permanent dead link][H] | Oct 30–31 | 500 (LV) | ± 4.4% | 48.7% | 47.4% | 1.3% | - | – | 2.6% |
| Siena College/NYT Upshot | Oct 26–31 | 1,862 (LV) | ± 2.4% | 43% | 49% | 2% | - | 0%[dw] | 5%[og] |
| Morning Consult | Oct 22–31 | 2,686 (LV) | ± 2% | 43% | 52% | - | - | – | – |
| Emerson College | Oct 29–30 | 823 (LV) | ± 3.3% | 47%[ai] | 52% | - | - | 2%[ah] | – |
| AtlasIntel | Oct 29–30 | 672 (LV) | ± 4% | 50% | 49% | - | - | 2% | – |
| Targoz Market Research/PollSmart | Oct 25–30 | 998 (LV) | – | 42% | 56% | - | - | 2%[up] | – |
| Public Policy Polling/American Bridge PAC[CP] | Oct 28–29 | 1,012 (V) | – | 45% | 52% | - | - | – | 3% |
| Redfield & Wilton Strategies | Oct 26–29 | 2,125 (LV) | – | 45% | 50% | 1% | - | 1% | 3% |
| Harvard-Harris/The Hill | Oct 26–29 | 901 (LV) | – | 46% | 51% | - | - | – | 3% |
| ABC/Washington Post | Oct 24–29 | 824 (LV) | ± 4% | 44% | 51% | 3% | - | 0%[uq] | 1% |
| Muhlenberg College/Morning Call | Oct 23–28 | 419 (LV) | ± 5.5% | 44% | 49% | - | - | 4%[ur] | 2% |
| SurveyMonkey/Axios | Oct 1–28 | 10,599 (LV) | ± 1.5% | 46% | 52% | - | - | – | - |
| RMG Research/PoliticalIQ Archived October 29, 2020, at the Wayback Machine | Oct 25–27 | 800 (LV) | ± 3.5% | 45%[o] | 51% | - | - | 2% | 2% |
| 44%[dy] | 52% | - | - | 2% | 2% | ||||
| 47%[dz] | 49% | - | - | 2% | 2% | ||||
| Quinnipiac University | Oct 23–27 | 1,324 (LV) | ± 2.7% | 44% | 51% | - | - | 1%[dn] | 4% |
| Swayable | Oct 23–26 | 491 (LV) | ± 6% | 46% | 52% | 2% | - | – | – |
| Civiqs/Daily Kos | Oct 23–26 | 1,145 (LV) | ± 3% | 45% | 52% | - | - | 2%[ah] | 1% |
| Ipsos/Reuters | Oct 20–26 | 655 (LV) | ± 4.4% | 44%[o] | 51% | 3% | 0% | 1%[us] | – |
| 45%[un] | 50% | - | - | 3%[af] | 2% | ||||
| Insider Advantage/Center for American Greatness[H] | Oct 25 | 400 (LV) | ± 4.9% | 48.5% | 45.5% | 3.3% | - | – | 2.8% |
| Trafalgar Group | Oct 24–25 | 1,076 (LV) | ± 2.91% | 48% | 48% | 2% | - | 1%[dn] | 1% |
| Wick Surveys | Oct 24–25 | 1,000 (LV) | ± 3.1% | 49% | 47% | - | - | – | – |
| Franklin & Marshall College | Oct 19–25 | 558 (LV) | ± 5% | 44% | 50% | 2% | - | 1%[ut] | 3% |
| Univision/University of Houston/Latino Decisions/North Star Opinion Research |
Oct 17–25 | 723 (RV) | ± 3.64% | 45% | 50% | - | - | 3%[cv] | 2% |
| Gravis Marketing | Oct 23 | 602 (LV) | ± 4% | 44% | 51% | - | - | – | 5% |
| Public Policy Polling/American Bridge PAC[CQ] | Oct 21–22 | 980 (V) | – | 46% | 51% | - | - | – | 4% |
| Civiqs/Dan Hopkins | Oct 17–21 | 1,577 (A) | 3% | 46% | 52% | - | - | – | 2% |
| YouGov/University of Wisconsin-Madison | Oct 13–21 | 669 (LV) | ± 4.45% | 44% | 52% | - | - | 3%[uu] | – |
| Citizen Data | Oct 17–20 | 1,000 (LV) | ± 3.1% | 39% | 44% | 9% | 0% | 1% | 7% |
| CNN/SSRS[permanent dead link] | Oct 15–20 | 843 (LV) | ± 4% | 43% | 53% | 2% | - | 1%[uv] | 1% |
| Muhlenberg College/Morning Call Archived November 3, 2020, at the Wayback Machine | Oct 13–20 | 416 (LV) | ± 5.5% | 44% | 51% | - | - | 2%[uw] | 4% |
| Morning Consult | Oct 11–20 | 2,563 (LV) | ± 1.9% | 43% | 52% | - | - | – | – |
| Fox News | Oct 18–19 | 1,045 (LV) | ± 3% | 45% | 50% | 1% | - | 1%[ux] | 2% |
| Pulse Opinion Research/Rasmussen Reports | Oct 18–19 | 800 (LV) | ± 3.5% | 47% | 50% | - | - | 2%[du] | 3% |
| Quinnipiac University | Oct 16–19 | 1,241 (LV) | ± 2.8% | 43% | 51% | - | - | 1%[dn] | 5% |
| Change Research/CNBC | Oct 16–19 | 574 (LV)[al] | – | 47% | 49% | - | - | – | – |
| Suffolk University/USA Today[26] | Oct 15–19 | 500 (LV) | ± 4.4% | 42% | 49% | 1% | - | 4%[uy] | 4% |
| Ipsos/Reuters | Oct 13–19 | 653 (LV) | ± 4.4% | 45%[o] | 49% | 2% | 0% | 3%[uz] | – |
| 45%[un] | 49% | - | - | 3%[af] | 4% | ||||
| Trafalgar Group/Restoration PAC[AX] | Oct 13–15 | 1,041 (LV) | ± 2.96% | 46% | 48% | 3% | - | 2%[ah] | 2% |
| HarrisX/The Hill | Oct 12–15 | 1,289 (LV) | – | 46% | 51% | - | - | – | – |
| Insider Advantage/Center for American Greatness Archived October 17, 2020, at the Wayback Machine[H] | Oct 12–13 | 400 (LV) | ± 4.9% | 43% | 46% | 2% | - | – | 9% |
| Redfield & Wilton Strategies | Oct 10–13 | 1,289 (LV) | – | 43%[al] | 51% | 1% | 0% | – | – |
| Trafalgar Group | Oct 10–12 | 1,034 (LV) | ± 2.97% | 45% | 47% | 3% | - | 3%[cv] | 2% |
| RMG Research/PoliticalIQ Archived October 14, 2020, at the Wayback Machine | Oct 7–12 | 800 (LV) | – | 43%[o] | 49% | 1% | – | 1% | 6% |
| 42%[dy] | 50% | 1% | – | 1% | 6% | ||||
| 45%[dz] | 47% | 1% | – | 1% | 6% | ||||
| Civiqs/Rust Belt Rising[AY] | Oct 8–11 | 600 (LV) | ± 4.2% | 45% | 52% | - | - | 2%[ah] | 1% |
| Ipsos/Reuters | Oct 6–11 | 622 (LV) | ± 4.5% | 45%[o] | 51% | 1% | 0% | 2%[va] | – |
| 44%[un] | 51% | - | - | 1%[vb] | 4% | ||||
| Morning Consult | Oct 2–11 | 2,610 (LV) | ± 1.9% | 44% | 52% | - | - | – | – |
| Redfield & Wilton Strategies | Oct 9–10 | 1,145 (LV) | – | 44%[al] | 49% | 1% | - | – | – |
| Whitman Insight Strategies | Oct 5–9 | 517 (LV) | ± 4.3% | 46% | 51% | - | - | 1%[dn] | 3% |
| Baldwin Wallace University | Sep 30 – Oct 8 | 1,140 (LV) | ± 3.1% | 45% | 50% | 1% | 0% | 0%[vc] | 4% |
| YouGov/CCES Archived November 1, 2020, at the Wayback Machine | Sep 29 – Oct 7 | 2,703 (LV) | – | 44% | 52% | - | - | – | – |
| Redfield & Wilton Strategies | Oct 4–6 | 927 (LV) | ± 3.22% | 42% | 49% | 1% | - | 1%[aw] | 7% |
| Emerson College | Oct 4–5 | 688 (LV) | ± 3.7% | 47%[ai] | 51% | - | - | 2%[ah] | – |
| Quinnipiac University | Oct 1–5 | 1,211 (LV) | ± 2.8% | 41% | 54% | - | - | 1%[dn] | 3% |
| Ipsos/Reuters | Sep 29 – Oct 5 | 605 (LV) | ± 4.5% | 45% | 50% | - | - | 2%[r] | 3% |
| Change Research/CNBC | Oct 2–4 | 468 (LV) | – | 46% | 50% | - | - | – | – |
| Monmouth University | Sep 30 – Oct 4 | 500 (RV) | ± 4.4% | 42% | 54% | 1% | - | 0%[ui] | 2% |
| 500 (LV) | 43%[uj] | 54% | - | - | – | – | |||
| 45%[uk] | 53% | - | - | – | – | ||||
| YouGov/CBS | Sep 30 – Oct 2 | 1,287 (LV) | ± 3.2% | 44% | 51% | - | - | 2%[vd] | 5% |
| Siena College/NYT Upshot | Sep 30 – Oct 2 | 706 (LV) | ± 4.1% | 42% | 49% | 3% | - | 0%[dw] | 5%[og] |
| SurveyMonkey/Axios | Sep 1–30 | 4,613 (LV) | – | 46% | 52% | - | - | – | 2% |
| ABC News/Washington Post | Sep 21–26 | 567 (LV) | ± 5.0% | 45% | 54% | - | - | 0%[ve] | 1% |
| Siena College/NYT Upshot | Sep 25–27 | 711 (LV) | ± 4.3% | 40% | 49% | 2% | - | 0%[dw] | 8%[og] |
| TIPP/The Federalist | Sep 24–26 | 774 (LV) | ± 3.6% | 45% | 50% | - | - | 1%[vf] | 4% |
| Redfield & Wilton Strategies | Sep 23–25 | 1,015 (LV) | ± 3.08% | 44% | 50% | 0% | – | 1%[aw] | 5% |
| Fox News | Sep 20–23 | 856 (LV) | ± 3% | 44% | 51% | 2% | – | 1%[ux] | 2% |
| 910 (RV) | ± 3% | 43% | 51% | 2% | – | 2%[vg] | 3% | ||
| Baldwin Wallace University | Sep 9–22 | 1,012 (LV) | ± 3.6% | 45% | 47% | 2% | 0% | 1%[vh] | 5% |
| Trafalgar Group/Restoration PAC[AX] | Sep 18–21 | 1,006 (LV) | ± 2.99% | 46% | 48% | 1% | 1% | 2%[ah] | 2% |
| YouGov/UW-Madison Elections Research Center/Wisconsin State Journal |
Sep 10–21 | 642 (LV) | – | 45% | 49% | - | - | – | – |
| Change Research/CNBC | Sep 18–20 | 579 (LV) | – | 45% | 49% | - | - | – | – |
| Franklin & Marshall College | Sep 14–20 | 480 (LV) | ± 7.8% | 42% | 48% | - | - | – | – |
| Hart Research Associates/Human Rights Campaign[permanent dead link][CR] | Sep 17–19 | 400 (LV) | ± 4.9% | 42% | 53% | - | - | – | – |
| CPEC[CS] | Sep 15–17 | 830 (LV) | ± 2.3% | 45% | 50% | - | - | 1%[vi] | 4% |
| Trafalgar Group (R) | Sep 15–17 | 1,006 (LV) | ± 2.99% | 45% | 47% | 2% | 1% | 2%[ah] | 2% |
| Ipsos/Reuters | Sep 11–16 | 611 (LV) | ± 4.5% | 46% | 49% | - | - | 2%[r] | 4% |
| Civiqs/Rust Belt Rising[AY] | Sep 11–15 | 704 (RV) | ± 4.4% | 45% | 52% | - | - | 1%[dn] | 2% |
| Redfield & Wilton Strategies | Sep 12–14 | 1,036 (LV) | ± 3.04% | 44% | 49% | 1% | 1% | 0%[vj] | 5% |
| Climate Nexus | Sep 8–11 | 659 (RV) | ± 4% | 43% | 48% | - | - | 3%[vk] | 6% |
| Benenson Strategy Group/GS Strategy Group/AARP | Aug 28 – Sep 8 | 1,600 (LV) | ± 2.5% | 46% | 49% | - | - | 1%[vl] | 4% |
| Marist College/NBC News | Aug 31 – Sep 7 | 771 (LV) | ± 4.4% | 44% | 53% | - | - | 1% | 2% |
| Morning Consult | Aug 29 – Sep 7 | 2,227 (LV) | ± (2%–4%) | 45%[vm] | 50% | - | - | – | – |
| Change Research/CNBC | Sep 4–6 | 829 (LV) | – | 46% | 50% | - | - | 4%[vn] | – |
| TargetSmart Archived October 4, 2020, at the Wayback Machine | Sep 3–6 | 835 (LV) | ± 3.4% | 44% | 51% | - | - | 3% | 3% |
| Susquehanna Polling & Research Inc. | Aug 26 – Sep 4 | 498 (LV) | ± 4.3% | 42% | 44% | - | - | 6%[vo] | 7% |
| Redfield & Wilton Strategies | Aug 30 – Sep 3 | 1,053 (LV) | ± 3.02% | 43% | 48% | 1% | 1% | 1%[aw] | 7% |
| Quinnipiac Archived September 3, 2020, at the Wayback Machine | Aug 28 – Sep 1 | 1,235 (LV) | ± 3% | 44% | 52% | - | - | 1%[dn] | 3% |
| ALG Research/Progressive Policy Institute[CT] | Aug 26 – Sep 1 | 500 (LV) | – | 44% | 50% | - | - | – | – |
| Monmouth University | Aug 28–31 | 400 (RV) | ± 4.9% | 45% | 49% | 2% | 0% | 1%[vp] | 4% |
| 400 (LV) | 46%[vq] | 49% | - | - | 2% | 3% | |||
| 47%[vr] | 48% | - | - | 2% | 3% | ||||
| Hodas & Associates/Restoration PAC[AX] | Aug 26–31 | 600 (LV) | – | 45% | 51% | - | - | – | 4% |
| SurveyMonkey/Axios | Aug 1–31 | 3,531 (LV) | – | 45% | 53% | - | - | – | 2% |
| Morning Consult | Aug 21–30 | 2,158 (LV) | ± (2%–4%) | 45% | 49% | - | - | – | – |
| Pulse Opinion Research/Rasmussen Reports | Aug 25–27 | 1,000 (LV) | ± 3% | 48%[vs] | 48% | - | - | 4%[vt] | – |
| GQR Research/Unite the Country PAC[CU] | Aug 20–24 | 971 (LV) | ± 4.4% | 43% | 52% | - | - | – | 5% |
| Franklin & Marshall College | Aug 17–24 | 681 (RV) | ± 5.2% | 42%[ai] | 50% | - | - | 3%[vu] | 7% |
| Change Research/CNBC | Aug 21–23 | 984 (LV) | – | 46% | 49% | - | - | – | – |
| Global Strategy Group/Climate Power 2020 /League of Conservation Voters/Sierra Club[CV] |
Aug 13–19 | 801 (RV) | ± 3.5% | 42%[o] | 50% | 2% | 1% | – | 5% |
| 43%[vv] | 53% | - | - | – | 4% | ||||
| Redfield and Wilton Strategies | Aug 16–17 | 1,006 (LV) | ± 3.1% | 41% | 48% | 1% | 1% | 1%[aw] | 8% |
| Civiqs/Rust Belt Rising[AY] | Aug 13–17 | 617 (RV) | – | 44% | 51% | - | - | 3%[cv] | 1% |
| Muhlenberg College/Morning Call | Aug 11–17 | 416 (LV) | ± 5.5% | 45% | 49% | - | - | 3%[vw] | 3% |
| Morning Consult | Aug 7–16 | 1,777 (LV) | ± (2%–4%) | 44% | 50% | - | - | – | – |
| Emerson College | Aug 8–10 | 843 (LV) | ± 3.8% | 47%[vx] | 53% | - | - | – | – |
| Change Research/CNBC | Aug 7–9 | 456 (RV) | – | 44% | 48% | - | - | – | – |
| YouGov/CBS | Aug 4–7 | 1,211 (LV) | ± 3.7% | 43% | 49% | - | - | 3%[vy] | 5% |
| OnMessage Inc./Heritage Action[CW] | Aug 2–4 | 400 (LV) | ± 4.7% | 46% | 50% | - | - | – | 4% |
| YouGov/University of Wisconsin-Madison | Jul 27 – Aug 6 | 742 (RV) | ± 4.9% | 41% | 50% | - | - | 2%[vz] | 5% |
| SurveyMonkey/Axios | Jul 1–31 | 4,208 (LV) | – | 48% | 50% | - | - | – | 2% |
| Change Research/CNBC[27] | Jul 24–26 | 382 (LV) | – | 46% | 48% | - | - | – | – |
| Franklin & Marshall College | Jul 20–26 | 667 (RV) | ± 5.5% | 41% | 50% | - | - | 2%[du] | 6% |
| Morning Consult | Jul 17–26 | 2,092 (LV) | ± 2.1% | 42% | 50% | - | - | – | – |
| Gravis Marketing[28] | Jul 22–24 | 1,006 (RV) | ± 3.1% | 45% | 48% | - | - | – | 8% |
| Zogby Analytics | Jul 21–23 | 809 (RV) | ± 3.4% | 43% | 44% | 4% | 2% | - | 8% |
| Hodas & Associates/Restoration PAC[AX] | Jul 17–22 | 600 (LV) | – | 45% | 51% | - | - | – | 5% |
| Redfield & Wilton Strategies | Jul 19–21 | 1,016 (LV) | – | 41% | 48% | 1% | 0% | 2%[wa] | 8% |
| Fox News | Jul 18–20 | 793 (RV) | ± 3.5% | 39% | 50% | - | - | 5%[wb] | 6% |
| Pulse Opinion Research/Rasmussen Reports/American Greatness PAC Archived July 31, 2020, at the Wayback Machine[H] | Jul 15–16 | 750 (LV) | ± 4% | 46% | 51% | - | - | 2%[du] | 1% |
| Spry Strategies/American Principles Project[CX] | Jul 11–16 | 700 (LV) | ± 3.7% | 48% | 47% | - | - | – | 5% |
| Monmouth University | Jul 9–13 | 401 (RV) | ± 4.9% | 40% | 53% | - | - | 3%[wc] | 4% |
| 401 (LV) | 42%[vq] | 52% | - | - | 3% | 3% | |||
| 44%[vr] | 51% | - | - | 2% | 3% | ||||
| Change Research/CNBC | Jul 10–12 | 743 (LV) | – | 42% | 50% | - | - | – | – |
| Trafalgar Group | Jun 29 – Jul 2 | 1,062 (LV) | ± 2.92% | 43% | 48% | - | - | 6%[wd] | 3% |
| SurveyMonkey/Axios | Jun 8–30 | 2,184 (LV) | – | 48% | 50% | - | - | – | 2% |
| Change Research/CNBC | Jun 26–28 | 760 (LV)[al] | – | 44% | 50% | - | - | – | – |
| Susquehanna Polling/Fox 43 | Jun 15–23 | 715 (LV) | – | 41% | 46% | - | - | 5% | 8% |
| Redfield & Wilton Strategies | Jun 14–16 | 1,125 (LV) | ± 2.92% | 39% | 49% | 1% | 1% | 1%[we] | 9% |
| Siena College/NYT Upshot | Jun 8–16 | 651 (RV) | ± 4.2% | 40% | 50% | - | - | 3%[wf] | 6% |
| Change Research/CNBC | Jun 12–14 | 491 (LV)[al] | – | 46% | 49% | - | - | 3%[wg] | – |
| Hodas & Associates/Restoration PAC[AX] | Jun 8–11 | 600 (LV) | ± 4.0% | 42% | 54% | - | - | – | 4% |
| Civiqs/Dan Hopkins | Jun 6–11 | 1,221 (A) | 3.6% | 46% | 49% | - | - | – | 5% |
| Civiqs/Dan Hopkins | May 30 – Jun 2 | 2,045 (A) | 2.4% | 46% | 49% | - | - | – | 5% |
| Change Research/CNBC | May 29–31 | 579 (LV)[al] | – | 50% | 46% | - | - | 2% | 2% |
| Morning Consult | May 17–26 | 2,120 (LV) | – | 44%[al] | 48% | - | - | – | – |
| Redfield & Wilton Strategies | May 10–14 | 963 (LV) | ± 3.2% | 39% | 48% | - | - | 2%[wh] | 11% |
| Hodas & Associates/Restoration PAC[AX] | May 9–13 | 600 (LV) | ± 3.0% | 51% | 46% | - | - | – | 4% |
| Harper Polling (R) Archived May 1, 2020, at the Wayback Machine | Apr 21–26 | 644 (LV) | ± 3.9% | 43% | 49% | - | - | – | 8% |
| Public Policy Polling[CY] | Apr 20–21 | 1,251 (RV) | – | 44% | 51% | - | - | – | 5% |
| Fox News | Apr 18–21 | 803 (RV) | ± 3.5% | 42% | 50% | - | - | – | – |
| Ipsos | Apr 15–20 | 578 (RV) | ± 5.0% | 40% | 46% | - | - | – | – |
| Susquehanna Research/Fox 43 | Apr 14–20 | 693 (LV) | – | 42% | 48% | - | - | – | – |
| Hodas & Associates/Restoration PAC[AX] | Apr 16–18 | 600 (RV) | ± 3.0% | 47% | 47% | - | - | – | 6% |
| Civiqs/Dan Hopkins | Apr 4–8 | 1,912 (A) | 2.5% | 47% | 47% | - | - | – | 6% |
| Baldwin Wallace University Great Lakes | Mar 17–25 | 973 (RV) | ± 3.9% | 47% | 45% | - | - | – | 9% |
| Change Research | Mar 21–23 | 510 (LV) | – | 50% | 47% | - | - | – | 4% |
| Hodas & Associates/Restoration PAC[AX] | Mar 19–21 | 600 (RV) | – | 47% | 45% | - | - | – | – |
| Civiqs/Dan Hopkins | Mar 14–18 | 1,589 (A) | 2.7% | 48% | 46% | - | - | – | 6% |
| YouGov/Yahoo News | Mar 6–8 | 725 (RV) | – | 40% | 46% | - | - | 5%[wi] | 8% |
| Firehouse Strategies/Øptimus Archived December 9, 2019, at the Wayback Machine | Mar 5–7 | 533 (RV) | ± 5.3% | 45% | 44% | - | - | – | – |
| Civiqs/Dan Hopkins | Feb 27 – Mar 3 | 2,462 (A) | 2.2% | 48% | 46% | - | - | – | 7% |
| Muhlenberg College/Morning Call | Feb 12–20 | 424 (RV) | ± 5.5% | 47% | 47% | - | - | 2% | 4% |
| YouGov | Feb 11–20 | 1,171 (RV) | ± 4.0% | 45% | 46% | - | - | – | – |
| Quinnipiac University Archived May 13, 2020, at the Wayback Machine | Feb 12–18 | 849 (RV) | ± 3.4% | 42% | 50% | - | - | 6%[wj] | 3% |
| Expedition Strategies/Progressive Policies Institute | Feb 6–18 | 500 (RV) | – | 42% | 47% | - | - | – | 11% |
2017–2019 polls
| Poll source | Date(s) administered |
Sample size[dk] |
Margin of error |
Donald Trump Republican |
Joe Biden Democratic |
Other | Undecided |
|---|---|---|---|---|---|---|---|
| Firehouse Strategies/Øptimus Archived December 9, 2019, at the Wayback Machine | Dec 3–5, 2019 | 598 (LV) | ± 4.3% | 45% | 41% | 8%[wk] | 6%[og] |
| Muhlenberg College/Morning Call Archived November 14, 2019, at the Wayback Machine | Nov 4–9, 2019 | 410 (RV) | ± 6.0% | 43% | 52% | 4% | 2% |
| Siena College/NYT Upshot | Oct 13–25, 2019 | 661 (LV) | ± 4.4% | 45% | 46% | – | – |
| Firehouse Strategies/Øptimus Archived September 12, 2019, at the Wayback Machine | Sep 7–9, 2019 | 527 (LV) | ± 4.2% | 41% | 45% | 14% | – |
| Firehouse Strategies/Øptimus | Jun 11–13, 2019 | 565 (LV) | ± 4.2% | 42% | 43% | 15% | – |
| Quinnipiac University | May 9–14, 2019 | 978 (RV) | ± 4.2% | 42% | 53% | 1% | 3% |
| WPA Intelligence | Apr 27–30, 2019 | 200 (LV) | ± 6.9% | 45% | 46% | – | 8% |
| Emerson College Archived April 20, 2019, at the Wayback Machine | Mar 26–28, 2019 | 808 (RV) | ± 3.4% | 45% | 55% | – | – |
| Firehouse Strategies/Øptimus Archived April 3, 2019, at the Wayback Machine | Mar 19–21, 2019 | 632 (LV) | ± 4.0% | 43% | 50% | 4% | – |
South Carolina
Graphical summary
Graphs are unavailable due to technical issues. There is more info on Phabricator and on MediaWiki.org. |
Aggregate polls
| Source of poll aggregation |
Dates administered |
Dates updated |
Joe Biden Democratic |
Donald Trump Republican |
Other/ Undecided [a] |
Margin |
|---|---|---|---|---|---|---|
| 270 to Win | October 15, 2020 – November 2, 2020 | November 3, 2020 | 43.3% | 50.3% | 6.4% | Trump +7.0 |
| FiveThirtyEight | until November 2, 2020 | November 3, 2020 | 44.5% | 51.6% | 3.9% | Trump +7.1 |
| Average | 43.9% | 51.0% | 5.1% | Trump +7.1 | ||
Polls
| Poll source | Date(s) administered |
Sample size[dk] |
Margin of error |
Donald Trump Republican |
Joe Biden Democratic |
Jo Jorgensen Libertarian |
Howie Hawkins Green |
Other | Undecided |
|---|---|---|---|---|---|---|---|---|---|
| Optimus | Oct 31 – Nov 2, 2020 | 817 (LV) | ± 3.9% | 51% | 39% | – | – | 2%[wl] | 8% |
| SurveyMonkey/Axios | Oct 20 – Nov 2, 2020 | 2,485 (LV) | ± 3% | 56%[wm] | 42% | – | – | – | – |
| Data For Progress | Oct 27 – Nov 1, 2020 | 1,121 (LV) | ± 2.9% | 53% | 44% | 2% | 0% | 0%[wn] | – |
| Swayable Archived November 27, 2020, at the Wayback Machine | Oct 23 – Nov 1, 2020 | 426 (LV) | ± 7.4% | 50% | 49% | 1% | 0% | – | – |
| Morning Consult | Oct 22–31, 2020 | 904 (LV) | ± 3% | 51% | 45% | – | – | – | – |
| SurveyMonkey/Axios | Oct 1–28, 2020 | 4,725 (LV) | – | 54% | 44% | – | – | – | – |
| Data for Progress | Oct 22–27, 2020 | 1,196 (LV) | ± 2.8% | 50% | 44% | 1% | 0% | – | 4% |
| Starboard Communications | Oct 26, 2020 | 800 (LV) | – | 51% | 44% | – | – | – | 5% |
| East Carolina University | Oct 24–25, 2020 | 763 (LV) | ± 4.1% | 52% | 44% | – | – | 3%[wo] | 1% |
| Morning Consult | Oct 11–20, 2020 | 926 (LV) | ± 3.2% | 51% | 45% | – | – | – | – |
| New York Times/Siena College Archived October 15, 2020, at the Wayback Machine[29] | Oct 9–14, 2020 | 605 (LV) | ± 4.5% | 49% | 41% | 2% | 1% | 1%[wp] | 6%[wq] |
| Data for Progress | Oct 8–11, 2020 | 801 (LV) | ± 3.5% | 52% | 43% | 1% | 1% | – | 4% |
| Morning Consult | Oct 2–11, 2020 | 903 (LV) | ± 3% | 54% | 42% | – | – | – | – |
| SurveyMonkey/Axios | Sep 1–30, 2020 | 1,833 (LV) | – | 53% | 45% | – | – | – | 2% |
| GBAO Strategies/DSCC[CZ] | Sep 24–28, 2020 | 800 (LV) | ± 3.5% | 49% | 44% | – | – | – | – |
| Data for Progress (D) | Sep 23–28, 2020 | 824 (LV) | ± 3.4% | 47%[wr] | 43% | 1% | 1% | – | 8% |
| 50%[ws] | 45% | – | – | – | 5% | ||||
| Quinnipiac University | Sep 23–27, 2020 | 1,123 (LV) | ± 2.9% | 48% | 47% | – | – | 1%[wt] | 4% |
| YouGov/CBS | Sep 22–25, 2020 | 1,080 (LV) | ± 3.8% | 52% | 42% | – | – | 2%[wu] | 4% |
| Morning Consult | Sep 11–20, 2020 | 764 (LV) | ± (3% – 4%) | 50%[wv] | 44% | – | – | – | – |
| Quinnipiac University | Sep 10–14, 2020 | 969 (LV) | ± 3.2% | 51% | 45% | – | – | 0%[ww] | 4% |
| Morning Consult | Sep 2–11, 2020 | ~764 (LV) | ± (3%–4%) | 51% | 44% | – | – | – | – |
| Morning Consult | Aug 23 – Sep 1, 2020 | ~764 (LV) | ± (3%–4%) | 52% | 42% | – | – | – | – |
| SurveyMonkey/Axios | Aug 1–31, 2020 | 1,326 (LV) | – | 53% | 45% | – | – | – | 2% |
| Morning Consult | Aug 13–22, 2020 | ~764 (LV) | ± (3%–4%) | 51% | 43% | – | – | – | – |
| Morning Consult | Aug 3–12, 2020 | ~764 (LV) | ± (3%–4%) | 50% | 43% | – | – | – | – |
| Quinnipiac University Archived August 7, 2020, at the Wayback Machine | Jul 30 – Aug 3, 2020 | 914 (RV) | ± 3.2% | 47% | 42% | – | – | 4%[wx] | 7% |
| Morning Consult | Jul 24 – Aug 2, 2020 | 741 (LV) | ± 4.0% | 49%[wy] | 44% | – | – | 3%[wz] | 4% |
| Morning Consult | Jul 23 – Aug 1, 2020 | ~764 (LV) | ± (3%–4%) | 48% | 45% | – | – | – | – |
| SurveyMonkey/Axios | Jul 1–31, 2020 | 1,700 (LV) | – | 53% | 44% | – | – | – | 2% |
| Morning Consult | Jul 13–22, 2020 | ~764 (LV) | ± (3%–4%) | 50% | 43% | – | – | – | – |
| ALG Research/Lindsey Must Go Archived July 28, 2020, at the Wayback Machine[DA] | Jul 15–20, 2020 | 591 (LV) | – | 50% | 45% | – | – | 1% | 4% |
| Gravis Marketing[30] | Jul 17, 2020 | 604 (LV) | ± 4.0% | 50% | 46% | – | – | – | – |
| brilliant corners Research & Strategies/Jaime Harrison[DB] | Jul 13–19, 2020 | 800 (LV) | ± 3.5% | 50% | 43% | – | – | – | – |
| SurveyMonkey/Axios | Jun 8–30, 2020 | 863 (LV) | – | 52% | 47% | – | – | – | 2% |
| Civiqs/Daily Kos | May 23–26, 2020 | 591 (RV) | ± 4.5% | 52% | 42% | – | – | 5%[xa] | 1% |
| AtlasIntel | Feb 25–28, 2020 | 1,100 (RV) | ± 3.0% | 48% | 42% | – | – | 11% | – |
| East Carolina University | Jan 31 – Feb 2, 2020 | 1,756 (RV) | ± 2.7% | 52% | 40% | – | – | – | 8% |
| Change Research | Jun 11–14, 2019 | 2,312 (RV) | ± 2.0% | 54% | 38% | 3%[xb] | 1%[xb] | – | – |
| Emerson College Archived April 27, 2019, at the Wayback Machine | Feb 28 – Mar 2, 2019 | 755 (RV) | ± 3.5% | 52% | 48% | – | – | – | – |
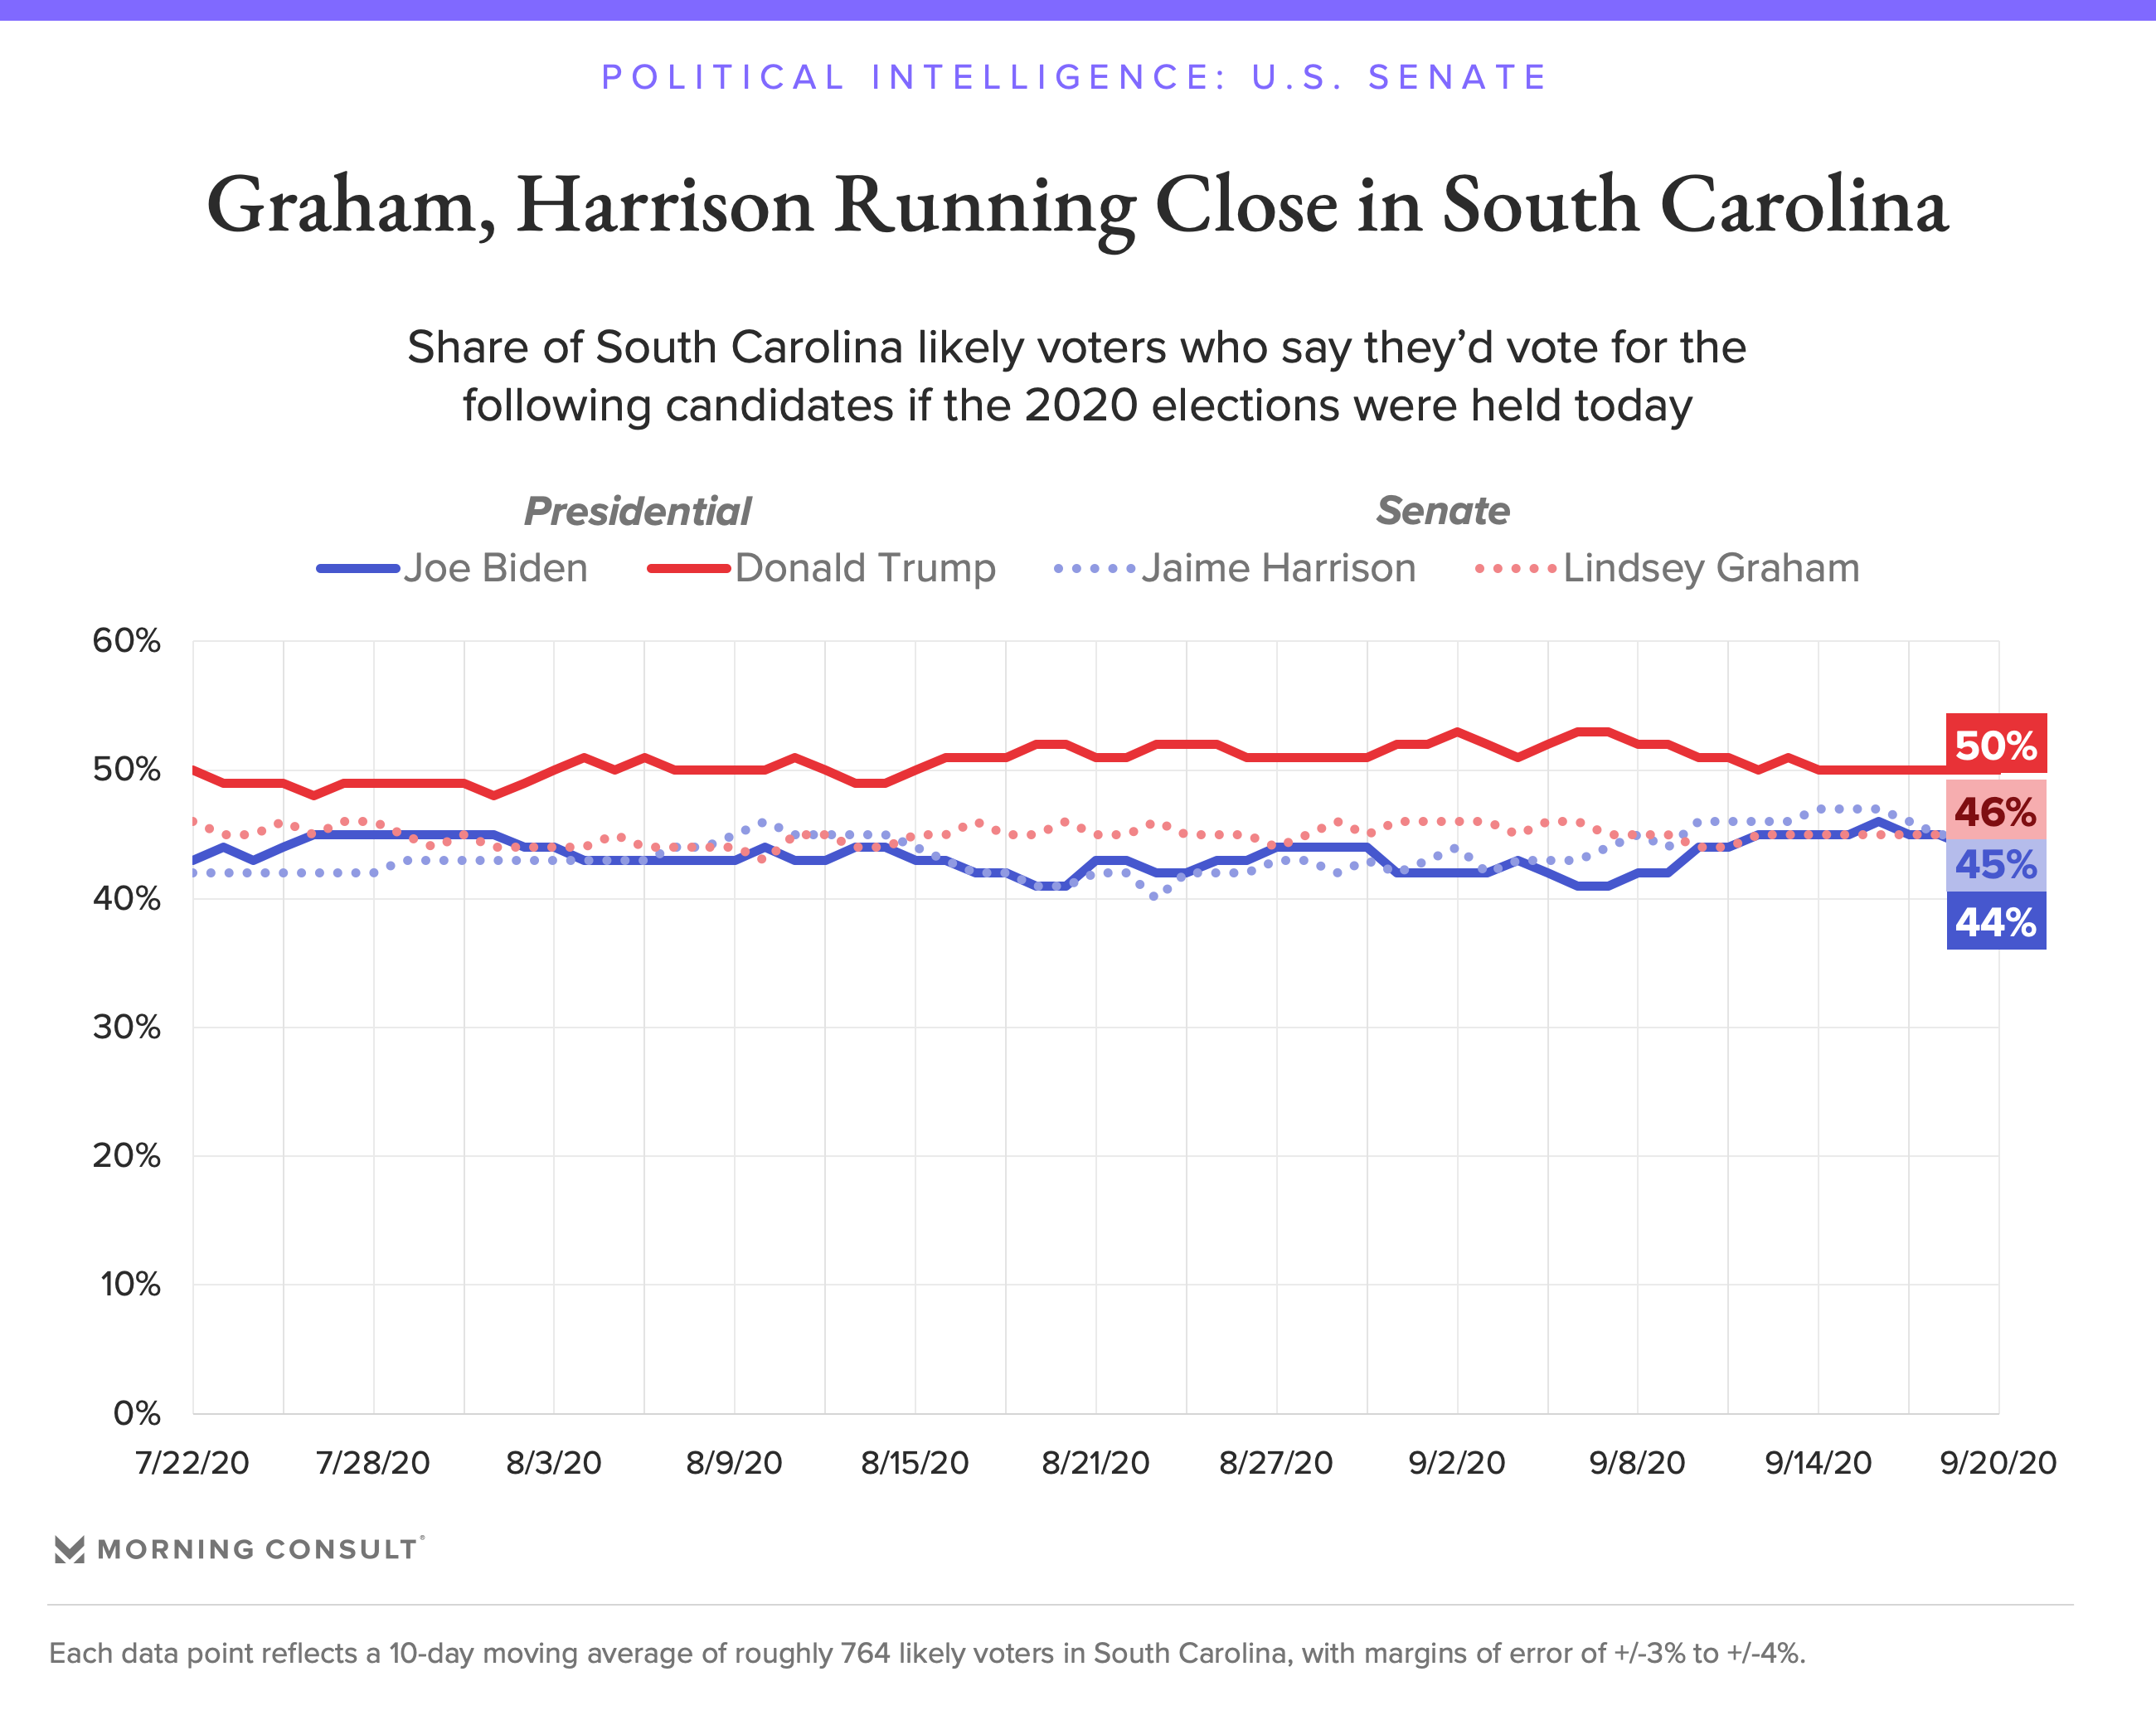
Tennessee
Graphical summary
Graphs are unavailable due to technical issues. There is more info on Phabricator and on MediaWiki.org. |
Aggregate polls
| Source of poll aggregation |
Dates administered |
Dates updated |
Joe Biden Democratic |
Donald Trump Republican |
Other/ Undecided [a] |
Margin |
|---|---|---|---|---|---|---|
| RealClearPolitics | Jan 28, 2020 – May 22, 2020 | September 15, 2020 | 39.0% | 53.0% | 8.0% | Trump +14.0 |
| FiveThirtyEight | until November 2, 2020 | November 3, 2020 | 41.4% | 55.1% | 3.5% | Trump +13.7 |
| Average | 40.2% | 54.1% | 5.7% | Trump +13.9 | ||
Polls
| Poll source | Date(s) administered |
Sample size[dk] |
Margin of error |
Donald Trump Republican |
Joe Biden Democratic |
Jo Jorgensen Libertarian |
Howie Hawkins Green |
Other | Undecided |
|---|---|---|---|---|---|---|---|---|---|
| SurveyMonkey/Axios | Oct 20 – Nov 2, 2020 | 3,342 (LV) | ± 2.5% | 54%[xc] | 45% | - | - | – | – |
| Swayable Archived November 27, 2020, at the Wayback Machine | Oct 23 – Nov 1, 2020 | 485 (LV) | ± 5.9% | 58% | 41% | 1% | 0% | – | – |
| SurveyMonkey/Axios | Oct 1–28, 2020 | 5,099 (LV) | – | 56% | 42% | - | - | – | – |
| SurveyMonkey/Axios | Sep 1–30, 2020 | 2,329 (LV) | – | 58% | 41% | - | - | – | 2% |
| SurveyMonkey/Axios | Aug 1–31, 2020 | 1,796 (LV) | – | 59% | 40% | - | - | – | 1% |
| SurveyMonkey/Axios | Jul 1–31, 2020 | 2,481 (LV) | – | 61% | 38% | - | - | – | 2% |
| SurveyMonkey/Axios | Jun 8–30, 2020 | 1,092 (LV) | – | 61% | 37% | - | - | – | 2% |
| SSRS/Vanderbilt University | May 5–22, 2020 | 1,000 (RV) | ± 3.8% | 51% | 42% | - | - | 5%[xd] | 2% |
| East Tennessee State University Archived May 19, 2020, at the Wayback Machine | Apr 22 – May 1, 2020 | 536 (LV) | – | 53% | 36% | - | - | 6% | 5% |
| Mason-Dixon | Jan 28–30, 2020 | 625 (RV) | ± 4.0% | 55% | 39% | - | - | – | 6% |
Texas
Graphical summary
Graphs are unavailable due to technical issues. There is more info on Phabricator and on MediaWiki.org. |
Aggregate polls
| Source of poll aggregation |
Dates administered |
Dates updated |
Joe Biden Democratic |
Donald Trump Republican |
Other/ Undecided [a] |
Margin |
|---|---|---|---|---|---|---|
| 270 to Win | Oct 29, 2020 – November 2, 2020 | November 3, 2020 | 47.5% | 48.8% | 3.7% | Trump +1.3 |
| Real Clear Politics | October 20–31, 2020 | November 3, 2020 | 46.5% | 47.8% | 5.7% | Trump +1.3 |
| FiveThirtyEight | until November 2, 2020 | November 3, 2020 | 47.4% | 48.6% | 4.0% | Trump +1.1 |
| Average | 47.1% | 48.4% | 4.5% | Trump +1.2 | ||
Polls
| Poll source | Date(s) administered |
Sample size[xe] |
Margin of error |
Donald Trump Republican |
Joe Biden Democratic |
Jo Jorgensen Libertarian |
Howie Hawkins Green |
Other | Undecided |
|---|---|---|---|---|---|---|---|---|---|
| SurveyMonkey/Axios | Oct 20 – Nov 2, 2020 | 9,226 (LV) | ± 1.5% | 51%[xf] | 47% | – | – | – | – |
| Swayable Archived November 13, 2020, at the Wayback Machine | Oct 27 – Nov 1, 2020 | 1,151 (LV) | ± 3.9% | 51% | 47% | 1% | 0% | – | – |
| Data For Progress | Oct 27 – Nov 1, 2020 | 926 (LV) | ± 3.2% | 48% | 49% | 1% | 1% | 0%[xg] | – |
| AtlasIntel | Oct 30–31, 2020 | 686 (LV) | ± 4% | 50% | 47% | – | – | 3% | – |
| Emerson College | Oct 29–31, 2020 | 763 (LV) | ± 3.5% | 49%[ai] | 48% | - | - | 2%[ah] | – |
| Morning Consult | Oct 22–31, 2020 | 3,267 (LV) | ± 2% | 48% | 48% | – | – | – | – |
| Public Policy Polling | Oct 28–29, 2020 | 775 (V) | – | 48% | 50% | – | – | – | 2% |
| Gravis Marketing | Oct 27–28, 2020 | 670 (LV) | ± 3.8% | 50% | 45% | – | – | – | 5% |
| RMG Research/PoliticalIQ Archived October 30, 2020, at the Wayback Machine | Oct 27–28, 2020 | 800 (LV) | ± 3.5% | 50%[xh] | 46% | – | – | 2%[ah] | 2% |
| 48%[xi] | 48% | – | – | 2%[ah] | 2% | ||||
| 52%[xj] | 44% | – | – | 2%[ah] | 2% | ||||
| SurveyMonkey/Axios | Oct 1–28, 2020 | 15,145 (LV) | – | 51% | 47% | – | – | – | – |
| Swayable | Oct 23–26, 2020 | 552 (LV) | ± 5.7% | 49% | 48% | 3% | 1% | – | – |
| YouGov/UMass Amherst | Oct 20–26, 2020 | 873 (LV) | ± 4.2% | 48% | 47% | 2% | 1% | 0%[xk] | 1% |
| Data for Progress (D) | Oct 22–25, 2020 | 1,018 (LV) | ± 3.1% | 48% | 49% | 1% | 0% | – | 2% |
| Siena College/NYT Upshot | Oct 20–25, 2020 | 802 (LV) | ± 3.8% | 47% | 43% | 3% | 0% | 2%[xl] | 5%[xm] |
| Univision/University of Houston/Latino Decisions/North Star Opinion Research |
Oct 17–25, 2020 | 758 (RV) | ± 3.56% | 49% | 46% | – | – | 3%[xn] | 2% |
| Citizen Data | Oct 17–20, 2020 | 1,000 (LV) | ± 3% | 45% | 49% | 1% | 0% | 1% | 4% |
| YouGov/University of Houston | Oct 13–20, 2020 | 1,000 (LV) | ± 3.1% | 50% | 45% | 2% | 0% | – | 3% |
| University of Texas at Tyler/Dallas Morning News | Oct 13–20, 2020 | 925 (LV) | ± 3.2% | 47%[ai] | 49% | 3% | 1% | – | 1% |
| Morning Consult | Oct 11–20, 2020 | 3,347 (LV) | ± 1.7% | 47% | 48% | – | – | – | – |
| Quinnipiac University | Oct 16–19, 2020 | 1,145 (LV) | ± 2.9% | 47% | 47% | – | – | 1%[dn] | 5% |
| Data for Progress (D) | Oct 15–18, 2020 | 933 (LV) | ± 3.2% | 46%[ai] | 47% | 2% | 1% | – | 5% |
| Morning Consult[31] | Oct 2–11, 2020 | 3,455 (LV) | ± 1.7% | 49% | 47% | – | – | – | 3% |
| Public Policy Polling/Texas Democrats Archived October 14, 2020, at the Wayback Machine[DC] | Oct 7–8, 2020 | 721 (LV) | ± 3.6% | 48% | 48% | – | – | – | 1% |
| YouGov/CCES Archived November 1, 2020, at the Wayback Machine | Sep 29 – Oct 7, 2020 | 2,947 (LV) | – | 49% | 47% | – | – | – | – |
| Morning Consult | Sep 28 – Oct 7, 2020 | ~2,700 (LV) | ± 2% | 49% | 46% | – | – | – | – |
| Pulse Opinion Research/Rasmussen Reports/Crosswind PR | Oct 5–6, 2020 | 1,000 (LV) | ± 3% | 51% | 44% | – | – | – | – |
| Civiqs/Daily Kos | Oct 3–6, 2020 | 895 (LV) | ± 3.4% | 48% | 48% | – | – | 2%[ah] | 1% |
| Data For Progress (D) | Sep 30 – Oct 5, 2020 | 1,949 (LV) | ± 2.2% | 45% | 47% | 2% | 1% | – | 5% |
| YouGov/University of Texas/Texas Tribune | Sep 25 – Oct 4, 2020 | 908 (LV) | ± 3.25% | 50% | 45% | 2% | 2% | 1%[dn] | – |
| EMC Research/Blue Texas PAC[DD] | Sep 27 – Oct 2, 2020 | 848 (LV) | – | 49% | 49% | – | – | – | – |
| SurveyMonkey/Axios | Sep 1–30, 2020 | 13,395 (LV) | – | 52% | 46% | – | – | – | 2% |
| Hart Research Associates/Human Rights Campaign[DE] | Sep 24–27, 2020 | 400 (LV) | ± 4.9% | 49% | 47% | – | – | – | – |
| Morning Consult | Sep 18–27, 2020 | ~2,700 (LV) | ± 2% | 48% | 47% | – | – | – | – |
| Public Policy Polling/Texas Democrats[32] Archived October 8, 2020, at the Wayback Machine[DF] | Sep 25–26, 2020 | 612 (LV) | ± 3.6% | 48% | 48% | – | – | – | 4% |
| YouGov/UMass Lowell | Sep 18–25, 2020 | 882 (LV) | ± 4.3% | 49%[xo] | 46% | 2% | 1% | 1%[xp] | 1% |
| 50%[xq] | 46% | – | – | 2%[xr] | 2% | ||||
| Data For Progress[DG] | Sep 18–22, 2020 | 726 (LV) | ± 3.6% | 47% | 45% | – | – | – | 9% |
| Siena College/NYT Upshot | Sep 16–22, 2020 | 653 (LV) | ± 4.3% | 46% | 43% | 1% | 1% | 0%[xs] | 9%[xm] |
| Quinnipiac University | Sep 17–21, 2020 | 1,078 (LV) | ± 3% | 50% | 45% | – | – | No voters | 4% |
| YouGov/CBS | Sep 15–18, 2020 | 1,129 (LV) | ± 3.5% | 48% | 46% | – | – | 2%[xt] | 4% |
| Morning Consult | Sep 8–17, 2020 | ~2,700 (LV) | ± 2% | 47% | 47% | – | – | – | – |
| Morning Consult | Aug 29 – Sep 7, 2020 | 2,829 (LV) | ± 2% | 46%[xu] | 46% | – | – | – | – |
| Public Policy Polling/Giffords[DH] | Sep 1–2, 2020 | 743 (V) | – | 48% | 47% | – | – | – | 5% |
| University of Texas at Tyler/Dallas Morning News | Aug 28 – Sep 2, 2020 | 901 (LV) | ± 3.26% | 49%[ai] | 47% | 1% | 1% | 1% | – |
| SurveyMonkey/Axios | Aug 1–31, 2020 | 12,607 (LV) | – | 52% | 46% | – | – | – | 2% |
| Morning Consult | Aug 21–30, 2020 | 2,632 (LV) | ± 2% | 48%[xu] | 47% | – | – | – | – |
| Tyson Group/Consumer Energy Alliance[DI] | Aug 20–25, 2020 | 906 (LV) | ± 3% | 44% | 48% | 0% | – | 0%[xv] | 5% |
| Data for Progress/Texas Youth Power Alliance | Aug 20–25, 2020 | 2,295 (LV) | ± 2.0% | 45% | 48% | – | – | – | 8% |
| Public Policy Polling/Texas Democrats[33][DJ] | Aug 21–22, 2020 | 764 (RV) | ± 3.6% | 47% | 48% | – | – | – | 5% |
| Morning Consult | Aug 13–22, 2020 | ~2,700 (LV) | ± 2% | 48% | 47% | – | – | – | – |
| Morning Consult | Aug 7–16, 2020 | 2,559 (LV) | ± 2% | 47%[xw] | 46% | – | – | – | – |
| Global Strategy Group/Chrysta for Texas[DK] | Aug 11–13, 2020 | 700 (LV) | ± 3.7% | 45% | 47% | – | – | – | – |
| YouGov/Texas Hispanic Policy Foundation/Rice University's Baker Institute | Aug 4–13, 2020 | 846 (RV) | – | 48% | 41% | 1% | 1% | – | 10.2% |
| – (LV)[DL] | 50% | 44% | 1% | 0% | – | 5% | |||
| Trafalgar Group (R) | Aug 1–5, 2020 | 1,015 (LV) | ± 3.0% | 49% | 43% | 2% | – | 2%[xx] | 3% |
| Morning Consult | Aug 3–12, 2020 | ~2,700 (LV) | ± 2.0% | 47% | 46% | – | – | – | – |
| Morning Consult | Jul 24 – Aug 2, 2020 | 2,576 (LV) | ± 2.0% | 46%[xu] | 47% | – | – | 2%[ah] | 5% |
| SurveyMonkey/Axios | Jul 1–31, 2020 | 13,721 (LV) | – | 52% | 46% | – | – | – | 2% |
| Morning Consult | Jul 17–26, 2020 | 2,685 (LV) | ± 1.9% | 45%[xw] | 47% | – | – | – | – |
| Morning Consult[34] | Jul 16–25, 2020 | ~2,700 (LV)[xy] | ± 2.0% | 45% | 47% | – | – | – | – |
| Spry Strategies/American Principles Project[DM] | Jul 16–20, 2020 | 750 (LV) | ± 3.5% | 49% | 45% | – | – | – | 6% |
| Quinnipiac University | Jul 16–20, 2020 | 880 (RV) | ± 3.3% | 44% | 45% | – | – | 7%[xz] | 4% |
| Morning Consult | Jul 6–15, 2020 | – (LV)[xy] | – | 46% | 46% | – | – | – | – |
| YouGov/CBS | Jul 7–10, 2020 | 1,185 (LV) | ± 3.6% | 46% | 45% | – | – | 4%[ya] | 6% |
| Gravis Marketing/OANN | Jul 7, 2020 | 591 (LV) | ± 4.3% | 46% | 44% | – | – | – | – |
| Dallas Morning News/University of Texas at Tyler | Jun 29 – Jul 7, 2020 | 1,677 (LV) | ± 2.4% | 43% | 48% | – | – | 4% | 5% |
| Morning Consult | Jun 26 – Jul 5, 2020 | – (LV)[xy] | – | 46% | 45% | – | – | – | – |
| SurveyMonkey/Axios | Jun 8–30, 2020 | 6,669 (LV) | – | 51% | 46% | – | – | – | 2% |
| YouGov/University of Texas/Texas Politics Project | Jun 19–29, 2020 | 1,200 (RV) | ± 2.89% | 48% | 44% | – | – | – | 8% |
| Public Policy Polling[35] | Jun 24–25, 2020 | 729 (RV) | ± 3.6% | 46% | 48% | – | – | – | 5% |
| Morning Consult | Jun 16–25, 2020 | – (LV)[xy] | – | 47% | 44% | – | – | – | – |
| Fox News | Jun 20–23, 2020 | 1,001 (RV) | ± 3% | 44% | 45% | – | – | 5%[yb] | 5% |
| Public Policy Polling/Progress Texas[36][DN] | Jun 18–19, 2020 | 907 (V) | ± 3% | 48% | 46% | – | – | – | 6% |
| Morning Consult | Jun 6–15, 2020 | – (LV)[xy] | – | 48% | 45% | – | – | – | – |
| Morning Consult | May 27 – Jun 5, 2020 | – (LV)[xy] | – | 48% | 43% | – | – | – | – |
| Public Policy Polling/Texas Democrats Archived June 5, 2020, at the Wayback Machine[DO] | Jun 2–3, 2020 | 683 (V) | – | 48% | 48% | – | – | – | 4% |
| Quinnipiac | May 28 – Jun 1, 2020 | 1,166 (RV) | ± 2.9% | 44% | 43% | – | – | 6%[yc] | 7% |
| Morning Consult | May 17–26, 2020 | 2,551 (LV) | – | 50%[xu] | 43% | – | – | – | – |
| Morning Consult | May 16–25, 2020 | – (LV)[xy] | – | 50% | 42% | – | – | – | – |
| Morning Consult | May 6–15, 2020 | – (LV)[xy] | – | 49% | 43% | – | – | – | – |
| Emerson College | May 8–10, 2020 | 800 (RV) | ± 3.4% | 52%[yd] | 48% | – | – | – | – |
| Public Policy Polling | Apr 27–28, 2020 | 1,032 (V) | – | 46% | 47% | – | – | – | 7% |
| Dallas Morning News/University of Texas at Tyler | Apr 18–27, 2020 | 1,183 (RV) | ± 2.85% | 43% | 43% | – | – | 5% | 9% |
| University of Texas/Texas Tribune | Apr 10–19, 2020 | 1,200 (RV) | ± 2.8% | 49% | 44% | – | – | – | 7% |
| AtlasIntel | Feb 24 – Mar 2, 2020 | 1,100 (RV) | ± 3.0% | 47% | 43% | – | – | 11% | – |
| NBC News/Marist College | Feb 23–27, 2020 | 2,409 (RV) | ± 2.5% | 49% | 45% | – | – | 1% | 5% |
| CNN/SSRS | Feb 22–26, 2020 | 1,003 (RV) | ± 3.4% | 47% | 48% | – | – | 3%[ye] | 2% |
| Univision | Feb 21–26, 2020 | 1,004 (RV) | ± 3.1% | 43% | 46% | – | – | – | 11% |
| Dallas Morning News/University of Texas at Tyler | Feb 17–26, 2020 | 1,221 (RV) | ± 2.8% | 45% | 44% | – | – | 11% | – |
| YouGov/University of Texas/Texas Tribune | Jan 31 – Feb 9, 2020 | 1,200 (RV) | ± 2.83% | 47% | 44% | – | – | – | 10% |
| University of Texas at Tyler/Dallas News Archived February 2, 2020, at the Wayback Machine | Jan 21–30, 2020 | 910 (LV) | ± 3.24% | 46% | 44% | – | – | 10%[yf] | – |
| Data For Progress[DP] | Jan 16–21, 2020 | 1,486 (LV) | – | 54% | 40% | – | – | 3%[yg] | 3% |
| Texas Lyceum | Jan 10–19, 2020 | 520 (LV) | ± 4.3% | 51% | 46% | – | – | – | 3% |
| CNN/SSRS | Dec 4–9, 2019 | 1,003 (RV) | – | 48% | 47% | – | – | 2%[yh] | 3% |
| Beacon Research (R) | Nov 9–21, 2019 | 1,601 (RV) | ± 3.0% | 45% | 44% | – | – | – | – |
| University of Texas at Tyler | Nov 5–14, 2019 | 1,093 (RV) | ± 3.0% | 45% | 39% | – | – | – | 16% |
| University of Texas/ Texas Tribune | Oct 18–27, 2019 | 1,200 (RV) | ± 2.8% | 46% | 39% | – | – | 9%[yi] | 6% |
| University of Texas at Tyler | Sep 13–15, 2019 | 1,199 (RV) | ± 2.8% | 38% | 40% | – | – | 13% | 9% |
| Univision | Aug 31 – Sep 6, 2019 | 1,004 (RV) | – | 43% | 47% | – | – | – | 10% |
| Climate Nexus | Aug 20–25, 2019 | 1,660 (RV) | ± 2.4% | 43% | 43% | – | – | – | 9% |
| University of Texas at Tyler | Aug 1–4, 2019 | 1,261 (RV) | ± 2.8% | 37% | 41% | – | – | 14% | 8% |
| Emerson | Aug 1–3, 2019 | 1,033 (RV) | ± 3.0% | 49% | 51% | – | – | – | – |
| University of Texas at Tyler | Jul 24–27, 2019 | 1,414 (RV) | ± 2.6% | 37% | 37% | – | – | 12% | 14% |
| Quinnipiac University | May 29 – Jun 4, 2019 | 1,159 (RV) | ± 3.4% | 44% | 48% | – | – | 1% | 4% |
| WPA Intelligence | Apr 27–30, 2019 | 200 (LV) | ± 6.9% | 49% | 42% | – | – | – | 7% |
| Emerson College Archived July 3, 2019, at the Wayback Machine | Apr 25–28, 2019 | 799 (RV) | ± 3.4% | 50%[yd] | 51% | – | – | – | – |
| Quinnipiac University | Feb 20–25, 2019 | 1,222 (RV) | ± 3.4% | 47% | 46% | – | – | 1% | 5% |
| Public Policy Polling (D)[DQ] | Feb 13–14, 2019 | 743 (RV) | ± 3.6% | 49% | 46% | – | – | – | 5% |
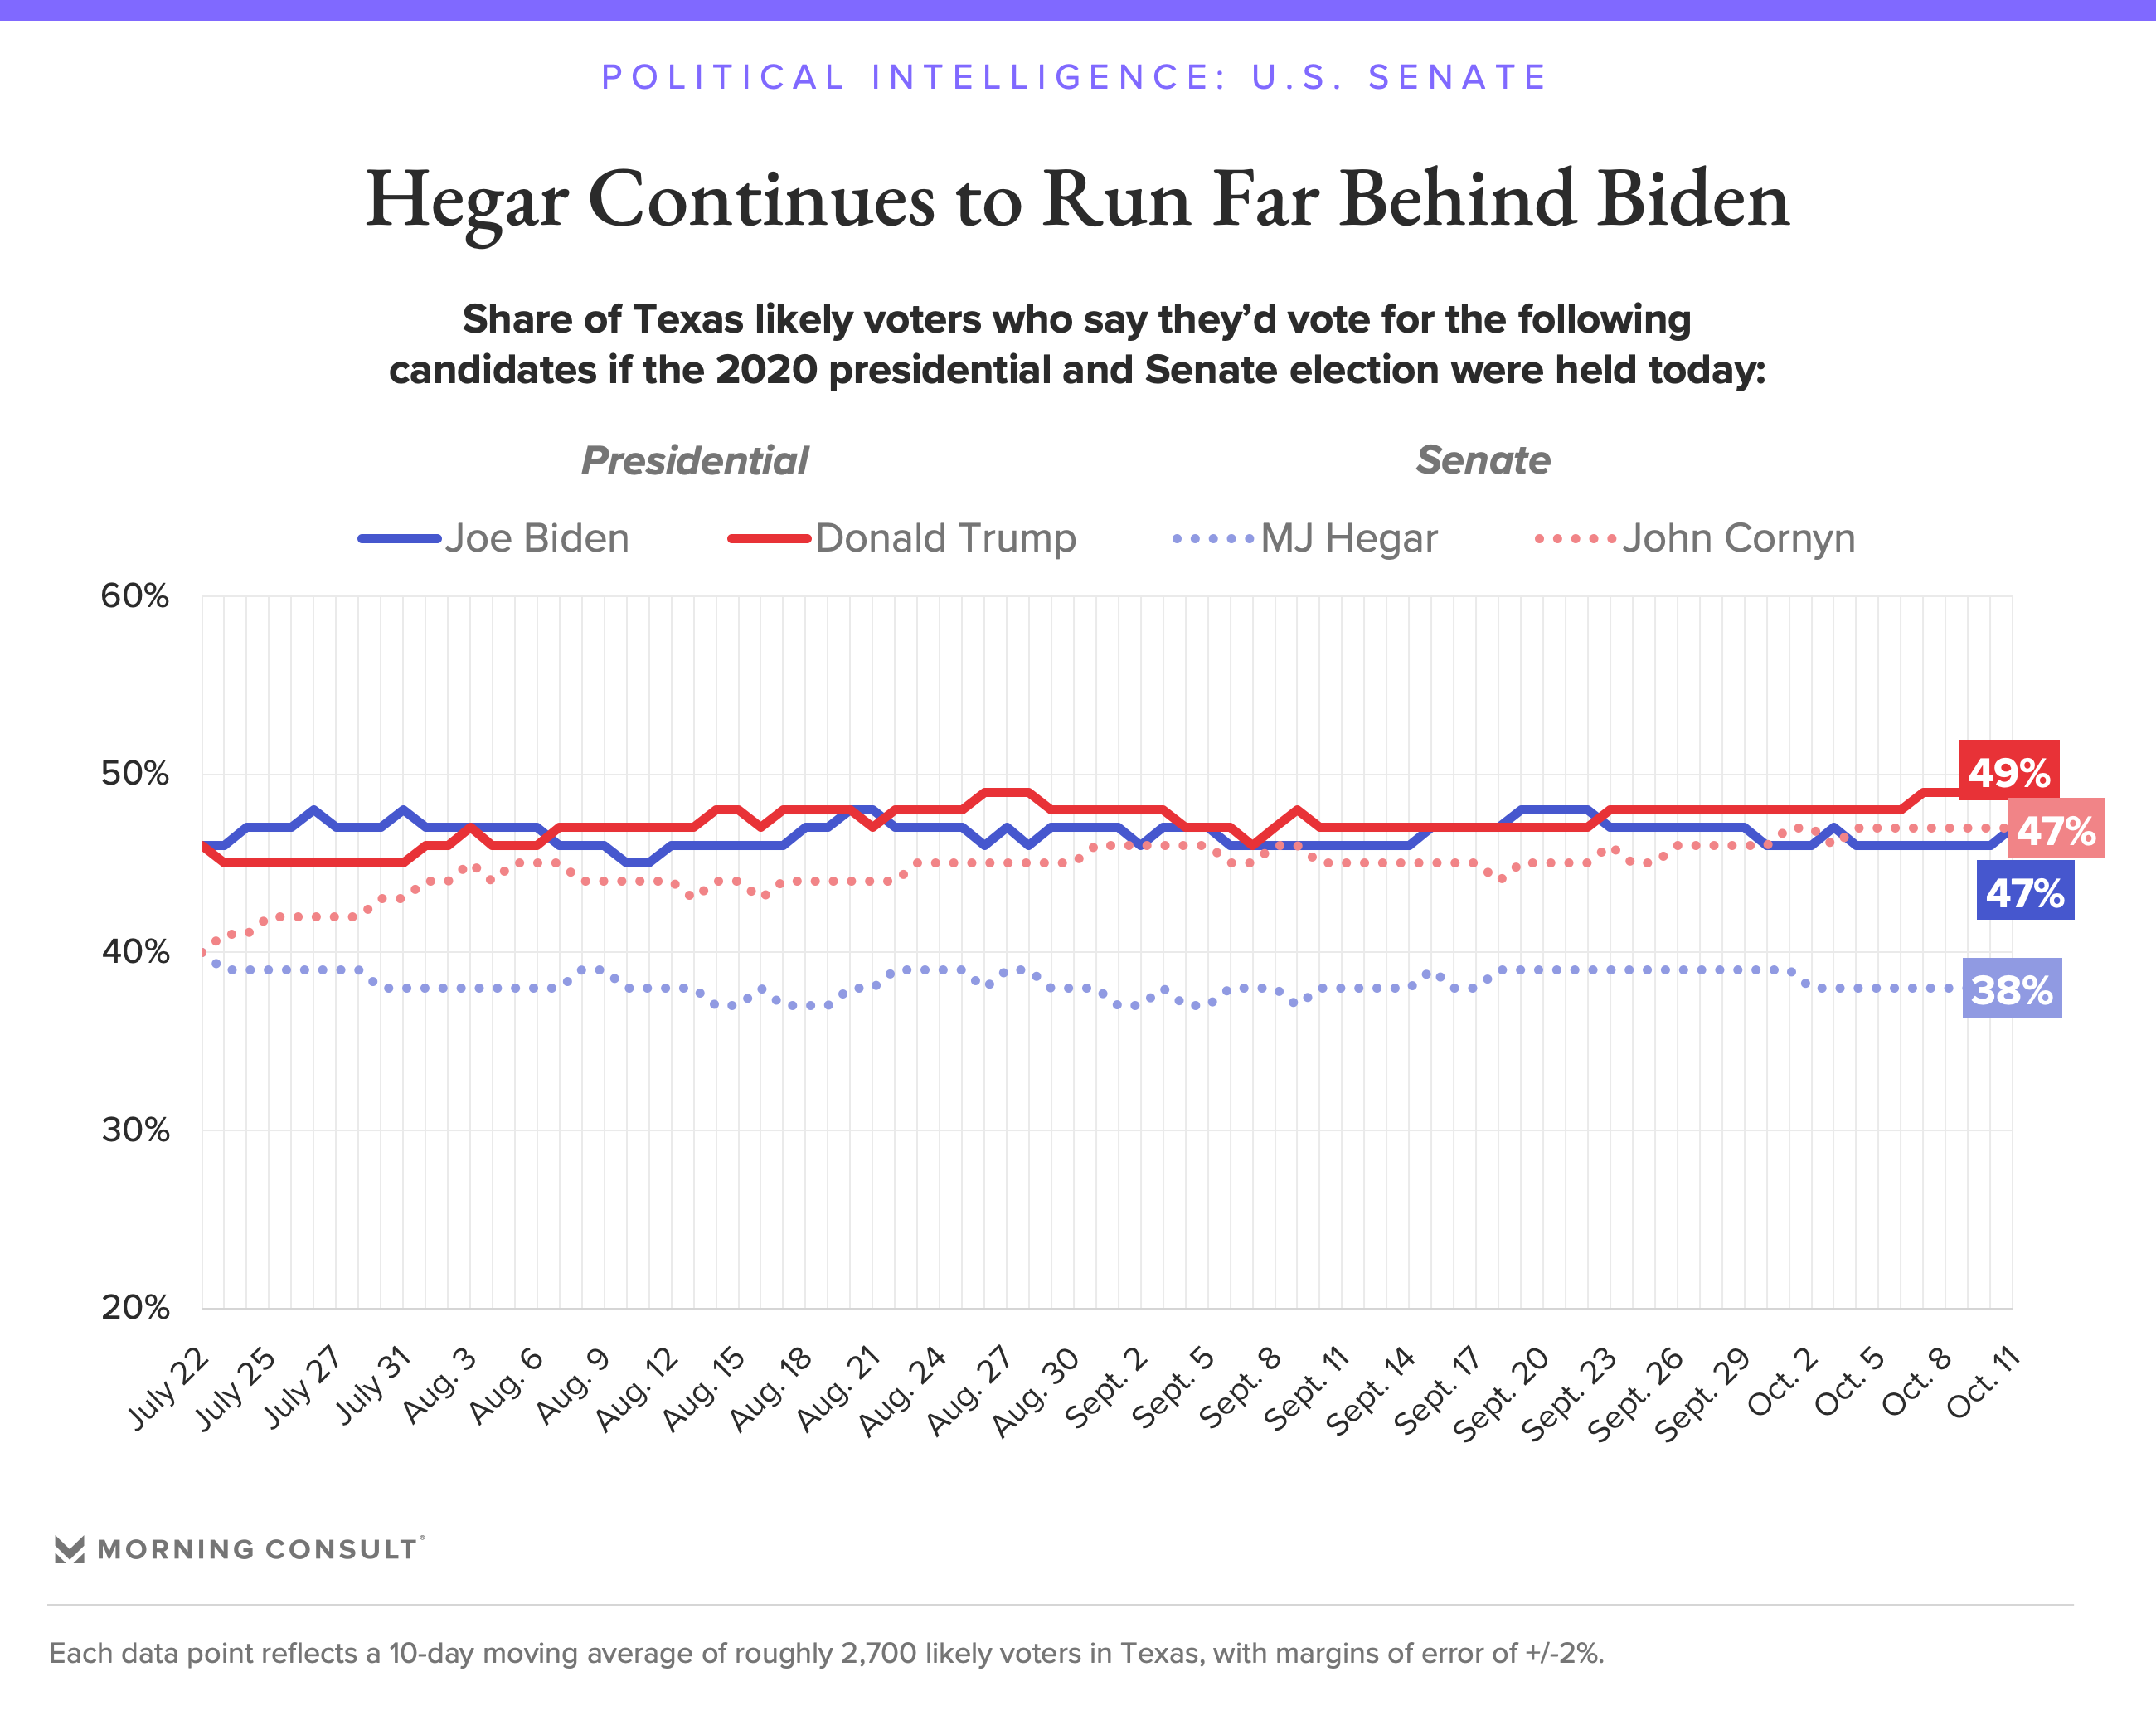
Utah
Graphical summary
Graphs are unavailable due to technical issues. There is more info on Phabricator and on MediaWiki.org. |
Aggregate polls
| Source of poll aggregation |
Dates administered |
Dates updated |
Joe Biden Democratic |
Donald Trump Republican |
Other/ Undecided [a] |
Margin |
|---|---|---|---|---|---|---|
| 270 to Win | October 23–31, 2020 | November 3, 2020 | 41.0% | 50.5% | 8.5% | Trump +9.5 |
| FiveThirtyEight | until November 2, 2020 | November 3, 2020 | 42.1% | 51.9% | 6.0% | Trump +9.8 |
| Average | 41.6% | 51.2% | 7.2% | Trump +9.6 | ||
Polls
| Poll source | Date(s) administered |
Sample size[yj] |
Margin of error |
Donald Trump Republican |
Joe Biden Democratic |
Jo Jorgensen Libertarian |
Howie Hawkins Green |
Other | Undecided |
|---|---|---|---|---|---|---|---|---|---|
| SurveyMonkey/Axios | Oct 20 – Nov 2, 2020 | 1,586 (LV) | ± 3.5% | 55%[yk] | 43% | – | – | – | – |
| SurveyMonkey/Axios | Oct 1–28, 2020 | 2,783 (LV) | – | 55% | 43% | – | – | – | – |
| Y2 Analytics/Salt Lake Tribune | Oct 15–24, 2020 | 660 (LV) | ± 3.8% | 51% | 44% | – | – | 5%[yl] | – |
| RMG Research/Deseret News/Hinckley Institute of Politics | Oct 12–17, 2020 | 1,000 (LV) | ± 3.1% | 50% | 38% | 3% | 0% | 1% | 7% |
| Y2 Analytics/Salt Lake Tribune | Sep 26 – Oct 4, 2020 | 1,214 (LV) | ± 2.8% | 50% | 40% | – | – | 10% | 1% |
| SurveyMonkey/Axios | Sep 1–30, 2020 | 1,192 (LV) | – | 56% | 42% | – | – | – | 2% |
| RMG Research/Deseret News/Hinckley Institute of Politics | Sep 7–12, 2020 | 1,000 (LV) | ± 3.1% | 53% | 35% | 5% | 0% | 1% | 6% |
| SurveyMonkey/Axios | Aug 1–31, 2020 | 893 (LV) | – | 57% | 41% | – | – | – | 2% |
| RMG Research/Scott Rasmussen/Deseret News | Jul 27 – Aug 1, 2020 | 1,000 (RV) | ± 3.1% | 50% | 31% | 3% | 1% | 4% | 11% |
| SurveyMonkey/Axios | Jul 1–31, 2020 | 1,037 (LV) | – | 58% | 40% | – | – | – | 2% |
| SurveyMonkey/Axios | Jun 8–30, 2020 | 412 (LV) | – | 57% | 41% | – | – | – | 1% |
| Y2 Analytics/UtahPolicy.com/KUTV 2 | May 9–15, 2020 | 1,099 (LV) | ± 3% | 44% | 41% | – | – | 9%[ym] | 5% |
| Scott Rasmussen/Deseret News | Apr 15–21, 2020 | 964 (RV) | ± 3.2% | 51% | 32% | – | – | 8% | 9% |
| Y2 Analytics | Mar 21–30, 2020 | 1,266 (RV) | ± 2.8% | 46% | 41% | – | – | 7% | 5% |
| Scott Rasmussen/Deseret News | Feb 24 – Mar 1, 2020 | 1,000 (RV) | ± 3.1% | 50% | 33% | – | – | 8%[yn] | 8% |
| Scott Rasmussen/Deseret News | Jan 15–22, 2020 | 1,017 (RV) | ± 3.1% | 49% | 31% | – | – | 13%[yo] | 7% |
| Y2 Analytics | Jul 31 – Aug 6, 2019 | 149 (RV) | – | 36% | 35% | – | – | 14%[yp] | 5% |
Virginia
- Graphical summary
Graphs are unavailable due to technical issues. There is more info on Phabricator and on MediaWiki.org. |
Aggregate polls
| Source of poll aggregation |
Dates administered |
Dates updated |
Joe Biden Democratic |
Donald Trump Republican |
Other/ Undecided [a] |
Margin |
|---|---|---|---|---|---|---|
| 270 to Win | October 15–31, 2020 | November 3, 2020 | 52.8% | 41.0% | 6.2% | Biden +11.8 |
| FiveThirtyEight | until November 2, 2020 | November 3, 2020 | 53.7% | 41.9% | 4.4% | Biden +11.8 |
| Average | 53.1% | 40.5% | 5.3% | Biden +11.8 | ||
Polls
| Poll source | Date(s) administered |
Sample size[yq] |
Margin of error |
Donald Trump Republican |
Joe Biden Democratic |
Jo Jorgensen Libertarian |
Howie Hawkins Green |
Other | Undecided |
|---|---|---|---|---|---|---|---|---|---|
| SurveyMonkey/Axios | Oct 20 – Nov 2, 2020 | 4,550 (LV) | ± 2% | 41%[yr] | 57% | - | - | – | – |
| Swayable Archived November 13, 2020, at the Wayback Machine | Oct 27 – Nov 1, 2020 | 467 (LV) | ± 6.4% | 39% | 59% | 2% | 1% | – | – |
| Data for Progress | Oct 27 – Nov 1, 2020 | 690 (LV) | ± 3.7% | 43% | 54% | 1% | 0% | 1%[ys] | – |
| Roanoke College | Oct 23–29, 2020 | 802 (LV) | ± 3.5% | 42% | 53% | 2% | - | 1% | 2% |
| SurveyMonkey/Axios | Oct 1–28, 2020 | 7,663 (LV) | – | 43% | 55% | - | - | – | – |
| Christopher Newport University | Oct 15–27, 2020 | 908 (LV) | ± 3.4% | 41% | 53% | - | - | 2%[yt] | 4% |
| Swayable | Oct 23–26, 2020 | 351 (LV) | ± 5.2% | 44% | 55% | 1% | - | – | – |
| Virginia Commonwealth University | Oct 13–22, 2020 | 709 (LV) | ± 4.93% | 39% | 51% | - | - | 2%[yu] | 8%[yv] |
| Schar School/Washington Post | Oct 13–19, 2020 | 908 (LV) | ± 4% | 41% | 52% | 3% | - | 0%[yw] | 4% |
| Civiqs/Daily Kos | Oct 11–14, 2020 | 1,231 (LV) | ± 3.1% | 42% | 55% | - | - | 3%[yx] | 1% |
| Reconnect Research/Roanoke College | Sep 30 – Oct 12, 2020 | 602 (LV) | – | 39%[yy] | 54% | 4% | - | - | 4% |
| Survey Monkey/Tableau | Sep 15 – Oct 12, 2020 | 4,248 (LV) | – | 43% | 55% | - | - | – | 2% |
| Cygnal/Gade for Virginia[DR] | Oct 9–11, 2020 | 607 (LV) | – | 42% | 51% | - | - | – | – |
| SurveyMonkey/Axios | Sep 1–30, 2020 | 2,882 (LV) | – | 42% | 56% | - | - | – | 2% |
| Cygnal/Gade for Virginia[37][DR] | Sep 22–25, 2020 | 600 (LV) | – | 41% | 52% | - | - | – | – |
| Christopher Newport University | Sep 9–21, 2020 | 796 (LV) | ± 3.9% | 43% | 48% | - | - | 2%[yz] | 7% |
| Virginia Commonwealth University Archived September 15, 2020, at the Wayback Machine | Aug 28 – Sep 7, 2020 | 693 (LV) | ± 6.22% | 39% | 52% | - | - | 1%[za] | 8%[yv] |
| SurveyMonkey/Axios | Aug 1–31, 2020 | 2,626 (LV) | – | 41% | 57% | - | - | – | 2% |
| Roanoke College | Aug 9–22, 2020 | 566 (LV) | ± 4.1% | 39% | 53% | - | - | 3%[zb] | 5% |
| SurveyMonkey/Axios | Jul 1–31, 2020 | 3,178 (LV) | – | 43% | 55% | - | - | – | 2% |
| Morning Consult | Jul 17–26, 2020 | 1,156 (LV) | ± 2.9% | 41% | 52% | - | - | – | – |
| Virginia Commonwealth University | Jul 11–19, 2020 | 725 (LV) | ± 6.2% | 39% | 50% | - | - | 1% | 10% |
| SurveyMonkey/Axios | Jun 8–30, 2020 | 1,619 (LV) | – | 42% | 57% | - | - | – | 1% |
| Morning Consult | May 17–26, 2020 | 1,148 (LV) | – | 42%[zc] | 52% | - | - | – | – |
| Roanoke College | May 3–16, 2020 | 563 (LV) | ± 4.1% | 39% | 51% | - | - | – | – |
| Virginia Commonwealth University | Mar 25 – Apr 8, 2020 | 812 (A) | ± 4.5% | 41% | 51% | - | - | – | 8% |
| Hampton University | Feb 25–28, 2020 | 768 (RV) | ± 3.8% | 38% | 45% | - | - | – | – |
| Roanoke College | Feb 9–18, 2020 | 520 (LV) | ± 4.3% | 40% | 48% | - | - | – | – |
| Mason-Dixon | Dec 12–16, 2019 | 625 (RV) | ± 4.0% | 45% | 49% | - | - | – | 6% |
| Virginia Commonwealth University | Dec 2–13, 2019 | 728 (LV) | ± 5.1% | 46% | 49% | - | - | – | 5%[yv] |
| Virginia Commonwealth University | Sep 23 – Oct 4, 2019 | 645 (LV) | ± 5.0% | 44% | 52% | - | - | – | 4%[yv] |
| University of Mary Washington/Research America | Sep 3–15, 2019 | 1,009 (A) | ± 3.1% | 37% | 55% | - | - | 1% | 4% |
Washington
Graphical summary
Graphs are unavailable due to technical issues. There is more info on Phabricator and on MediaWiki.org. |
Aggregate polls
| Source of poll aggregation |
Dates administered |
Dates updated |
Joe Biden Democratic |
Donald Trump Republican |
Other/ Undecided [a] |
Margin |
|---|---|---|---|---|---|---|
| 270 to Win | October 8–15, 2020 | October 27, 2020 | 57.5% | 35.5% | 7.0% | Biden +22.0 |
| FiveThirtyEight | until November 2, 2020 | November 3, 2020 | 59.4% | 36.4% | 4.2% | Biden +23.0 |
| Average | 58.5% | 36.0% | 5.6% | Biden +22.5 | ||
Polls
| Poll source | Date(s) administered |
Sample size[zd] |
Margin of error |
Donald Trump Republican |
Joe Biden Democratic |
Jo Jorgensen Libertarian |
Howie Hawkins Green |
Other | Undecided |
|---|---|---|---|---|---|---|---|---|---|
| SurveyMonkey/Axios | Oct 20 – Nov 2, 2020 | 4,142 (LV) | ± 2% | 35%[ze] | 62% | – | – | – | – |
| Swayable Archived November 27, 2020, at the Wayback Machine | Oct 23 – Nov 1, 2020 | 489 (LV) | ± 6% | 39% | 59% | 2% | 1% | – | – |
| SurveyMonkey/Axios | Oct 1–28, 2020 | 7,424 (LV) | – | 36% | 62% | – | – | – | – |
| PPP/NPI | Oct 14–15, 2020 | 610 (LV) | ± 4% | 37% | 60% | – | – | – | 2% |
| SurveyUSA/KING-TV | Oct 8–10, 2020 | 591 (LV) | ± 5.2% | 34% | 55% | – | – | 5%[zf] | 5% |
| SurveyMonkey/Axios | Sep 1–30, 2020 | 7,953 (LV) | – | 35% | 64% | – | – | – | 2% |
| Strategies 360 | Sep 8–14, 2020 | 501 (RV) | ± 4.4% | 36% | 58% | – | – | – | 7%[zg] |
| SurveyMonkey/Axios | Aug 1–31, 2020 | 7,489 (LV) | – | 37% | 61% | – | – | – | 2% |
| SurveyMonkey/Axios | Jul 1–31, 2020 | 7,691 (LV) | – | 37% | 62% | – | – | – | 2% |
| SurveyUSA/KING-TV | Jul 22–27, 2020 | 534 (LV) | ± 5.2% | 28% | 62% | – | – | 6%[zh] | – |
| SurveyMonkey/Axios | Jun 8–30, 2020 | 3,939 (LV) | – | 36% | 62% | – | – | – | 2% |
| Public Policy Polling/NPI | May 19–20, 2020 | 1,070 (LV) | ± 3% | 37% | 59% | – | – | – | 5% |
| SurveyUSA/KING-TV | May 16–19, 2020 | 530 (LV) | ± 5.5% | 31% | 57% | – | – | 5%[zi] | 7% |
| EMC Research | Mar 31 – Apr 6, 2020 | 583 (A) | ± 4.1% | 39% | 52% | – | – | – | 9% |
| SurveyUSA/KING-TV | Mar 4–6, 2020 | 992 (RV) | ± 3.8% | 34% | 57% | – | – | – | 9% |
| Public Policy Polling/The Cascadia Advocate | Oct 22–23, 2019 | 900 (LV) | ± 3.3% | 37% | 59% | – | – | – | 3% |
| Zogby Interactive/JZ Analytics | Jul 22 – Aug 1, 2019 | 1,265 (LV) | ± 2.8% | 31% | 52% | – | – | – | 17% |
West Virginia
- Graphical summary
Graphs are unavailable due to technical issues. There is more info on Phabricator and on MediaWiki.org. |
Aggregate polls
| Source of poll aggregation |
Dates administered |
Dates updated |
Joe Biden Democratic |
Donald Trump Republican |
Other/ undecided [a] |
Margin |
|---|---|---|---|---|---|---|
| 270 to Win | October 13–23, 2020 | November 3, 2020 | 38.5% | 55.5% | 6.0% | Trump +17.0 |
| FiveThirtyEight | until November 2, 2020 | November 3, 2020 | 33.5% | 62.1% | 4.4% | Trump +28.6 |
| Average | 36.0% | 58.8% | 5.2% | Trump +22.8 | ||
Polls
| Poll source | Date(s) administered |
Sample size[zj] |
Margin of error |
Donald Trump Republican |
Joe Biden Democratic |
Jo Jorgensen Libertarian |
Howie Hawkins Mountain |
Other | Undecided |
|---|---|---|---|---|---|---|---|---|---|
| SurveyMonkey/Axios | Oct 20 – Nov 2, 2020 | 816 (LV) | ± 5% | 67%[zk] | 32% | – | – | – | – |
| SurveyMonkey/Axios | Oct 1–28, 2020 | 1,359 (LV) | – | 66% | 32% | – | – | – | – |
| Triton Polling and Research/WMOV | Oct 19–21, 2020 | 544 (LV) | ± 4.2% | 58% | 38% | – | – | – | 4% |
| Research America Inc./West Virginia Metro News | Oct 6–9, 2020 | 450 (LV) | ± 4.6% | 53% | 39% | 4% | 1% | – | 3% |
| Triton Polling & Research/WMOV | Sep 29–30, 2020[zl] | 525 (RV) | ± 4.3% | 56% | 38% | – | – | – | 5% |
| SurveyMonkey/Axios | Sep 1–30, 2020 | 516 (LV) | – | 62% | 36% | – | – | – | 2% |
| SurveyMonkey/Axios | Aug 1–31, 2020 | 496 (LV) | – | 65% | 32% | – | – | – | 2% |
| SurveyMonkey/Axios | Jul 1–31, 2020 | 494 (LV) | – | 67% | 32% | – | – | – | 1% |
| SurveyMonkey/Axios | Jun 8–30, 2020 | 264 (LV) | – | 72% | 27% | – | – | – | 1% |
| WPA Intelligence/Club for Growth[DS] | Jan 7–9, 2020 | 500 (LV) | ± 4.4% | 66% | 31% | – | – | – | 3% |
Wisconsin
Graphical summary
Graphs are unavailable due to technical issues. There is more info on Phabricator and on MediaWiki.org. |
Aggregate polls
| Source of poll aggregation |
Dates administered |
Dates updated |
Donald Trump Republican |
Joe Biden Democratic |
Other/ Undecided [a] |
Margin |
|---|---|---|---|---|---|---|
| 270 to Win | November 1–2, 2020 | November 3, 2020 | 42.8% | 52.0% | 5.2% | Biden +9.2 |
| Real Clear Politics | October 21 – November 1, 2020 | November 3, 2020 | 44.3% | 51.0% | 4.7% | Biden +6.7 |
| FiveThirtyEight | until November 2, 2020 | November 3, 2020 | 43.7% | 52.1% | 4.2% | Biden +8.4 |
| Average | 43.6% | 51.7% | 4.7% | Biden +8.1 | ||
2020 polls
| Poll source | Date(s) administered |
Sample size[zm] |
Margin of error |
Donald Trump Republican |
Joe Biden Democratic |
Jo Jorgensen Libertarian |
Howie Hawkins Green |
Other | Undecided |
|---|---|---|---|---|---|---|---|---|---|
| SurveyMonkey/Axios | Oct 20 – Nov 2 | 2,814 (LV) | ± 2.5% | 44%[zn] | 54% | - | - | – | – |
| Research Co. | Oct 31 – Nov 1 | 450 (LV) | ± 4.6% | 45% | 54% | - | - | 1%[dn] | 7% |
| Change Research/CNBC | Oct 29 – Nov 1 | 553 (LV) | ± 4.17% | 45% | 53% | 2% | - | – | 0% |
| Civiqs/Daily Kos | Oct 29 – Nov 1 | 789 (LV) | ± 3.6% | 47% | 51% | - | - | 1%[dn] | 0% |
| Swayable Archived November 13, 2020, at the Wayback Machine | Oct 27 – Nov 1 | 253 (LV) | ± 8.2% | 45% | 55% | 1% | - | – | – |
| Ipsos/Reuters | Oct 27 – Nov 1 | 696 (LV) | ± 4.2% | 43%[o] | 53% | 2% | 0% | 2%[zo] | – |
| 43%[zp] | 53% | - | - | 2%[r] | 2% | ||||
| 45%[zq] | 53% | - | - | 2%[zr] | – | ||||
| AtlasIntel | Oct 30–31 | 781 (LV) | ± 3% | 49% | 51% | - | - | – | 1% |
| Susquehanna Polling & Research Inc./Center for American Greatness Archived October 31, 2020, at the Wayback Machine[H] | Oct 29–31 | 450 (LV) | ± 4.6% | 46% | 49% | - | - | 2%[zs] | 1% |
| Morning Consult | Oct 22–31 | 1,002 (LV) | ± 3% | 41% | 54% | - | - | – | – |
| Emerson College | Oct 29–30 | 751 (LV) | ± 3.1% | 45%[ai] | 52% | - | - | 2%[ah] | – |
| AtlasIntel | Oct 29–30 | 672 (LV) | ± 4% | 50% | 49% | - | - | 2% | – |
| CNN/SSRS Archived October 31, 2020, at the Wayback Machine | Oct 29–30 | 873 (LV) | ± 3.9% | 44% | 52% | 3% | - | 0%[zt] | 2% |
| Siena College/NYT Upshot | Oct 26–30 | 1,253 (LV) | ± 3.2% | 41% | 52% | 2% | - | 1%[zu] | 4%[xm] |
| Redfield & Wilton Strategies | Oct 26–29 | 800 (LV) | – | 41% | 53% | 2% | - | 1% | 2% |
| SurveyMonkey/Axios | Oct 1–28 | 4,569 (LV) | ± 2.0% | 43% | 55% | - | - | – | – |
| Swayable | Oct 23–26 | 313 (LV) | ± 7.2% | 45% | 54% | 1% | - | – | – |
| Ipsos/Reuters | Oct 20–26 | 664 (LV) | ± 4.3% | 44%[o] | 53% | 2% | 1% | 3%[rh] | – |
| 44%[zp] | 53% | - | - | 2%[r] | 2% | ||||
| Trafalgar Group | Oct 24–25 | 1,082 (LV) | ± 2.89% | 47% | 47% | 3% | - | 1%[dn] | 1% |
| Marquette Law School | Oct 21–25 | 749 (LV) | ± 4.4% | 43% | 48% | 2% | - | 7%[zv] | 0% |
| ABC/Washington Post | Oct 20–25 | 809 (LV) | ± 4% | 40% | 57% | 2% | - | 1%[zw] | 1% |
| Gravis Marketing | Oct 23 | 677 (LV) | ± 3.8% | 43% | 54% | - | - | – | 3% |
| YouGov/University of Wisconsin-Madison | Oct 13–21 | 647 (LV) | ± 4.07% | 44% | 53% | - | - | 3%[zx] | – |
| Fox News | Oct 17–20 | 1,037 (LV) | ± 3% | 44% | 49% | 2% | - | 1%[zy] | 4% |
| RMG Research/PoliticalIQ Archived October 23, 2020, at the Wayback Machine | Oct 14–20 | 800 (LV) | ± 3.5% | 44%[o] | 50% | - | - | 3%[ac] | 4% |
| 42%[zz] | 52% | - | - | 3%[ac] | 4% | ||||
| 45%[aaa] | 48% | - | - | 3%[ac] | 4% | ||||
| Morning Consult | Oct 11–20 | 1,038 (LV) | ± 3% | 42% | 54% | - | - | – | – |
| Susquehanna Polling and Research Inc./Center for American Greatness Archived October 23, 2020, at the Wayback Machine[H] | Oct 16–19 | 500 (LV) | ± 4.3% | 45% | 45% | 5% | - | 3%[aab] | 3% |
| Change Research/CNBC | Oct 16–19 | 447 (LV)[al] | – | 44% | 52% | - | - | – | – |
| Latino Decisions/DFER[DT] | Oct 14–19 | 400 (LV) | ± 5% | 45% | 50% | - | - | – | 4% |
| Ipsos/Reuters | Oct 13–19 | 663 (LV) | ± 4.3% | 45%[o] | 51% | 2% | 0% | 3%[aac] | – |
| 43%[zp] | 51% | - | - | 3%[af] | 3% | ||||
| Trafalgar Group | Oct 14–16 | 1,051 (LV) | ± 2.94% | 46% | 48% | 2% | - | 1% | 3% |
| YouGov/CBS | Oct 13–16 | 1,112 (LV) | ± 3.5% | 45% | 50% | - | - | 3%[ap] | 2% |
| Trafalgar Group/Restoration PAC[AX] | Oct 11–13 | 1,043 (LV) | ± 2.95% | 45% | 47% | 3% | – | 2%[ah] | 3% |
| Redfield & Wilton Strategies | Oct 10–13 | 691 (LV) | – | 40%[al] | 53% | 2% | 0% | – | – |
| David Binder Research/Focus on Rural America | Oct 10–13 | 200 (LV) | – | 43% | 53% | - | - | – | – |
| Civiqs/Rust Belt Rising[AY] | Oct 8–11 | 560 (LV) | ± 4.4% | 45% | 53% | - | - | 2%[ah] | 1% |
| Siena College/NYT Upshot | Oct 8–11 | 789 (LV) | ± 4% | 41% | 51% | 3% | - | 0%[aad] | 5%[xm] |
| Ipsos/Reuters | Oct 6–11 | 577 (LV) | ± 4.7% | 45%[o] | 51% | 2% | 0% | 1%[rh] | – |
| 44%[zp] | 51% | - | - | 3%[af] | 2% | ||||
| Morning Consult | Oct 2–11 | 1,067 (LV) | ± 3% | 44% | 51% | - | - | – | – |
| Redfield & Wilton Strategies | Oct 9–10 | 613 (LV) | – | 45%[al] | 49% | 2% | - | – | – |
| Baldwin Wallace University | Sep 30 – Oct 8 | 883 (LV) | ± 3.4% | 43% | 49% | 2% | 0% | 1%[th] | 6% |
| Redfield & Wilton Strategies | Oct 4–7 | 688 (LV) | ± 3.74% | 41% | 51% | 1% | - | 1%[aw] | 6% |
| Ipsos/Reuters | Sep 29 – Oct 5 | 601 (LV) | ± 4.6% | 44% | 50% | - | - | 2%[r] | 4% |
| Change Research/CNBC | Oct 2–4 | 442 (LV) | – | 44% | 51% | - | - | – | – |
| Marquette Law School[38] | Sep 30 – Oct 4 | 805 (RV) | – | 41% | 46% | 5% | - | 7%[aae] | 2% |
| 700 (LV) | 42% | 47% | 4% | - | 2%[aaf] | 1% | |||
| SurveyMonkey/Axios | Sep 1–30 | 3,806 (LV) | – | 44% | 53% | - | - | – | 2% |
| Trafalgar Group/Restoration PAC[AX] | Sep 25–28 | 1,084 (LV) | ± 2.89% | 44% | 47% | 3% | - | 2%[aag] | 3% |
| Redfield & Wilton Strategies | Sep 23–27 | 663 (LV) | ± 3.81% | 43% | 48% | 2% | - | 0%[lp] | 7% |
| Susquehanna Polling & Research Inc./Center for American Greatness[H] | Sep 23–26 | 500 (LV) | ± 4.3% | 46% | 48% | - | - | – | – |
| Trafalgar Group (R) | Sep 22–24 | 1,189 (LV) | ± 2.76% | 45% | 48% | 3% | - | 2%[aag] | 3% |
| Marist College/NBC | Sep 20–24 | 727 (LV) | ± 4.6% | 44% | 54% | - | - | 1% | 1% |
| Baldwin Wallace University | Sep 9–22 | 863 (LV) | ± 3.7% | 41% | 50% | 2% | 0% | 1%[th] | 6% |
| YouGov/UW-Madison Elections Research Center/Wisconsin State Journal |
Sep 10–21 | 664 (LV) | – | 46% | 50% | - | - | – | – |
| Change Research/CNBC | Sep 18–20 | 571 (LV) | – | 42% | 51% | - | - | – | – |
| Hart Research Associates/Human Rights Campaign[permanent dead link][DU] | Sep 17–19 | 400 (LV) | ± 4.9% | 44% | 51% | - | - | – | – |
| Redfield & Wilton Strategies | Sep 12–16 | 636 (LV) | ± 3.89% | 41% | 47% | 1% | 1% | 1%[aw] | 10% |
| Ipsos/Reuters | Sep 11–16 | 609 (LV) | – | 43% | 48% | - | - | 2%[r] | 6% |
| Morning Consult | Sep 7–16 | 800 (LV) | ± 3.5% | 42%[aah] | 51% | - | - | – | – |
| Civiqs/Rust Belt Rising[AY] | Sep 11–15 | 549 (RV) | ± 3.9% | 44%[al] | 51% | - | - | 2%[ah] | 2% |
| Morning Consult | Sep 6–15 | 800 (LV) | ± 3.5% | 42% | 51% | - | - | – | – |
| CNN/SSRS | Sep 9–13 | 816 (LV) | ± 4.2% | 42% | 52% | 3% | - | 1%[aai] | 1% |
| ABC/Washington Post | Sep 8–13 | 605 (LV) | ± 4.5% | 46% | 52% | - | - | 1%[aaj] | 1% |
| Siena College/NYT Upshot | Sep 8–10 | 760 (LV) | ± 4.7% | 43% | 48% | 2% | 0% | 2%[aak] | 6%[xm] |
| Emerson College | Sep 6–8 | 823 (LV) | ± 3.4% | 45%[ai] | 52% | - | - | 4%[aal] | – |
| Benenson Strategy Group/GS Group/AARP | Aug 28 – Sep 8 | 1,200 (LV) | ± 2.8% | 45% | 50% | - | - | 1%[aam] | 4% |
| Change Research/CNBC | Sep 4–6 | 501 (LV) | – | 44% | 50% | - | - | 6%[aan] | – |
| Morning Consult | Aug 27 – Sep 5 | 763 (LV) | ± 3.5% | 44% | 50% | - | - | – | – |
| YouGov/CBS | Sep 2–4 | 978 (LV) | ± 3.7% | 44% | 50% | - | - | 2%[aao] | 4% |
| Redfield & Wilton Strategies | Aug 30 – Sep 4 | 670 (LV) | ± 3.78% | 41% | 50% | 2% | 0% | 0%[lp] | 6% |
| Marquette Law School | Aug 30 – Sep 3 | 688 (LV) | – | 44% | 48% | 4% | - | 2%[aap] | 2% |
| Pulse Opinion Research/Rasmussen Reports | Sep 1–2 | 1,000 (LV) | ± 3% | 43% | 51% | - | - | 3%[aaq] | 2% |
| Fox News | Aug 29 – Sep 1 | 801 (LV) | ± 3.5% | 42% | 50% | 2% | – | 1%[aar] | 5% |
| 853 (RV) | ± 3% | 41% | 49% | 2% | – | 2%[aas] | 5% | ||
| SurveyMonkey/Axios | Aug 1–31 | 1,913 (LV) | – | 49% | 48% | - | - | – | 2% |
| Opinium/The Guardian[39] | Aug 21–28 | 700 (LV) | – | 40% | 53% | - | - | 1% | 5% |
| Morning Consult | Aug 17–26 | 797 (LV) | ± 3.5% | 42% | 52% | - | - | – | – |
| Change Research/CNBC | Aug 21–23 | 925 (LV) | – | 44% | 49% | - | - | – | – |
| Trafalgar Group | Aug 14–23 | 1,011 (LV) | ± 2.99% | 46% | 45% | 4% | - | 2%[aat] | 3% |
| Hodas & Associates/Restoration PAC[AX] | Aug 17–20 | 600 (LV) | – | 44% | 52% | - | - | – | 4% |
| Redfield and Wilton Strategies | Aug 13–17 | 672 (LV) | ± 3.9% | 40% | 49% | 1% | 1% | 2%[aau] | 7% |
| Civiqs/Rust Belt Rising[AY] | Aug 13–17 | 753 (RV) | – | 45% | 51% | - | - | 2%[ah] | 2% |
| Morning Consult | Aug 7–16 | 788 (LV) | ± 3.5% | 43%[aav] | 49% | - | - | 2%[ah] | 5% |
| Morning Consult | Aug 4–13 | 797 (LV) | ± 3.5% | 43% | 50% | - | - | – | – |
| Change Research/CNBC | Aug 6–9 | 384 (LV) | – | 43% | 47% | - | - | – | – |
| Marquette Law School | Aug 4–9 | 694 (LV) | ± 3.8% | 46% | 50% | - | - | 3%[aaw] | 1% |
| YouGov/CBS | Aug 4–7 | 994 (LV) | ± 3.8% | 42% | 48% | - | - | 3%[ap] | 7% |
| Pulse Opinion Research/Rasmussen Reports/American Greatness PAC[permanent dead link][H] | Aug 5–6 | 750 (LV) | – | 43% | 55% | - | - | 1% | 1% |
| YouGov/University of Wisconsin-Madison | Jul 27 – Aug 6 | 734 (RV) | ± 4.9% | 43% | 49% | - | - | 4%[aax] | 4% |
| OnMessage Inc./Heritage Action[DV] | Aug 2–4 | 400 (LV) | ± 4.7% | 47% | 47% | - | - | – | 6% |
| Morning Consult | Jul 25 – Aug 3 | 797 (LV) | ± 3.5% | 41% | 51% | - | - | – | – |
| David Binder Research | Jul 30–31 | 200 (LV) | – | 42% | 53% | - | - | – | – |
| SurveyMonkey/Axios | Jul 1–31 | 2,173 (LV) | – | 48% | 50% | - | - | – | 2% |
| Hodas & Associates/Restoration PAC[AX] | Jul 22–27 | 600 (LV) | – | 38% | 52% | - | - | – | 10% |
| Change Research/CNBC[40] | Jul 24–26 | 392 (LV) | – | 43% | 48% | - | - | – | – |
| Redfield & Wilton Strategies | Jul 19–24 | 742 (LV) | – | 35% | 45% | 2% | 0% | 3%[aay] | 15% |
| Morning Consult | Jul 15–24 | 797 (LV) | ± 3.5% | 44% | 49% | - | - | – | – |
| Gravis Marketing | Jul 22 | 796 (RV) | ± 3.5% | 42% | 50% | - | - | – | 7% |
| Global Strategy Group (D) Archived August 7, 2020, at the Wayback Machine | Jul 11–17 | 600 (V) | ± 4.0% | 42% | 51% | - | - | 2%[aaz] | 4%[xm] |
| Spry Strategies/American Principles Project[DW] | Jul 11–16 | 700 (LV) | ± 3.7% | 45% | 46% | - | - | – | 8% |
| Morning Consult | Jul 5–14 | 797 (LV) | ± 3.5% | 41% | 50% | - | - | – | – |
| Change Research/CNBC | Jul 10–12 | 601 (LV) | – | 42% | 48% | - | - | – | – |
| Morning Consult | Jun 25 – Jul 4 | 797 (LV) | ± 3.5% | 44% | 50% | - | - | – | – |
| SurveyMonkey/Axios | Jun 8–30 | 813 (LV) | – | 47% | 51% | - | - | – | 2% |
| Change Research/CNBC | Jun 26–28 | 502 (LV)[al] | – | 43% | 51% | - | - | – | – |
| Trafalgar Group | Jun 25–26 | 1,021 (LV) | ± 3.0% | 46% | 45% | - | - | 8%[aba] | 2% |
| Ogden & Fry | Jun 20–24 | 825 (LV) | ± 3.48% | 44% | 45% | - | - | – | 10% |
| Morning Consult | Jun 15–24 | 797 (LV) | ± 3.5% | 44% | 50% | - | - | – | – |
| Redfield & Wilton Strategies | Jun 14–19 | 846 (LV) | ± 3.37% | 36% | 45% | 1% | 1% | 2%[abb] | 15% |
| Marquette Law School | Jun 14–18 | 686 (LV) | – | 44% | 52% | - | - | 3%[aaw] | 1% |
| Hodas & Associates/Restoration PAC (R) | Jun 12–16 | 600 (LV) | ± 4.0% | 39% | 55% | - | - | – | 6% |
| NYT Upshot/Siena College | Jun 8–15 | 655 (RV) | ± 4.3% | 38% | 49% | - | - | 5%[abc] | 8% |
| Morning Consult | Jun 5–14 | 797 (LV) | ± 3.5% | 44% | 49% | - | - | – | – |
| Change Research/CNBC | Jun 12–14 | 231 (LV)[al] | – | 44% | 48% | - | - | 5%[abd] | – |
| Morning Consult | May 26 – Jun 4 | 797 (LV) | ± 3.5% | 44% | 48% | - | - | – | – |
| Fox News | May 30 – Jun 2 | 801 (RV) | ± 3.5% | 40% | 49% | - | - | 6%[abe] | 5% |
| Change Research/CNBC | May 29–31 | 382 (LV)[al] | – | 45% | 45% | - | - | 5% | 6% |
| Morning Consult | May 16–25 | 797 (LV) | ± 3.5% | 44% | 48% | - | - | – | – |
| Morning Consult | May 6–15 | 797 (LV) | ± 3.5% | 42% | 49% | - | - | – | – |
| Redfield & Wilton Strategies | May 10–14 | 875 (LV) | ± 3.3% | 38% | 48% | - | - | 3%[abf] | 10% |
| Hodas & Associates/Restoration PAC (R) | May 6–8 | 600 (LV) | ± 3% | 42% | 51% | - | - | – | 8% |
| Marquette Law School | May 3–7 | 650 (LV) | – | 45% | 49% | - | - | 4%[abg] | 2% |
| Morning Consult | Apr 26 – May 5 | 797 (LV) | ± 3.5% | 43% | 49% | - | - | – | – |
| Public Policy Polling[DX] | Apr 20–21 | 1,415 (RV) | – | 45% | 50% | - | - | – | 4% |
| Ipsos | Apr 15–20 | 645 (RV) | ± 5.0% | 40% | 43% | - | - | – | – |
| Hodas & Associates/Restoration PAC (R) | Apr 13–15 | 600 (RV) | ± 3.0% | 45% | 50% | - | - | – | 4% |
| Hart Research/CAP Action Archived April 13, 2020, at the Wayback Machine[DY] | Apr 6–8 | 303 (RV) | – | 47% | 48% | - | - | 2% | 3% |
| Marquette Law School | Mar 24–29 | 813 (RV) | – | 45% | 48% | - | - | 4%[abg] | 3% |
| Baldwin Wallace University Great Lakes | Mar 17–25 | 822 (RV) | ± 3.8% | 45% | 45% | - | - | – | 10% |
| Change Research | Mar 21–23 | 510 (LV) | – | 49% | 45% | - | – | 6% | |
| Hodas & Associates/Restoration PAC (R) | Mar 17–19 | 600 (RV) | – | 49% | 45% | - | - | – | – |
| Public Policy Polling | Mar 10–11 | 1,727 (RV) | – | 45% | 48% | - | - | – | 6% |
| YouGov/Yahoo News | Mar 6–8 | 459 (RV) | – | 42% | 44% | - | - | 6%[abh] | 7% |
| Firehouse Strategies/Øptimus Archived March 20, 2020, at the Wayback Machine | Mar 5–7 | 502 (LV) | ± 4.7% | 45% | 43% | - | - | – | – |
| Marquette Law School | Feb 19–23 | 1,000 (RV) | – | 46% | 46% | - | - | 5%[abi] | 3% |
| YouGov | Feb 11–20 | 936 (RV) | ± 4.0% | 43% | 45% | - | - | – | – |
| Quinnipiac University Archived May 13, 2020, at the Wayback Machine | Feb 12–18 | 823 (RV) | ± 3.4% | 49% | 42% | - | - | 4%[abj] | 4% |
| Expedition Strategies/Progressive Policies Institute | Feb 6–18 | 500 (RV) | – | 44% | 42% | - | - | – | 13% |
| Tarrance Group/Wisconsin Manufacturers and Commerce Archived February 13, 2020, at the Wayback Machine | Jan 14–16 | 500 (LV) | ± 4.5% | 46% | 47% | - | - | – | 6% |
| Marquette Law School[41][42] | Jan 8–12 | 701 (LV) | – | 47% | 48% | - | - | 4%[abg] | 2% |
| Fox News | Jan 5–8 | 1,504 (RV) | ± 2.5% | 41% | 46% | - | - | 8%[abk] | 4% |
2019 polls
| Poll source | Date(s) administered |
Sample size[zm] |
Margin of error |
Donald Trump Republican |
Joe Biden Democratic |
Other | Undecided |
|---|---|---|---|---|---|---|---|
| Marquette Law School[43] | Dec 3–8 | 652 (LV) | – | 47% | 49% | 2%[abl] | 1% |
| Firehouse Strategies/Øptimus | Dec 3–5 | 610 (LV) | ± 4.1% | 48% | 39% | 8%[abm] | 5%[xm] |
| Marquette Law School[44][45] | Nov 13–17 | 685 (LV) | – | 48% | 45% | 5%[abn] | 2% |
| NYT Upshot/Siena College | Oct 13–26 | 651 (LV) | ± 4.4% | 44% | 46% | – | – |
| Marquette Law School[46][47] | Oct 13–17 | 657 (LV) | – | 44% | 51% | 3%[abo] | 1% |
| Fox News | Sep 29 – Oct 2 | 1,512 (RV) | ± 2.5% | 39% | 48% | 5% | 6% |
| Firehouse Strategies/Øptimus Archived September 12, 2019, at the Wayback Machine | Sep 7–9 | 534 (LV) | ± 4.0% | 42% | 44% | 14% | – |
| Marquette Law School[48] | Aug 25–29 | 672 (LV) | – | 44% | 51% | 3%[aaw] | 2% |
| Firehouse Strategies/Øptimus | Jun 11–13 | 535 (LV) | ± 4.3% | 40% | 46% | 14% | – |
| WPA Intelligence | Apr 27–30 | 200 (LV) | ± 6.9% | 46% | 42% | – | 9% |
| Zogby Analytics | Apr 15–18 | 802 (LV) | ± 3.5% | 40% | 50% | – | 11% |
| Firehouse Strategies/Øptimus Archived April 3, 2019, at the Wayback Machine | Mar 19–21 | 616 (LV) | ± 4.1% | 40% | 53% | 5% | – |
| Emerson College Archived April 20, 2019, at the Wayback Machine | Mar 15–17 | 775 (RV) | ± 3.5% | 46% | 54% | – | – |
See also
- Nationwide opinion polling for the 2020 United States presidential election
- Nationwide opinion polling for the 2020 Democratic Party presidential primaries
- Statewide opinion polling for the 2020 Democratic Party presidential primaries
- Opinion polling for the 2020 Republican Party presidential primaries
- 2020 Democratic National Convention
- 2020 Republican National Convention
Notes
- General footnotes
- ^ a b c d e f g h i j k l m n o p q r s t u v w x y z aa ab ac ad ae af ag ah ai aj ak al am an ao Calculated by taking the difference of 100% and all other candidates combined.
- ^ Key:
A – all adults
RV – registered voters
LV – likely voters
V – unclear - ^ Overlapping sample with the previous SurveyMonkey/Axios poll, but more information available regarding sample size
- ^ "Other candidate or write-in" with 0%
- ^ "Refused" with 0%
- ^ "Someone else" with 2%
- ^ Calculated by taking the difference of 100% and all other candidates combined.
- ^ Key:
A – all adults
RV – registered voters
LV – likely voters
V – unclear - ^ Overlapping sample with the previous SurveyMonkey/Axios poll, but more information available regarding sample size
- ^ "Someone else" and would not vote with 1%
- ^ Includes "Refused"
- ^ "Someone else" with 3%
- ^ Poll's funding crowdsourced by Election Twitter.
- ^ a b Key:
A – all adults
RV – registered voters
LV – likely voters
V – unclear - ^ a b c d e f g h i j k l m n o p q r s t u v w x y z aa ab ac ad ae af ag ah ai aj ak al am an ao ap aq ar as at au av aw ax ay az ba Standard VI response
- ^ "Some other candidate" and West (B) with 1%; would not vote with 0%
- ^ a b c d If only Biden, Trump and "some other candidate" were available
- ^ a b c d e f g h i j k l m n o p q "Some other candidate" with 2%; would not vote with 0%
- ^ Results considering those who lean towards a given candidate among those initially predisposed towards abstention, indecision or a candidate besides Biden or Trump in the response section immediately above
- ^ "Some other candidate" with 2%
- ^ Overlapping sample with the previous SurveyMonkey/Axios poll, but more information available regarding sample size
- ^ "Other candidate or write-in" with 0%
- ^ "Other" with 1.5%
- ^ "Someone else" with 6%
- ^ "Refused" with 5%; "Other" with 1%
- ^ a b c d e "Someone else" with 1%; would not vote with 0%
- ^ a b c d e f g h Includes "Refused"
- ^ "None of these" with 1%; "Other" with no voters
- ^ a b c d e f g h i j "Some other candidate" with 3%
- ^ "Someone else" with 1.7%
- ^ "Some other candidate" with 2%; West (B) with 1%; would not vote with 0%
- ^ a b c d e f g h i j k l m n "Some other candidate" with 3%; would not vote with 0%
- ^ a b c "Refused" with 1%
- ^ a b c d e f g h i j k l m n o p q r s t u v w x y z aa ab ac ad ae af ag ah ai aj ak al am an ao ap aq ar as at au av "Someone else" with 2%
- ^ a b c d e f g h i j k l m n o p q r s t u v w x y z aa ab ac ad ae af ag ah ai aj With voters who lean towards a given candidate
- ^ "Other" with 1%; "Refused" with 0%
- ^ "Some other candidate" with 2%; West (B) and would not vote with 0%
- ^ a b c d e f g h i j k l m n o p q r s t u v w x y z aa ab ac ad ae af ag ah ai aj ak al am an Additional data sourced from FiveThirtyEight
- ^ Results generated with high Democratic turnout model
- ^ Results generated with high Republican turnout model
- ^ "Refused" with 4%; "Other" with 1%
- ^ a b c d "Someone else/third party" with 3%
- ^ "Some other candidate" and would not vote with 1%; West (B) with 0%
- ^ "Other candidate" with 1%; "No one" with no voters
- ^ With a likely voter turnout model featuring high turnout
- ^ With a likely voter turnout model featuring low turnout
- ^ a b c d "Refused" with 0%
- ^ a b c d If the only candidates were Biden and Trump
- ^ a b c d e f g h i j k l m n o p q r s t u "Another Third Party/Write-in" with 1%
- ^ "Refused" with 3%
- ^ "Some other candidate" with 3%; "Refused" with 2%
- ^ "Another candidate" with 2%
- ^ "Neither" with 2%; "other" with 0%; would not vote with no voters
- ^ "No one" with 1%; "Other candidate" with 0%
- ^ With a likely voter turnout model featuring higher turnout than in the 2016 presidential election
- ^ With a likely voter turnout model featuring lower turnout than in the 2016 presidential election
- ^ "Someone else" with 2%; would not vote with 1%; "Refused" with 0%
- ^ Would not vote with 1%
- ^ a b c d e f g h Overlapping sample with the previous Morning Consult poll, but more information available regarding sample size
- ^ "Other/not sure" with 6%
- ^ West (B) and "Another Third Party/Write-in" with 0%
- ^ "Other" with 1%
- ^ "Other" with 2%; would not vote with 1%
- ^ Listed as Jacob Hornberger (L)
- ^ a b West (B) with 2%; "Another third party/write-in" with 1%
- ^ "Another Party Candidate" with 1%
- ^ a b c d e f g h i j Not yet released
- ^ "Other" with 1%; "Neither" with 3%
- ^ "Someone else/third party" with 4%; would not vote with 0%
- ^ "Other" with 3.1%; "refused" with 0.2%
- ^ "other" with 2%
- ^ "Another candidate" and would not vote with 2%
- ^ "Someone else" with 5%
- ^ "Libertarian Party candidate/Green Party candidate" with 5%
- ^ "Other" with 5%; would not vote with 1%
- ^ "Some other candidate" with 4.3%
- ^ "Third party/write-in" with 3%
- ^ Key:
A – all adults
RV – registered voters
LV – likely voters
V – unclear - ^ Overlapping sample with the previous SurveyMonkey/Axios poll, but more information available regarding sample size
- ^ "Someone else" with 2%
- ^ "Another candidate" with 5%
- ^ Key:
A – all adults
RV – registered voters
LV – likely voters
V – unclear - ^ a b Overlapping sample with the previous SurveyMonkey/Axios poll, but more information available regarding sample size
- ^ "Someone else" with 4%
- ^ a b De La Fuente (A) and De La Riva (PSOL) with 0%
- ^ a b De La Fuente listed as Guerra
- ^ a b Would not vote with 1%; "Someone else" with no voters
- ^ "Another candidate" with 3%
- ^ "Another Third Party/Write-in" with 1%
- ^ Archived September 27, 2020, at the Wayback Machine
- ^ "Someone else" with 3%
- ^ "Another Third Party/Write-in" with 2%
- ^ "Someone else" with 4%; would not vote with 2%
- ^ Including voters who lean towards a given candidate
- ^ a b Other with 0%; neither with 3%
- ^ Key:
A – all adults
RV – registered voters
LV – likely voters
V – unclear - ^ Overlapping sample with the previous SurveyMonkey/Axios poll, but more information available regarding sample size
- ^ Additional data sourced from FiveThirtyEight
- ^ "Other candidate or write-in" with 0%
- ^ a b c d e f g h i j k l m n o "Someone else" with 3%
- ^ "Some other candidate" with 1%
- ^ a b "Other candidate" with 3%
- ^ "Some other candidate" with 5%
- ^ a b c Overlapping sample with the previous Morning Consult poll, but more information available regarding sample size
- ^ Would not vote with 2%
- ^ West (B) with 1%
- ^ Overlapping sample with the previous and subsequent Morning Consult polls, but more information available regarding sample size
- ^ Would not vote/would not vote for president with 1%
- ^ Key:
A – all adults
RV – registered voters
LV – likely voters
V – unclear - ^ Overlapping sample with the previous SurveyMonkey/Axios poll, but more information available regarding sample size
- ^ Archived November 27, 2020, at the Wayback Machine
- ^ Archived November 1, 2020, at the Wayback Machine
- ^ "Someone else" with 7%
- ^ "Someone else" with 2%; would not vote with 1%
- ^ a b c d e f g h i j k l m n o p q r s t u v w x y z aa ab ac ad ae af ag ah ai aj ak Key:
A – all adults
RV – registered voters
LV – likely voters
V – unclear - ^ Overlapping sample with the previous SurveyMonkey/Axios poll, but more information available regarding sample size
- ^ "None/other/undecided" with 10%
- ^ a b c d e f g h i j k l m n o p q r s t u v w x y z aa ab ac ad ae af ag ah ai aj ak "Someone else" with 1%
- ^ Overlapping sample with the previous SurveyMonkey/Axios poll, but more information available regarding sample size
- ^ "Refused/would not vote" with 2%; "Another candidate" with 0%
- ^ "Other candidate or write-in" with 0%
- ^ West (B) with 1%; "Some other candidate" and would not vote with 0%
- ^ a b c d If only Biden, Trump and "some other candidate" were available
- ^ Results considering those who lean towards a given candidate among those initially predisposed towards abstention, indecision or a candidate besides Biden or Trump in the response section immediately above
- ^ a b c d e f g h i j k l m n o p q "Some other candidate" with 2%
- ^ "Someone else" with 3%
- ^ a b c d e f g "Someone else" and would not vote with 0%
- ^ a b c d e f g h i j k l m Includes "Refused"
- ^ a b c d e f g h i Results generated with high Democratic turnout model
- ^ a b c d e f g h i Results generated with high Republican turnout model
- ^ "Not sure/Someone else/Undecided" with 2%
- ^ "None of these" and "Other" with 0%; would not vote with no voters
- ^ "Other candidate" with 1%; "No one" with 0%
- ^ With a likely voter turnout model featuring high turnout
- ^ With a likely voter turnout model featuring low turnout
- ^ a b "Some other candidate" and West (B) with 1%; would not vote with 0%
- ^ "Some other candidate" with 3%; would not vote with 0%
- ^ "Refused/would not vote" with 2%; "Another candidate" with 1%
- ^ a b c d e f g h i j Not yet released
- ^ "Refused" with 3%
- ^ "Other third party" with 2%
- ^ a b c "Third party" with 2%
- ^ a b c "Some other candidate" with 1%
- ^ "Some other candidate" with 3%
- ^ a b c "Some other candidate" with 1%; would not vote with 0%
- ^ "Other" and "None of these" with 0%
- ^ "Some other candidate" with 2%; West (B) and would not vote with 0%
- ^ "Third party" with 1%
- ^ With voters who lean towards a given candidate
- ^ "One of the other party or independent tickets" with 1%
- ^ a b c d e f g h i j k "Someone else" with 4%
- ^ Under a +2 Democratic turnout model
- ^ Under a conservative +2 Republican turnout model
- ^ No voters
- ^ "Refused" with 2%; La Riva (PSOL) with 1%; Blankenship (C), Fuente (A) and "other" with no voters
- ^ With the preferences of La Riva and Jorgensen voters in an election featuring only Biden and Trump
- ^ "Refused" with 2%; "Other" with 0%
- ^ "Neither" with 1%; "other" and would not vote with no voters
- ^ "Someone else/third party" with 1%
- ^ "No one" with 1%
- ^ With a likely voter turnout model featuring higher turnout than in the 2016 presidential election
- ^ a b "Other" with 1%
- ^ With a likely voter turnout model featuring lower turnout than in the 2016 presidential election
- ^ "Someone else" with 2%; "Refused" and would not vote with 1%
- ^ "Someone else" with 0%
- ^ Would not vote with 2%
- ^ "Other/not sure" with 4%
- ^ "Another Party Candidate" with 1%
- ^ "Refused" with 1%
- ^ "Other" and "Neither" 1%
- ^ "Someone else" with 4%; would not vote with 2%
- ^ "Third-party candidate" with 2%
- ^ "Someone else/third party" with 2%; would not vote with 0%
- ^ "Other party candidate" with 5%
- ^ "Other" with 4%; would not vote with 2%
- ^ "Another candidate" and would not vote with 2%
- ^ "Libertarian Party candidate/Green Party candidate" with 3%
- ^ "Other" with 3%; "prefer not to answer" with 1%
- ^ "Third party candidate" with 3.3%
- ^ "Third party" with 2.7%
- ^ "Libertarian nominee" with 1.2%
- ^ "Green nominee" with 0.4%
- ^ "Third party/write-in" with 3%
- ^ Would not vote with 6%
- ^ Overlapping sample with the previous SurveyMonkey/Axios poll, but more information available regarding sample size
- ^ Hawkins (G) and "Other candidate or write-in" with 0%
- ^ "Someone else" with 4%
- ^ "Other candidate" with 1%; "No one" with 0%
- ^ a b c d e f With a likely voter turnout model featuring higher turnout than in the 2016 presidential election
- ^ a b c d e f With a likely voter turnout model featuring lower turnout than in the 2016 presidential election
- ^ "Other third party" with 2%
- ^ "Other" with 2%; Hawkins (G) with 0%
- ^ "Someone else" with 5%
- ^ Hawkins (G) and "Someone else" with 1%; would not vote with 0%
- ^ "Someone else" with 3%; would not vote with 0%
- ^ "Some other candidate" with 2%
- ^ Hawkins (G) with 1%
- ^ a b Hawkins (G) with 1%; "Another Third Party/Write-in" with 0%
- ^ "No one" with 0%; "Other candidate" with no voters
- ^ "Someone else" and would not vote with 0%
- ^ Standard VI response
- ^ Hawkins (G) with 0%
- ^ If only Biden and Trump were candidates
- ^ Overlapping sample with the previous Morning Consult poll, but more information available regarding sample size
- ^ Would not vote with 1%
- ^ Hawkins (G) and would not vote with 0%
- ^ "Refused" with 2%
- ^ "Some other candidate" with 4%
- ^ "Someone else/third party" with 3%; would not vote with 0%
- ^ "Third party candidate" with 4%; would not vote with 2%
- ^ "Another Party candidate"
- ^ "Other" with 3%; "would not vote" with 1%
- ^ "Different candidate" with 8%; would not vote with 2%
- ^ Listed as "other/undecided"
- ^ "Undecided" with 5%; "Did not answer" with 2%
- ^ Wouldn't vote with 1%; don't know/refused with 3%
- ^ Overlapping sample with the previous SurveyMonkey/Axios poll, but more information available regarding sample size
- ^ "Neither" with 4%
- ^ "Neither" with 6%
- ^ Overlapping sample with the previous SurveyMonkey/Axios poll, but more information available regarding sample size
- ^ Additional data sourced from FiveThirtyEight
- ^ Overlapping sample with the previous SurveyMonkey/Axios poll, but more information available regarding sample size
- ^ "Don't recall" with 2%
- ^ "Someone else" with 3%
- ^ "Other candidate or write-in" with 1%
- ^ "Refused" with 5%; "Someone else" with 3%; would not vote with 0%
- ^ Includes "Do not remember"
- ^ "Someone else" with 1%
- ^ Results generated with high Democratic turnout model
- ^ Results generated with high Republican turnout model
- ^ a b c Includes "Refused"
- ^ No voters
- ^ "Another candidate" and "No one" with 1%
- ^ "Other third party" with 2%
- ^ "One of the other candidates" with 2%; West (B) with 1%
- ^ a b If the only candidates were Biden and Trump
- ^ "Other candidate" with 2%
- ^ "Another candidate" with 1%; "No one" with no voters
- ^ a b "Hawkins/Other" with 2%
- ^ Would not vote with 1%
- ^ "Other" and "No-one" with <1%
- ^ "Other" with <1%
- ^ "Other" with 0%
- ^ "Someone else" with 9%; would not vote with 1%
- ^ "Someone else" with 7%
- ^ Other with 2%; would not vote with 3%
- ^ Overlapping sample with the previous SurveyMonkey/Axios poll, but more information available regarding sample size
- ^ Hawkins (G) and "Other candidate/write-in" with 1%
- ^ "Someone else" and would not vote with 1%
- ^ Includes "Refused"
- ^ "Neither of the two candidates" with 11%
- ^ "Someone else" with 4%
- ^ Standard VI response
- ^ Hawkins (G) with 1%
- ^ If only Trump and Biden were candidates
- ^ "Some other candidate" with 5%
- ^ "Someone else" with 6%
- ^ Overlapping sample with the previous SurveyMonkey/Axios poll, but more information available regarding sample size
- ^ Standard VI response
- ^ Hawkins (G) with 1%
- ^ If only Trump and Biden were candidates
- ^ "Someone else" with 1%
- ^ "Someone else" with 3%; would not vote with 1%
- ^ "Someone else" with 2%
- ^ a b "Someone else" with 5%
- ^ "Some other candidate" with 6%
- ^ Additional data sourced from FiveThirtyEight
- ^ Did not vote with 1%; "Don't recall" and would not vote with 0%
- ^ Overlapping sample with the previous SurveyMonkey/Axios poll, but more information available regarding sample size
- ^ With voters who lean towards a given candidate
- ^ "Someone else" with 2%
- ^ De La Fuente (A) with 1%
- ^ a b Reassigning the second and third preferences of non-Biden/Trump voters
- ^ "No second choice"/"no third choice" with 1%
- ^ "One of the minor party candidates" with 4%
- ^ "All other candidates" with 6%
- ^ "Refused" with 2%; De La Fuente (A) with no voters
- ^ Ressigning the second preferences of Hawkins and Jorgensen voters
- ^ "Refused" with 2%; De La Fuente (A), "No second preference" and "Someone else" with 1%; Hawkins (G) with 0%; Jorgensen (L) with no voters
- ^ If the only candidates were Biden and Trump
- ^ "A minor party candidate" with 4%
- ^ "Refused" with 1%; Fuente (A) and "Other" with 0%
- ^ "Refused" with 1%; Fuente (A) and Hawkins (G) with 0%; Jorgensen (L) and "Other" with no voters
- ^ Topline after Ranked-Choice Voting is used
- ^ "Someone else" with 0%; would not vote with 1%
- ^ Includes "Refused"
- ^ "Someone else" with 0%
- ^ Would not vote with 1%
- ^ "Someone else" with 8%; "Prefer not to say" and would not vote with 1%
- ^ "Someone else" and would not vote with 3%
- ^ "Some other candidate" with 7%
- ^ If only Biden and Trump were candidates
- ^ "One of the minor party candidates" with 5%
- ^ Overlapping sample with the previous SurveyMonkey/Axios poll, but more information available regarding sample size
- ^ "Refused" with 3%
- ^ "Other" with 1%; would not vote with 0%
- ^ Includes "Refused"
- ^ "Some other candidate" with 5%; "Refused" with 3%; would not vote with no voters
- ^ "Other" with 3%; would not vote with 0%
- ^ "Another candidate" with 2%; "Refused" with 3%
- ^ "Some other candidate" with 7%; would not vote with 3%
- ^ Including voters who lean towards a given candidate
- ^ "Another candidate" with 7%
- ^ Overlapping sample with the previous SurveyMonkey/Axios poll, but more information available regarding sample size
- ^ a b c "Some other candidate" with 2%; West (B) and would not vote with 0%
- ^ a b c d If only Biden, Trump and "some other candidate" were available
- ^ Results considering those who lean towards a given candidate among those initially predisposed towards abstention, indecision or a candidate besides Biden or Trump in the response section immediately above
- ^ "Some other candidate" with 2%
- ^ "Not sure/Someone else/Undecided" with 8%
- ^ "None of these" with 1%; "Other" with 0%
- ^ "Someone else" with no voters
- ^ "Third party" with 5%
- ^ "Other/third party" with 2%
- ^ "Someone else" with 0%
- ^ "Someone else" and would not vote with 0%
- ^ "Third party" with 2%
- ^ "Other" and "None of these" with 0%; would not vote with no voters
- ^ Includes Undecided
- ^ "Other" with 2%; would not vote with no voters
- ^ a b c "Third party candidate" with 5%
- ^ "Some other candidate" and West (B) with 1%; would not vote with 0%
- ^ "Third party candidate" with 4%
- ^ "Someone else" with 4%
- ^ "Someone else" with 1%; would not vote with 0%
- ^ "Other third party" with 2%
- ^ "Another candidate" with 0%
- ^ "Refused" with 3%; "Third Party" with 2%
- ^ a b c d e f "Another Third Party/Write-in" with 0%
- ^ "Someone else" with 1.2%
- ^ "Another candidate" with 1%
- ^ If only Trump and Biden were candidates
- ^ "Someone else" with 7%; "Refused" with 1%; would not vote with 0%
- ^ Would not vote with 1%
- ^ Overlapping sample with the previous Morning Consult poll, but more information available regarding sample size
- ^ "Other/not sure" with 7%
- ^ "Some other candidate" with 3%
- ^ "Refused" with 3%; "Third party" with 1%
- ^ Would not vote with 0%
- ^ "Another party candidate" with 1%
- ^ "Another third party/write-in" 1%
- ^ "Other" with 3%; would not vote with 2%
- ^ "Third party" with 6%
- ^ "Someone else/third party" with 2%; would not vote with 0%
- ^ "Another Third Party/Write-In" with 2%
- ^ "Other" with 1%; "Neither" with 4%
- ^ "Other" with 3%; would not vote with 1%
- ^ "Would vote third party" with 5%
- ^ "Refused" with 2%
- ^ "Another candidate" with 3%; Would not vote with 5%
- ^ "other" with 2%
- ^ "Refused/no answer" with 4%
- ^ "Libertarian Party candidate/Green Party candidate" with 3%
- ^ "Other" with 4%; "prefer not to answer" with 0%
- ^ "A different candidate" with 6%
- ^ "Third party" with 4%
- ^ "Third party/write-in" with 3%
- ^ "Someone else" with 6%; "Refused" and would not vote with 1%
- ^ "Other" with 4%; would not vote with 2%
- ^ "Someone else" with 2%; would not vote with 4%
- ^ A third party candidate with 5%; would not vote with 3%
- ^ Would not vote with 5%
- ^ Overlapping sample with the previous SurveyMonkey/Axios poll, but more information available regarding sample size
- ^ "Someone else" with 1%
- ^ "Other candidate or write-in" with 1%
- ^ "Not sure/Someone else/Undecided" with 3%
- ^ "Some other candidate" with 5%
- ^ West (B) with 3%; "Someone else" with 1%
- ^ Additional data sourced from FiveThirtyEight
- ^ "Another Third Party Candidate" and West (B) with 1%; would not vote with 0%
- ^ "Some other candidate" with 3%
- ^ "Refused" with 2%; Fuente (A), "Other" and West (B) with 1%; Pierce (I) with 0%; Kennedy (SWP) and La Riva (PSOL) with no voters
- ^ "Another Third Party/Write-in" with 1%
- ^ "Neither" with 1%; "Other" and would not vote with 0%
- ^ "Someone else/third party" with 2%
- ^ "Someone else" and would not vote with 0%
- ^ Includes "Refused"
- ^ "Some other candidate" with 4%
- ^ "Another Party Candidate" with 1%
- ^ Including voters who lean towards a given candidate
- ^ "Another Party Candidate"
- ^ "Other" with 5%; would not vote with 1%
- ^ Including undecided voters who lean towards Trump
- ^ Including undecided voters who lean towards Biden
- ^ Overlapping sample with the previous SurveyMonkey/Axios poll, but more information available regarding sample size
- ^ "Other candidate or write-in" with 1%
- ^ "Someone else" with 3%
- ^ "Refused" with no voters
- ^ Additional data sourced from FiveThirtyEight
- ^ "Someone else" with 6%
- ^ Overlapping sample with the previous SurveyMonkey/Axios poll, but more information available regarding sample size
- ^ "Someone else" with 5%
- ^ "Another Party Candidate" with 1%
- ^ "Someone else" with 3%
- ^ "Don't recall" with 1%
- ^ Overlapping sample with the previous SurveyMonkey/Axios poll, but more information available regarding sample size
- ^ "Someone else" with 2%; would not vote with 0%
- ^ a b c d e f g h i j k l m n o p q Includes "Refused"
- ^ Standard VI response
- ^ Results generated with high Democratic turnout model
- ^ Results generated with high Republican turnout model
- ^ "Someone else" with 2%
- ^ Hawkins (G) with 0%
- ^ Hawkins (G) and would not vote with 1%; "someone else" with 0%
- ^ "Refused" with 0%
- ^ Including voters who lean towards a given candidate
- ^ "Someone else" with 5%
- ^ Listed as "other/not sure"
- ^ Overlapping sample with the previous SurveyMonkey/Axios poll, but more information available regarding sample size
- ^ "Don't recall" and Would not vote with 0%
- ^ With voters tho lean towards a given candidate
- ^ "Someone else" with 2%
- ^ "Undecided, will vote for another candidate or refused to answer" with 5%
- ^ would not vote with 1%; "someone else" with 0%
- ^ "Other candidate" with 1%
- ^ "Other candidate" with 2%
- ^ Overlapping sample with the previous SurveyMonkey/Axios poll, but more information available regarding sample size
- ^ "Other candidate or write-in" with 2%; Undecided with 0%
- ^ "Someone else" with 4%
- ^ "Someone else" and would not vote with 1%
- ^ "Someone else" with 3%
- ^ "None of these candidates" with 4%; Blankenship (C) with 1%
- ^ "Other third party" with 2%
- ^ "Someone else" with 1%; would not vote with 0%
- ^ "Some other candidate" with 2%
- ^ "Another candidate" with 4%; "None of the candidates" with 3%
- ^ "Other" with 2%; would not vote with no voters
- ^ "Other" with 2%; would not vote with 1%
- ^ "Someone else" with 1%; would not vote and Hawkins (G) with 0%
- ^ "Someone else" with 5%
- ^ a b Other with 5%; would not vote with 4%
- ^ Overlapping sample with the previous SurveyMonkey/Axios poll, but more information available regarding sample size
- ^ "Another candidate" with 1%
- ^ a b c "Another candidate" with 0%
- ^ "Refused" with 2%; "Other" with 1%
- ^ "Someone else" with 2%
- ^ "Some other candidate" with 1%
- ^ Standard VI response
- ^ Hawkins (G) with 2%; "Another candidate" with 0%
- ^ With only Biden, Trump and "Another candidate" as options
- ^ "Someone else" and would not vote with 1%
- ^ Includes "Refused"
- ^ "Another candidate" with 4%
- ^ "Another candidate" with 6%
- ^ "Another candidate" with 5%
- ^ "Another candidate" with 8%
- ^ Data sourced from FiveThirtyEight
- ^ a b Data not yet released
- ^ Overlapping sample with the previous SurveyMonkey/Axios poll, but more information available regarding sample size
- ^ "Someone else" with 1%
- ^ "Neither" with 1%; "Someone else" with 0%
- ^ a b "Another candidate or unsure" with 10%
- ^ "Refused" with 4%; "Someone else" with 1%
- ^ With voters who lean towards a given candidate
- ^ "Someone else" with 2%
- ^ "Another candidate or unsure" with 15%
- ^ "For another candidate" with 7%
- ^ "Someone else" with 2%; would not vote with 1%
- ^ "Neither" with 4%; "someone else" with 1%
- ^ Overlapping sample with the previous SurveyMonkey/Axios poll, but more information available regarding sample size
- ^ "Other candidate" with 3%
- ^ "other" with 2%
- ^ Overlapping sample with the previous SurveyMonkey/Axios poll, but more information available regarding sample size
- ^ "Someone else" with 2%
- ^ Pierce (I) with 2%, "someone else" and would not vote with 0%
- ^ "Someone else" with 3%; would not vote with 2%
- ^ Overlapping sample with the previous SurveyMonkey/Axios poll, but more information available regarding sample size
- ^ "Some other candidate" and West (B) with 1%; would not vote with 0%
- ^ a b c d If only Biden, Trump and "some other candidate" were available
- ^ Results considering those who lean towards a given candidate among those initially predisposed towards abstention, indecision or a candidate besides Biden or Trump in the response section immediately above
- ^ "Other candidate or write-in" with 0%
- ^ "Someone else" with 6%
- ^ "None of these" with 1%; "Other" with 0%
- ^ "Some other candidate" with 2%; did/would not vote and "Refused" with 0%
- ^ a b No voters
- ^ Blankenship (C) with 2%
- ^ a b c d e "Some other candidate" with 1%; West (B) and would not vote with 0%
- ^ a b c "Another candidate" with 3%
- ^ "Another candidate" with 1%
- ^ Blankenship (C) with no voters
- ^ "Other third party" with 2%
- ^ "Someone else" with 0.6%; Blankenship (C) with 0.2%
- ^ a b Blankenship (C) with 0%
- ^ "Some other candidate" with 1%; did/would not vote and "Refused" with 0%
- ^ a b "Other", "None of these" and would not vote with 0%
- ^ If only Biden and Trump were candidates
- ^ "Someone else" with 1%; would not vote with 0%
- ^ Blankenship (C), "No one" and "Other candidate" with no voters
- ^ With a likely voter turnout model featuring high turnout
- ^ With a likely voter turnout model featuring low turnout
- ^ "Refused" with 1%; "Other" with 0%
- ^ "Some other candidate" with 2%; would not vote with no voters
- ^ "Someone else/third party" with 2%
- ^ "Another candidate" with 0%
- ^ With only Biden, Trump and "another candidate" as options
- ^ "Another candidate" with 2%
- ^ a b Blankenship (C) with 1%
- ^ "Refused" with 1.4%; "Other" with 0.4%; Blankenship (C) with no voters
- ^ "None of these" and "Other" with 0%; Blankenship (C) with no voters
- ^ "Someone else" with 3%; would not vote with 1%; "refused" with 0%
- ^ "Someone else" with 1%; Blankenship (C) with 0.5%
- ^ "Some other candidate" with 3%
- ^ Would not vote with 1%
- ^ Overlapping sample with the previous Morning Consult poll, but more information available regarding sample size
- ^ "Other/not sure" with 4%
- ^ "No one" with 1%; Blankenship and "Other candidate" with <1%
- ^ With a likely voter turnout model featuring higher turnout than in the 2016 presidential election
- ^ With a likely voter turnout model featuring lower turnout than in the 2016 presidential election
- ^ Blankenship (C) and "Other" with 0%
- ^ Blankenship (C) and would not vote with 1%; "Other" with 0%
- ^ "Other candidate" with 3%
- ^ Including voters who lean towards a given candidate
- ^ "Someone else/third party" with 2%; would not vote with 0%
- ^ "Third party candidate" with 3%; would not vote with 1%
- ^ "Some other candidate" with 7%
- ^ "Other" with 3%; would not vote with 2%
- ^ "Another candidate" with 3%; would not vote with 1%
- ^ "Third party/write-in" with 3%
- ^ "Other candidate" with 7%
- ^ "Someone else" with 4%
- ^ "Someone else" with 5%
- ^ The poll does not have a separate listing for this entry, which is instead added into the 'Other' grouping.
- ^ Refused/no answer with 0.2%
- ^ Overlapping sample with the previous SurveyMonkey/Axios poll, but more information available regarding sample size
- ^ "Other candidate" with 4%
- ^ "Other candidate" with 3%
- ^ Overlapping sample with the previous SurveyMonkey/Axios poll, but more information available regarding sample size
- ^ "Other" with 1%; would not vote with no voters
- ^ a b c d "Another candidate" with 1%
- ^ "Someone else" and would not vote with 0%
- ^ Includes "Refused"
- ^ "Someone else/third party" with 1%
- ^ "Other" and would not vote with no voters
- ^ "Other" with 0%; would not vote with no voters
- ^ a b "Other" and would not vote with 1%
- ^ Additional data sourced from FiveThirtyEight
- ^ "Someone else" with 5%
- ^ Overlapping sample with the previous Morning Consult poll, but more information available regarding sample size
- ^ "Someone else" with 4%
- ^ "Other and Undecided" with 8%
- ^ "Someone else/third party" with 2%; would not vote with 0%
- ^ "Other candidates" with 6%
- ^ "Someone else" with 3%; would not vote with 1%
- ^ "Other" with 4%; would not vote with 2%
- ^ Including voters who lean towards a given candidate
- ^ The poll below displays the results for voters who are sure how they will vote. This one incorporates the preferences of those who lean towards one of two candidates.
- ^ Overlapping sample with the previous SurveyMonkey/Axios poll, but more information available regarding sample size
- ^ a b West (B) with 1%; Pierce (I) and Simmons (I) with less than 1%
- ^ Pierce (I), Simmons (I), West (B) and "refused" with 1%
- ^ Would not vote with 2%
- ^ "Other candidate" with 5%
- ^ "Neither" with 3%; "refused" with 1%
- ^ Would not vote with 0%
- ^ Overlapping sample with the previous SurveyMonkey/Axios poll, but more information available regarding sample size
- ^ "Some other candidate" with 1%
- ^ a b "Other candidate" and "No one" with 0%
- ^ a b With a likely voter turnout model featuring high turnout
- ^ a b With a likely voter turnout model featuring low turnout
- ^ "Other candidate or write-in" with 0%
- ^ West (B) with 2%; "Some other candidate" and would not vote with 0%
- ^ a b c d If only Biden, Trump and "some other candidate" were available
- ^ Results considering those who lean towards a given candidate among those initially predisposed towards abstention, indecision or a candidate besides Biden or Trump in the response section immediately above
- ^ "Not sure/Someone else/Undecided" with 2%
- ^ "None of these" and "Other" with 0%; would not vote with no voters
- ^ "Neither/other" with 4%
- ^ "Some other candidate" with 1%; West (B) and would not vote with 0%
- ^ "Refused" with 1%; "Some other candidate" with 0%
- ^ Includes Undecided
- ^ "Other" with 1%; "None of these" with 0%
- ^ "Neither/other" with 2%
- ^ a b "Other" with 1%; would not vote with no voters
- ^ "Refused" with 3%; "Others" with 1%
- ^ "Some other candidate" with 2%; West (B) with 1%; would not vote with 0%
- ^ "Some other candidate" and would not vote with 1%; West (B) with 0%
- ^ "Some other candidate" with 1%; would not vote with 0%
- ^ "Another candidate" with 0%
- ^ "Someone else/third party" with 2%
- ^ "Neither" and "Other" with 0%; would not vote with no voters
- ^ "Other" with 1%; "Prefer not to answer" with 0%
- ^ "Other" and would not vote with 1%
- ^ "Another candidate" with 1%
- ^ "Third party candidate" with 1%
- ^ "Another Third Party/Write-in" with 0%
- ^ "Neither candidate or other candidate" with 3%
- ^ Would not vote with 1%
- ^ Overlapping sample with the previous Morning Consult poll, but more information available regarding sample size
- ^ "Other/not sure" with 4%
- ^ "Other" and "Refused" with 3%
- ^ "No one" with 1%; "Other candidate" with no voters
- ^ a b With a likely voter turnout model featuring higher turnout than in the 2016 presidential election
- ^ a b With a likely voter turnout model featuring lower turnout than in the 2016 presidential election
- ^ Additional data sourced from FiveThirtyEight; with voters who lean towards a given candidate
- ^ "Some other candidate" with 4%
- ^ "Some other candidate" with 3%
- ^ If only Biden and Trump were candidates
- ^ "Neither/other" with 3%
- ^ Including voters who lean towards a given candidate
- ^ "Someone else/third party" with 3%
- ^ "Other" with 2%; would not vote with 0%
- ^ West (B) and "Another Third Party/Write-In" with 1%
- ^ "Other" with 4%; would not vote with 1%
- ^ "Another candidate" with 3%; "No one" with 0%
- ^ "Other party candidate" with 6%
- ^ "other" with 1%
- ^ "Another candidate" with 2%; would not vote with 1%
- ^ "Libertarian Party candidate/Green Party candidate" with 3%
- ^ "Third party/write-in" with 2%
- ^ "Other" with 2%; would not vote with 3%
- ^ "Someone else" with 1%; would not vote with 5%
- ^ A third party candidate with 6%; will not vote with 2%
- ^ "Refused" and "Third party candidate" with 1%
- ^ Overlapping sample with the previous SurveyMonkey/Axios poll, but more information available regarding sample size
- ^ "Other candidate/write-in" with 0%
- ^ "Refused" with 2%; "Some other candidate" with 1%; Did/would not vote with 0%
- ^ would not vote with 1%; "Someone else" with 0%
- ^ Includes "Refused"
- ^ Standard VI response
- ^ If the only candidates were Biden and Trump
- ^ "Someone else" with 1%
- ^ "Someone else/third party" with 2%
- ^ Overlapping sample with the previous Morning Consult poll, but more information available regarding sample size
- ^ "Someone else" with 0%
- ^ "Someone else" and would not vote with 2%
- ^ Overlapping sample with the previous Morning Consult poll, but more information available regarding sample size and topline numbers
- ^ "Someone else" with 3%
- ^ "Someone else" with 5%
- ^ a b Generic
- ^ Overlapping sample with the previous SurveyMonkey/Axios poll, but more information available regarding sample size
- ^ "Someone else" and would not vote with 2%; "refused" with 1%
- ^ Key:
A – all adults
RV – registered voters
LV – likely voters
V – unclear - ^ Overlapping sample with the previous SurveyMonkey/Axios poll, but more information available regarding sample size
- ^ "Other candidate or write-in" with 0%
- ^ Standard VI response
- ^ Results generated with high Democratic turnout model
- ^ Results generated with high Republican turnout model
- ^ "Another candidate" with no voters
- ^ "Someone else" and would not vote with 1%
- ^ a b c d e f g Includes "Refused"
- ^ "Someone else" with 3%
- ^ Standard IV response
- ^ "Another candidate" with 1%
- ^ With only Biden, Trump and "another candidate" as options
- ^ "Another candidate" with 2%
- ^ "Someone else" and would not vote with 0%
- ^ "Someone else/third party" with 2%
- ^ a b c d Overlapping sample with the previous Morning Consult poll, but more information available regarding sample size
- ^ "Refused" with 0%
- ^ a b Overlapping sample with the previous and subsequent Morning Consult polls, but more information available regarding sample size
- ^ "Another party candidate" with 2%
- ^ a b c d e f g h Not yet released
- ^ "Someone else" with 4%; would not vote with 3%
- ^ "Someone else/third party" with 4%; would not vote with 0%
- ^ "Other" with 4%; would not vote with 1%
- ^ "Someone else" and would not vote with 3%
- ^ a b Including voters who lean towards a given candidate
- ^ Other with 1%; neither with 2%
- ^ "Neither-other" with 10%
- ^ Would not vote with 3%
- ^ Other with 0%; neither with 2%
- ^ "Someone else" with 9%
- ^ Key:
A – all adults
RV – registered voters
LV – likely voters
V – unclear - ^ Overlapping sample with the previous SurveyMonkey/Axios poll, but more information available regarding sample size
- ^ "Someone else" with 5%
- ^ "Third party candidate" with 8%; "other" with 1%
- ^ Other with 5%; would not vote with 3%
- ^ Other with 9%; would not vote with 4%
- ^ "A third-party candidate" with 10%; other with 4%
- ^ Key:
A – all adults
RV – registered voters
LV – likely voters
V – unclear - ^ Overlapping sample with the previous SurveyMonkey/Axios poll, but more information available regarding sample size
- ^ "Other candidate or write-in" with 1%
- ^ "Someone else" with 2%
- ^ "Third party candidate" with 2%
- ^ a b c d Includes "refused"
- ^ "Other", "None of these" and would not vote with 0%
- ^ "Someone else" with 3%
- ^ With voters who lean towards a given candidate
- ^ "Another candidate" with 2%
- ^ "Third party candidate" with 1%
- ^ "Some other candidate" with 3%
- ^ Additional data sourced from FiveThirtyEight
- ^ Key:
A – all adults
RV – registered voters
LV – likely voters
V – unclear - ^ Overlapping sample with the previous SurveyMonkey/Axios poll, but more information available regarding sample size
- ^ "Another candidate" with 5%
- ^ Includes "Refused"
- ^ "Another candidate" with 6%
- ^ "A candidate from another party" with 5%
- ^ Key:
A – all adults
RV – registered voters
LV – likely voters
V – unclear - ^ Overlapping sample with the previous SurveyMonkey/Axios poll, but more information available regarding sample size
- ^ Additional data sourced from FiveThirtyEight
- ^ a b Key:
A – all adults
RV – registered voters
LV – likely voters
V – unclear - ^ Overlapping sample with the previous SurveyMonkey/Axios poll, but more information available regarding sample size
- ^ "Some other candidate" with 2%; West (B) and would not vote with 0%
- ^ a b c d If only Biden, Trump and "some other candidate" were available
- ^ Results considering those who lean towards a given candidate among those initially predisposed towards abstention, indecision or a candidate besides Biden or Trump in the response section immediately above
- ^ "Some other candidate" with 2%
- ^ "Other" and "Refused/would not vote" with 1%
- ^ "None of these" and "Other" with 0%
- ^ "Someone else" with 1%; would not vote with 0%
- ^ "Refused" with 6%; "None/other" with 1%; Did not vote with 0%
- ^ "None of these" with 1%; "Other" with 0%; would not vote with no voters
- ^ Includes Undecided
- ^ "Other" with 1%; would not vote with no voters
- ^ Results generated with high Democratic turnout model
- ^ Results generated with high Republican turnout model
- ^ "Refused" with 2%; "Other" with 1%
- ^ "Some other candidate" with 2%; West (B) with 1%; would not vote with 0%
- ^ "Someone else" and would not vote with 0%
- ^ "None/other" with 2%; "refused" with 5%
- ^ "None/other" and "refused" with 1%
- ^ a b "Another Party Candidate" with 2%
- ^ Overlapping sample with the previous Morning Consult poll, but more information available regarding sampling period
- ^ "None of these" with 1%; "Other" with 0%
- ^ "Neither" with 1%; "Other" and would not vote with 0%
- ^ "Someone else" and would not vote with 1%
- ^ "Someone else" with 4%
- ^ Would not vote with 1%
- ^ "Other/not sure" with 6%
- ^ "Someone else/third party" with 2%
- ^ "Refused" with 2%; "None/other" with 0%
- ^ "Someone else" with 3%
- ^ "Other" with 1%
- ^ "Other" and would not vote with 1%
- ^ "Another Party Candidate"
- ^ "Another Third Party/Write-in" and West (B) with 1%
- ^ Overlapping sample with the previous Morning Consult poll, but more information available regarding third party and undecided voters
- ^ a b c "Neither" with 2%; "refused" with 1%
- ^ "Other" with 3%; would not vote with 1%
- ^ West (B) with 2%; "Another Third Party/Write-In" 1%
- ^ "Other candidate" with 2%
- ^ "Other party candidate" with 8%
- ^ "Other" with 2%
- ^ "Another candidate" with 3%; would not vote with 2%
- ^ "Libertarian Party candidate/Green Party candidate" with 5%
- ^ "Other" with 4%; would not vote with 2%
- ^ "Third party/write-in" with 3%
- ^ a b c "Neither" with 3%; "Refused" with 1%
- ^ "Other" with 5%; would not vote with 1%
- ^ "Neither" with 4%; "Refused" with 0%
- ^ "Someone else" with 1%; would not vote with 3%
- ^ "Other" with 6%; would not vote with 2%
- ^ "Neither" with 1%; "refused" with 1%
- ^ A third party candidate with 6%; would not vote with 2%
- ^ "Neither" with 4%; "refused" with 1%
- ^ "Neither" with 3%; "refused" with 0%
- Partisan clients
- ^ Poll sponsored by Tommy Tuberville's campaign.
- ^ The Consumer Energy Alliance is a pro-Keystone XL lobbying group
- ^ Poll sponsored by Doug Jones' campaign
- ^ Poll sponsored by Protect Our Care, a pro-Affordable Care Act organisation
- ^ The Independent Alaska PAC supported Al Gross's campaign for the US Senate race in Alaska prior to this poll's sampling period
- ^ a b c d e f g h AFSCME endorsed Biden prior to this poll's sampling period
- ^ The Justice Collaborative Project is an affiliate of the Tides Centre, a liberal fiscal sponsorship provider
- ^ a b c d e f g h i j k l m n o p q r s t u v w x y The Center for American Greatness is a pro-Trump organization
- ^ This poll's sponsor exclusively supports Democratic candidates
- ^ a b c d e f g h i j The American Action Forum is a 501 organisation which usually supports Republican candidates
- ^ Smart and Safe Arizona endorsed Proposition 207 prior to this poll's sampling period
- ^ Poll sponsored by the Defend Students Action Fund.
- ^ The Human Rights Campaign endorsed Biden prior to this poll's sampling period
- ^ Heritage Action is the sister organisation of the Heritage Foundation, which exclusively endorses Republican candidates
- ^ This poll's sponsor is the American Principles Project, a 501(c)(4) organization that supports the Republican Party.
- ^ Poll sponsored by the McSally campaign
- ^ Poll sponsored by a pro-Affordable Care Act organisation
- ^ Compete Everywhere primarily supports Democratic candidates
- ^ Climate Power 2020 was created by the League of Conservation Voters, which endorsed Biden prior to the sampling period
- ^ Poll sponsored by the Defend Students Action Fund.
- ^ The Human Rights Campaign endorsed Biden prior to this poll's sampling period
- ^ The Consumer Energy Alliance is a pro-Keystone XL lobbying group
- ^ Heritage Action is the sister organisation of the Heritage Foundation, which exclusively endorses Republican candidates
- ^ Poll sponsored by the Florida Chamber of Commerce PAC
- ^ a b Poll sponsored by Ossoff's campaign
- ^ The Human Rights Campaign endorsed Biden prior to this poll's sampling period
- ^ Poll sponsored by Democrat Raphael Warnock's campaign for U.S. Senate
- ^ Matt Lieberman is a Democratic candidate in Georgia's 2020 special Senate election
- ^ Fair Fight Action is the non-profit arm of Fair Fight, founded by Stacey Abrams who endorsed Biden prior to this poll's sampling period
- ^ This poll's sponsor, DFER, primarily supports Democratic candidates
- ^ This poll's sponsor is the American Principles Project, a 501(c)(4) organization that supports the Republican Party.
- ^ This poll is sponsored by End Citizens United, a PAC which has endorsed Democratic candidates who are against the landmark Citizens United court ruling
- ^ This poll was sponsored by a Republican-supporting organisation
- ^ Poll conducted for the Speaker of Georgia's House Republican caucus
- ^ Poll sponsored by Doug Collins' campaign
- ^ This poll is sponsored by Karen Tallian's campaign (D)
- ^ The Human Rights Campaign endorsed Biden prior to this poll's sampling period
- ^ This poll's sponsor is the American Principles Project, a 501(c)(4) organization that supports the Republican Party.
- ^ Emily's List is an organisation that supports Democratic female candidates
- ^ Protect Our Care is a pro-Affordable Care Act organisation
- ^ a b Keep Kansas Great PAC endorsed Marshall prior to this poll's sampling period
- ^ Poll for EMILY's List, a Democratic PAC which seeks to elect pro-choice Democratic women to office
- ^ This poll's sponsor supported the electoral defeat of Mitch McConnell prior to the sampling period
- ^ This poll's sponsor is the American Principles Project, a 501(c)(4) organization that supports the Republican Party.
- ^ a b c Poll sponsored by Amy McGrath's campaign
- ^ U.S. Term Limits is a PAC supporting candidates who support term limits in Congress.
- ^ This poll's sponsor supported the electoral defeat of Mitch McConnell prior to the sampling period
- ^ a b c d e f Progress Michigan is a non-profit that primarily supports Democratic candidates
- ^ The American Bridge PAC exclusively supports Democratic candidates
- ^ a b c d e f g h i j k l m n o p The Restoration PAC is a 501 non-profit which supports Donald Trump's 2020 presidential campaign
- ^ a b c d e f g h i j k l Rust Belt Rising is affiliated with the Democratic Party
- ^ The Committee to Protect Medicare is a PAC with a history of buying ads arguing against the reelection of Trump
- ^ The Human Rights Campaign endorsed Biden prior to this poll's sampling period
- ^ Unite the Country PAC has endorsed Biden's presidential campaign
- ^ This poll's sponsor is the American Principles Project, a 501(c)(4) organization that supports the Republican Party.
- ^ Poll sponsored by Giffords, whose head - Gabby Giffords - had endorsed Biden prior to the sampling period
- ^ Protect Our Care is a pro-Affordable Care Act organisation
- ^ Poll sponsored by Progress Michigan, the Michigan branch of Progress Now, a progressive advocacy organisation
- ^ Poll sponsored by Protect Our Care, a pro-Affordable Care Act organisation
- ^ CAP Action is a political advocacy group that exclusively supports Democratic candidates
- ^ a b Poll sponsored by Lewis' campaign
- ^ Poll sponsored by Giffords, whose founder, Gabby Giffords, had endorsed Biden prior to the sampling period
- ^ The Consumer Energy Alliance is a pro-Keystone XL lobbying group
- ^ Poll sponsored by Espy's campaign
- ^ a b Poll sponsored by Galloway's campaign for governor
- ^ Uniting Missouri is a PAC supporting Governor Mike Parson (R) in the 2020 Missouri gubernatorial election.
- ^ Protect Our Care is a pro-Affordable Care Act organisation
- ^ The House Majority PAC exclusively supports Democratic candidates
- ^ This poll's sponsor is the American Principles Project, a 501(c)(4) organization that supports the Republican Party.
- ^ Poll sponsored by Bolz's campaign
- ^ The Congressional Progressive Caucus PAC exclusively supports Democratic candidates
- ^ a b Poll sponsored by the House Majority PAC which exclusively endorses Democratic candidates
- ^ Poll sponsored by Eastman's campaign
- ^ Poll sponsored by the DCCC
- ^ Sponsored by an anonymous partisan group but not the Biden campaign
- ^ Sponsored by an anonymous partisan group
- ^ Poll sponsored by Ben Ray Luján's campaign for the 2020 United States Senate election in New Mexico
- ^ This poll was sponsored by the Majority Institute, a communications firm which supports the Democratic Party
- ^ Compete Everywhere primarily supports Democratic candidates
- ^ Poll sponsored by Protect Our Care, a pro-Affordable Care Act organisation
- ^ Piedmont Rising is a pro-Affordable Care Act organisation
- ^ The Human Rights Campaign endorsed Biden prior to this poll's sampling period
- ^ The founder of this poll's sponsor had endorsed Biden prior to the sampling period
- ^ This poll’s sponsor, DFER, primarily supports Democratic candidates
- ^ This poll's sponsor is the American Principles Project, a 501(c)(4) organization that supports the Republican Party.
- ^ Poll sponsored by Protect Our Care, a pro-Affordable Care Act organisation
- ^ Poll sponsored by the North Carolina Republican Party
- ^ Poll sponsored by Burgum's campaign
- ^ The Human Rights Campaign endorsed Biden prior to this poll's sampling period
- ^ The Progressive Policy Institute endorsed Biden prior to this poll's sampling period
- ^ Progress Ohio exclusively supports Democratic candidates
- ^ Poll sponsored by Broyles' campaign
- ^ Compete Everywhere primarily supports Democratic candidates
- ^ Climate Power 2020 was created by the League of Conservation Voters, which endorsed Biden prior to the sampling period
- ^ The American Bridge PAC exclusively supports Democratic candidates
- ^ The Human Rights Campaign endorsed Biden prior to this poll's sampling period
- ^ CPEC campaigns exclusively for Democratic candidates
- ^ The Progressive Policy Institute endorsed Biden prior to this poll's sampling period
- ^ Unite the Country PAC endorsed Biden prior to this poll's sampling period
- ^ The League of Conservation Voters and the Sierra Club endorsed Biden prior to this poll's sampling period
- ^ Heritage Action is the sister organisation of the Heritage Foundation, which exclusively endorses Republican candidates
- ^ This poll's sponsor is the American Principles Project, a 501(c)(4) organization that supports the Republican Party.
- ^ Poll sponsored by Protect Our Care, a pro-Affordable Care Act organisation
- ^ The DSCC endorsed Jaime Harrison's campaign for the 2020 US Senate election in South Carolina before this poll's sampling period
- ^ This poll's sponsor, Lindsey Must Go, is a PAC opposing Lindsey Graham
- ^ This poll was sponsored by Harrison's campaign
- ^ Poll sponsored by the Texas arm of the party which nominated Biden prior to this poll's sampling period
- ^ The Blue Texas PAC exclusively supports Democratic candidates
- ^ The Human Rights Campaign endorsed Biden prior to this poll's sampling period
- ^ Poll sponsored by the Texas arm of the party which nominated Biden prior to this poll's sampling period
- ^ Poll sponsored by the Defend Students Action Fund.
- ^ Giffords' founder, Gabby Giffords, endorsed Biden prior to this poll's sampling period
- ^ The Consumer Energy Alliance is a pro-Keystone XL lobbying group
- ^ The Texas Democratic Party exclusively supports Democratic candidates
- ^ Poll sponsored by Chrysta Castañeda's campaign
- ^ Size of "extremely likely to vote" sample not yet released
- ^ This poll's sponsor is the American Principles Project, a 501(c)(4) organization that supports the Republican Party.
- ^ Poll sponsored by Progress Texas, an organisation promoting progressive policies
- ^ Poll sponsored by the Texas Democratic Party
- ^ By the time of this poll, Data for Progress, which has worked with both the Sanders and Warren campaigns, had endorsed Warren
- ^ Poll sponsored by Democracy Toolbox
- ^ a b Poll conducted by Daniel Gade's campaign
- ^ The Club for Growth is a PAC supporting the Donald Trump 2020 presidential campaign.
- ^ This poll’s sponsor, DFER, primarily supports Democratic candidates
- ^ The Human Rights Campaign endorsed Biden prior to this poll's sampling period
- ^ Heritage Action is the sister organisation of the Heritage Foundation, which exclusively endorses Republican candidates
- ^ This poll's sponsor is the American Principles Project, a 501(c)(4) organization that supports the Republican Party.
- ^ Poll sponsored by Protect Our Care, a pro-Affordable Care Act organisation
- ^ CAP Action is a political advocacy group that exclusively supports Democratic candidates