Bratunac
Bratunac
Братунац | |
|---|---|
Town and municipality | |
 Bratunac | |
 Location of Bratunac within Bosnia and Herzegovina | |
 | |
| Coordinates: 44°11′02″N 19°19′51″E / 44.18389°N 19.33083°E | |
| Country | Bosnia and Herzegovina |
| Entity | Republika Srpska |
| Government | |
| • Municipality president | Srđan Rankić (Ind.) |
| • Municipality | 293.49 km2 (113.32 sq mi) |
| Population (2013 census) | |
| • Town | 8,359 |
| • Municipality | 20,340 |
| • Municipality density | 69/km2 (180/sq mi) |
| Time zone | UTC+1 (CET) |
| • Summer (DST) | UTC+2 (CEST) |
| Area code | 56 |
| Website | opstinabratunac |
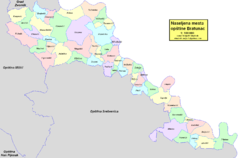
Bratunac (Serbian Cyrillic: Братунац) is a town and municipality located in easternmost part of Republika Srpska, an entity of Bosnia and Herzegovina. As of 2013 census, it has a population of 20,340 inhabitants, while the town of Bratunac has a population of 8,359 inhabitants.
History
Early history
In 1381, the name Bratunac is mentioned for the first time because of the direct road through Bratunac from Bosnia and Herzegovina to Serbia. At the time, Bratunac was composed of five houses and a population of roughly 30 people. In 1927, Bratunac became a municipality for the first time.
Settlements
Aside from the town of Bratunac, the municipality consists of the following settlements:
- Abdulići
- Banjevići
- Biljača
- Bjelovac
- Blječeva
- Boljevići
- Brana Bačići
- Dubravice
- Fakovići
- Glogova
- Hranča
- Hrnčići
- Jagodnja
- Jaketići
- Jelah
- Ježeštica
- Joševa
- Konjevići
- Krasanovići
- Kravica
- Krke
- Lipenovići
- Loznica
- Magašići
- Mihaljevići
- Moštanice
- Mlečva
- Mratinci
- Oćenovići
- Opravdići
- Osamsko
- Pirići
- Pobrđe
- Pobuđe
- Podčauš
- Polom
- Rakovac
- Repovac
- Sikirić
- Slapašnica
- Stanatovići
- Suha
- Šiljkovići
- Svilile
- Tegare
- Urkovići
- Vitkovići
- Voljavica
- Vraneševići
- Zagoni
- Zalužje
- Zapolje
- Žlijebac
Demographics


According to Columbia-Lippincott Gazetteer, in 1948 Bratunac had a population of 5,033.
Population
| Population of settlements – Bratunac municipality | ||||||||
|---|---|---|---|---|---|---|---|---|
| Settlement | 1948. | 1953. | 1961. | 1971. | 1981. | 1991. | 2013. | |
| Total | 5,234 | 9,647 | 23,149 | 26,513 | 30,333 | 33,375 | 20,340 | |
| 1 | Biljača | 655 | 211 | |||||
| 2 | Bjelovac | 290 | 201 | |||||
| 3 | Bratunac | 1,410 | 2,716 | 5,515 | 7,695 | 8,359 | ||
| 4 | Dubravice | 388 | 269 | |||||
| 5 | Glogova | 1,913 | 848 | |||||
| 6 | Hranča | 701 | 317 | |||||
| 7 | Hrnčići | 1,226 | 646 | |||||
| 8 | Ježeštica | 503 | 342 | |||||
| 9 | Konjevići | 998 | 615 | |||||
| 10 | Krasanovići | 532 | 284 | |||||
| 11 | Kravica | 363 | 558 | |||||
| 12 | Magašići | 646 | 486 | |||||
| 13 | Mihaljevići | 391 | 224 | |||||
| 14 | Opravdići | 441 | 247 | |||||
| 15 | Pobuđe | 2,359 | 993 | |||||
| 16 | Polom | 436 | 206 | |||||
| 17 | Rakovac | 537 | 423 | |||||
| 18 | Repovac | 504 | 351 | |||||
| 19 | Slapašnica | 542 | 286 | |||||
| 20 | Suha | 988 | 371 | |||||
| 21 | Urkovići | 1,095 | 460 | |||||
| 22 | Voljavica | 1,379 | 273 | |||||
| 23 | Zagoni | 588 | 305 | |||||
| 24 | Žlijebac | 380 | 240 | |||||
Ethnic composition
| Ethnic composition – Bratunac town | |||||||
|---|---|---|---|---|---|---|---|
| 2013. | 1991. | 1981. | 1971. | ||||
| Total | 8,359 (100,0%) | 7,695 (100,0%) | 5,515 (100,0%) | 2,716 (100,0%) | |||
| Bosniaks | 4,311 (56,02%) | 2,715 (49,23%) | 1,210 (44,55%) | ||||
| Serbs | 3 037 (39,47%) | 2,308 (41,85%) | 1,406 (51,77%) | ||||
| Yugoslavs | 159 (2,066%) | 312 (5,657%) | 1 (0,037%) | ||||
| Others | 156 (2,027%) | 26 (0,471%) | 32 (1,178%) | ||||
| Croats | 32 (0,416%) | 31 (0,562%) | 32 (1,178%) | ||||
| Roma | 87 (1,578%) | 9 (0,331%) | |||||
| Albanians | 18 (0,326%) | 11 (0,405%) | |||||
| Montenegrins | 15 (0,272%) | 12 (0,442%) | |||||
| Macedonians | 3 (0,054%) | 2 (0,074%) | |||||
| Hungarians | 1 (0,037%) | ||||||
| Ethnic composition – Bratunac municipality | |||||||
|---|---|---|---|---|---|---|---|
| 2013. | 1991. | 1981. | 1971. | ||||
| Total | 20,340 (100,0%) | 33,619 (100,0%) | 33,033 (100,0%) | 26,513 (100,0%) | |||
| Serbs | 12,350 (60,72%) | 11,475 (34,13%) | 12,055 (36,49%) | 12,820 (48,35%) | |||
| Bosniaks | 7,803 (38,36%) | 21,535 (64,06%) | 17,349 (52,52%) | 13,428 (50,65%) | |||
| Others | 154 (0,757%) | 346 (1,029%) | 2,766 (8,373%) | 118 (0,445%) | |||
| Croats | 33 (0,162%) | 40 (0,119%) | 41 (0,124%) | 50 (0,189%) | |||
| Yugoslavs | 223 (0,663%) | 645 (1,953%) | 15 (0,057%) | ||||
| Roma | 124 (0,375%) | 26 (0,098%) | |||||
| Montenegrins | 31 (0,094%) | 36 (0,136%) | |||||
| Albanians | 18 (0,054%) | 16 (0,060%) | |||||
| Macedonians | 4 (0,012%) | 3 (0,011%) | |||||
| Hungarians | 1 (0,004%) | ||||||
- Data by settlements
| Ethnic structure of population of Bratunac municipality, by settlements, 2013 census | |||||
|---|---|---|---|---|---|
| Settlement | total | Bosniaks | Croats | Serbs | others |
| Biljača | 306 | 301 | 0 | 5 | 0 |
| Bjelovac | 207 | 2 | 0 | 205 | 0 |
| Bratunac | 7,827 | 730 | 27 | 6,997 | 73 |
| Dubravice | 270 | 0 | 0 | 270 | 0 |
| Glogova | 920 | 914 | 0 | 6 | 0 |
| Hranča | 368 | 259 | 0 | 99 | 0 |
| Hrnčići | 780 | 0 | 0 | 0 | 0 |
| Ježeštica | 345 | 0 | 0 | 345 | 0 |
| Konjevići | 735 | 735 | 0 | 0 | 0 |
| Krasanovići | 287 | 156 | 0 | 130 | 1 |
| Kravica | 567 | 0 | 0 | 0 | 0 |
| Magašići | 527 | 236 | 2 | 289 | 0 |
| Mihaljevići | 233 | 231 | 0 | 2 | 0 |
| Opravdići | 275 | 23 | 0 | 252 | 0 |
| Pobuđe | 1,286 | 1,286 | 0 | 0 | 0 |
| Polom | 217 | 0 | 0 | 216 | 1 |
| Rakovac | 433 | 36 | 0 | 388 | 9 |
| Repovac | 352 | 13 | 3 | 336 | 0 |
| Slapašnica | 304 | 37 | 0 | 266 | 1 |
| Suha | 396 | 202 | 1 | 193 | 0 |
| Urkovići | 504 | 504 | 0 | 0 | 0 |
| Voljavica | 419 | 417 | 0 | 2 | 0 |
| Zagoni | 316 | 18 | 0 | 298 | 0 |
| Žlijebac | 272 | 0 | 0 | 272 | 0 |
Economy

The following table gives a preview of total number of registered people employed in legal entities per their core activity (as of 2018):[1]
| Activity | Total |
|---|---|
| Agriculture, forestry and fishing | 43 |
| Mining and quarrying | - |
| Manufacturing | 645 |
| Electricity, gas, steam and air conditioning supply | 57 |
| Water supply; sewerage, waste management and remediation activities | 50 |
| Construction | 94 |
| Wholesale and retail trade, repair of motor vehicles and motorcycles | 337 |
| Transportation and storage | 58 |
| Accommodation and food services | 118 |
| Information and communication | 11 |
| Financial and insurance activities | 25 |
| Real estate activities | 1 |
| Professional, scientific and technical activities | 30 |
| Administrative and support service activities | 6 |
| Public administration and defense; compulsory social security | 147 |
| Education | 266 |
| Human health and social work activities | 95 |
| Arts, entertainment and recreation | 11 |
| Other service activities | 56 |
| Total | 2,050 |
See also
References
- ^ "Cities and Municipalities of Republika Srpska" (PDF). rzs.rs.ba. Republika Srspka Institute of Statistics. 25 December 2019. Retrieved 31 December 2019.


