
Oglala Lakota County, South Dakota
Oglala Lakota County | |
|---|---|
 Location within the U.S. state of South Dakota | |
 South Dakota's location within the U.S. | |
| Coordinates: 43°20′N 102°33′W / 43.33°N 102.55°W | |
| Country | |
| State | |
| Founded | 1875 |
| Named for | Oglala Lakota |
| Seat | None (de jure) Hot Springs (de facto) |
| Largest community | Pine Ridge |
| Area | |
| • Total | 2,097 sq mi (5,430 km2) |
| • Land | 2,094 sq mi (5,420 km2) |
| • Water | 2.8 sq mi (7 km2) 0.1% |
| Population | |
| • Estimate (2016) | 14,415 |
| • Density | 6.9/sq mi (2.7/km2) |
| Time zone | UTC−7 (Mountain) |
| • Summer (DST) | UTC−6 (MDT) |
| Congressional district | At-large |
| Website | oglalalakota |
| Hot Springs in neighboring Fall River County serves as its administrative center | |
Oglala Lakota County, known as Shannon County until May 2015, is a county located in the U.S. state of South Dakota. The population was 13,586 at the 2010 census.[1] Oglala Lakota County does not have its own county seat. Instead, Hot Springs in neighboring Fall River County serves as its administrative center.[2] The county was created as a part of the Dakota Territory in 1875, although it remains unorganized.[3][4] Its largest community is Pine Ridge.
The county is entirely within the Pine Ridge Indian Reservation and contains part of Badlands National Park. It is one of five South Dakota counties entirely on an Indian reservation. (The others are Corson, Dewey, Todd, and Ziebach.)
The county is named after the Oglala Lakota, a band of the Lakota people. Many of the county's inhabitants are members of this sub-tribe.
The county's per-capita income makes it the poorest county in the United States.[5] It is the only dry county in South Dakota.
The newspaper for Oglala Lakota County is The Lakota Country Times.[6][7]
History
The place of the 1890 Wounded Knee Massacre is located in Oglala Lakota County.
The county was originally named for Peter C. Shannon, Chief Justice of the Dakota Territory Supreme Court. Until 1982, Shannon County and Washabaugh County, South Dakota, were the last unorganized counties in the United States. Although it was organized and received a home rule charter that year, the county, as noted above, contracts with Fall River County for its Auditor, Treasurer, and Registrar of Deeds.[8]
On November 4, 2014, voters in the county voted by a margin of 2,161 to 526 to rename Shannon County to Oglala Lakota County.[9] The name change was ratified by the state legislature on March 5, 2015.[10] May 1, 2015 was proclaimed by the governor as the official day for renaming the county.[11]
Geography
According to the U.S. Census Bureau, the county has a total area of 2,097 square miles (5,430 km2), of which 2,094 square miles (5,420 km2) is land and 2.8 square miles (7.3 km2) (0.1%) is water.[12]
The county includes the headwaters of the Little White River.
Major highways
Adjacent counties
- Pennington County, South Dakota - north
- Jackson County, South Dakota - northeast
- Bennett County, South Dakota - east
- Sheridan County, Nebraska - south
- Dawes County, Nebraska - southwest
- Fall River County, South Dakota - west
- Custer County, South Dakota - northwest
National protected area
- Badlands National Park (part)
Demographics
| Census | Pop. | Note | %± |
|---|---|---|---|
| 1920 | 2,003 | — | |
| 1930 | 4,058 | 102.6% | |
| 1940 | 5,366 | 32.2% | |
| 1950 | 5,669 | 5.6% | |
| 1960 | 6,000 | 5.8% | |
| 1970 | 8,198 | 36.6% | |
| 1980 | 11,323 | 38.1% | |
| 1990 | 9,902 | −12.5% | |
| 2000 | 12,466 | 25.9% | |
| 2010 | 13,586 | 9.0% | |
| 2016 (est.) | 14,415 | [13] | 6.1% |
| U.S. Decennial Census[14] 1790-1960[15] 1900-1990[16] 1990-2000[17] 2010-2016[1] | |||
As of the census[18] of 2000, there were 12,466 people, 2,785 households, and 2,353 families residing in the county. The population density was 6 people per square mile (2/km²). There were 3,123 housing units at an average density of 2 per square mile (1/km²). The racial makeup of the county was 4.51% White, 0.08% Black or African American, 94.20% Native American, 0.02% Asian, 0.05% Pacific Islander, 0.22% from other races, and 0.91% from two or more races. Hispanic or Latino of any race were 1.42% of the population.
There are 2,785 households out of which 51.70% had children under the age of 18 living with them, 35.40% were married couples living together, 36.40% had a female householder with no husband present, and 15.50% were non-families. 13.20% of all households were made up of individuals and 3.00% have someone living alone who was 65 years of age or older. The average household size was 4.36 and the average family size was 4.72.
In the county, the population was spread out with 45.30% under the age of 18, 10.60% from 18 to 24, 25.60% from 25 to 44, 13.80% from 45 to 64, and 4.80% who were 65 years of age or older. The median age was 21 years. For every 100 females there were 99.60 males. For every 100 females age 18 and over, there were 95.60 males.
The median income for a household in the county was $20,916, and the median income for a family was $20,897. Males had a median income of $25,170 versus $22,594 for females. The per capita income for the county was $6,286. About 45.10% of families and 52.30% of the population were below the poverty line, including 60.80% of those under age 18 and 36.00% of those age 65 or over.
Politics
| Year | Republican | Democratic | Third Parties |
|---|---|---|---|
| 2016 | 8.3% 241 | 86.4% 2,510 | 5.3% 154 |
| 2012 | 6.0% 188 | 93.4% 2,937 | 0.6% 20 |
| 2008 | 9.9% 331 | 88.7% 2,971 | 1.4% 48 |
| 2004 | 12.5% 526 | 84.6% 3,566 | 2.9% 122 |
| 2000 | 12.9% 252 | 85.4% 1,667 | 1.7% 34 |
| 1996 | 11.1% 253 | 84.3% 1,926 | 4.6% 105 |
| 1992 | 13.6% 225 | 76.7% 1,267 | 9.6% 159 |
| 1988 | 17.3% 256 | 81.5% 1,206 | 1.2% 17 |
| 1984 | 17.7% 324 | 81.4% 1,489 | 0.9% 16 |
| 1980 | 26.0% 438 | 67.1% 1,132 | 6.9% 117 |
| 1976 | 27.8% 301 | 69.9% 756 | 2.2% 24 |
| 1972 | 22.1% 356 | 77.3% 1,246 | 0.6% 9 |
| 1968 | 29.7% 533 | 66.9% 1,202 | 3.4% 61 |
| 1964 | 24.2% 557 | 75.8% 1,748 | |
| 1960 | 36.6% 655 | 63.4% 1,135 | |
| 1956 | 45.2% 782 | 54.8% 949 | |
| 1952 | 55.3% 957 | 44.7% 774 | |
| 1948 | 44.1% 641 | 55.2% 803 | 0.7% 10 |
| 1944 | 53.9% 562 | 46.1% 480 | |
| 1940 | 58.0% 1,094 | 42.0% 791 | |
| 1936 | 49.9% 667 | 47.5% 634 | 2.6% 35 |
| 1932 | 36.7% 463 | 63.2% 798 | 0.1% 1 |
| 1928 | 43.6% 469 | 55.9% 601 | 0.5% 5 |
| 1924 | 88.9% 992 | 6.8% 76 | 4.3% 48 |
The counties surrounding Oglala Lakota County are predominantly Republican, but, like most Native American counties, Oglala Lakota is heavily Democratic, giving over 75 percent of the vote to every Democratic presidential nominee in every election back to 1984, making it one of the most Democratic counties in the United States. No Republican has carried the county in a presidential election since 1952.
Communities
Town
Census-designated places
Unincorporated community
Townships
The county is divided into two areas of unorganized territory: East Shannon and West Shannon.
See also
References
- ^ a b "State & County QuickFacts". United States Census Bureau. Retrieved November 28, 2013.
- ^ "Find a County". National Association of Counties. Archived from the original on May 31, 2011. Retrieved 2011-06-07.
{{cite web}}: Unknown parameter|deadurl=ignored (|url-status=suggested) (help) - ^ "Dakota Territory, South Dakota, and North Dakota: Individual County Chronologies". Dakota Territory Atlas of Historical County Boundaries. The Newberry Library. 2006. Retrieved March 30, 2015.
- ^ "South Dakota Legislative Manual" (PDF). South Dakota Secretary of State. 2005. p. 597. Retrieved March 30, 2015.
- ^ United States counties by per capita income
- ^ "The Lakota Country Times". Lakota Country Times.
- ^ "Martin Lakota Country Times". South Dakota Newspaper Association. Retrieved April 10, 2016.
- ^ [1], accessed April 19, 2009.
- ^ David Montgomery, "Shannon County no more: Voters approve name change", Argus Leader, November 5, 2014.
- ^ Mercer, Bob (March 5, 2015). "It's official: Oglala Lakota County replaces Shannon County Name". Rapid City Journal. Retrieved March 14, 2015.
- ^ "Governor's Executive Proclamation". Office of the Governor.
- ^ "2010 Census Gazetteer Files". United States Census Bureau. August 22, 2012. Retrieved March 28, 2015.
- ^ "Population and Housing Unit Estimates". Retrieved June 9, 2017.
- ^ "U.S. Decennial Census". United States Census Bureau. Archived from the original on May 11, 2015. Retrieved March 28, 2015.
{{cite web}}: Unknown parameter|deadurl=ignored (|url-status=suggested) (help) - ^ "Historical Census Browser". University of Virginia Library. Retrieved March 28, 2015.
- ^ Forstall, Richard L., ed. (March 27, 1995). "Population of Counties by Decennial Census: 1900 to 1990". United States Census Bureau. Retrieved March 28, 2015.
- ^ "Census 2000 PHC-T-4. Ranking Tables for Counties: 1990 and 2000" (PDF). United States Census Bureau. April 2, 2001. Retrieved March 28, 2015.
- ^ "American FactFinder". United States Census Bureau. Archived from the original on September 11, 2013. Retrieved 2011-05-14.
{{cite web}}: Unknown parameter|deadurl=ignored (|url-status=suggested) (help) - ^ http://uselectionatlas.org/RESULTS
External links
Places adjacent to Oglala Lakota County, South Dakota | ||||||||||||||||
|---|---|---|---|---|---|---|---|---|---|---|---|---|---|---|---|---|
| ||||||||||||||||
Municipalities and communities of Oglala Lakota County, South Dakota, United States | ||
|---|---|---|
| Town | 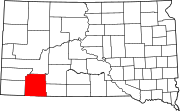 | |
| CDPs | ||
| Unincorporated communities | ||
| Indian reservation | ||
| Footnotes | ‡This populated place also has portions in an adjacent county or counties | |
43°20′N 102°33′W / 43.33°N 102.55°W
| International | |
|---|---|
| National | |
| Geographic | |
| Other | |