
List of largest empires
An empire involves the extension of a state's sovereignty over external territories. For example, first the Spanish Empire and then the British Empire were called "the empires on which the sun never sets", because of their territories and possessions around the globe. This article provides a list of the largest empires in world history.
There are various notions of size that can be applied; for each of these notions it is the case that for most historical empires only estimates can be given for the maximal value in time attained for that particular notion of size, and usually there is furthermore no clear consensus among historians regarding the best estimate – if only because there is often no unambiguous information about an empire's historical boundaries. Thus, the values given here should generally be interpreted as being only indicative, and not as determining a precise ranking.
Measurement
The calculation of the land area of a particular empire is controversial. In general, the list centers on the side of including any land area that was explored and explicitly claimed, even if the areas were populated very sparsely or not at all. For example, a large portion of Northern Siberia is included in the size of the Russian Empire but not the Mongol Empire. The Mongol Empire's northern border was somewhat ill-defined, but in most places it was simply the natural border between the steppe and the taiga. At the time the majority of the taiga and tundra were unexplored and uninhabited. This area was only very sparsely populated by the Russian Empire, but it had been explicitly claimed by the Russian Empire by the 17th century, and its extent had been entirely explored by the late 19th century. Similarly, the northernmost Canadian islands such as Ellesmere Island were explored and claimed by the British Empire by the mid-19th century (virtually the entire mainland was at least sparsely populated well before that).
The only claims on mainland Antarctica are included in the area of the British Empire.
Due to the historical trend of increasing population and GDP, the list of largest empires in these categories is highly dependent on which relatively recent political entities are defined as empires. The measures of population and GDP as a percentage of the world total take into account this historical growth, although decent GDP data is only available for the last few centuries, accurate only for the last decades.
Debates regarding definition of imperial domains
This article is written like a personal reflection, personal essay, or argumentative essay that states a Wikipedia editor's personal feelings or presents an original argument about a topic. (June 2011) |
Compilations of history’s largest empires (in both geographical size and population) often vary due to differing definitions of imperial borders throughout history and across distinct historical traditions. Imperial domains have been variously defined in terms of direct administrative rule from a common ruling authority, military presence, colonization and settlement, collection of tribute, economic dependence, or even incorporation into a common trading or ideological network. Many imperial domains have therefore enjoyed varying degrees of autonomy, self-rule, or even outright independence (though sometimes with a dependent or protectorate relationship to a stronger power). Some regions claimed by an imperial authority have been large, yet arid and very sparsely populated lands without much administrative control whatsoever. Therefore, empires can vary in size according to these designations, often quite significantly.
For example in India, which experienced varying levels of European contact and imperial forays since Vasco da Gama’s expeditions in 1497-1498, French, Dutch, Portuguese and especially British authorities claimed authority over increasing portions of the Indian Subcontinent. This process culminated in the period of the British Raj (and its smaller French and Portuguese counterparts) after 1857. Nevertheless, even then approximately half of Indian territory consisted of Princely States under de facto and de jure rule of local rajas and maharajas. While the Indian princes often sought protection and mediation from the European maritime powers, they minted their own coins, issued their own edicts, and otherwise ruled of their own accord; furthermore, the Indian independence Act, which ended the British presence by 1948, did not apply to the Princely States, which required separate negotiations with the new Indian nation as independent states in themselves. Thus, although many European maps showed nearly the whole of India as a predominantly British colony in the late 19th century, close to 50% was functionally independent.
Another issue is that many of history’s empires have ruled over vast and mostly uninhabited territorial expanses, sparsely populated by largely autonomous tribes, and with little in the way of direct administration or settlement by an imperial power. For example, various Mongol khanates from the 13th century established dominion over arid steppes in Central Asia and Siberia that were difficult to control from a central authority, as was the case with the expansionist Tsardom of Russia empires from the 17th century, which established control in the same regions. In both cases, administrative structures and settlements were gradually introduced into the regions—with Russian settlers, for example, initiating forts and frontier cities in the 19th century in particular—and so the size of each empire in any given decade would depend on how strict one’s criteria are in regard to the presence of true settlement and administration. Likewise, in more recent history, almost half the land expanse that is often regarded as part of the British Empire (and also much of the historical French Empire in North America), consisted of essentially barren and uninhabitable terrain in Canada and the interior of Australia, which was often difficult to even map, let alone settle and administer. Even today, the population of those regions (particularly in Nunavut and the Northwest Territories of Canada) consists largely of sparse settlements of self-governing indigenous peoples, with little in the way of submission to a central ruling authority.
During the Muslim conquests of the 7th and early 8th centuries, Rashidun armies established the Caliphate, or Islamic Empire, one of the largest empires ever. The 7th century saw the introduction of Islam in the Arabian Peninsula, where The Prophet Muhammad established a new unified political polity in the Arabian peninsula which under the subsequent Rashidun and Umayyad Caliphates saw a century of rapid expansion of Arab power well beyond the Arabian peninsula in the form of a vast Muslim Arab Empire with an area of influence that stretched from northwest India, across Central Asia, the Middle East, North Africa, southern Italy, and the Iberian Peninsula, to the Pyrenees. However, internal feuding among ruling figures in the empire led it to fragment into several states under separate administrations, such as the Umayyads (whose rule continued in Spain after it collapsed elsewhere), Abbasids, Ayyubids, Mamluks and many others. These were in addition to a variety of other Muslim states in Sudan, Indonesia and elsewhere that later arose outside of the main Islamic Empires, through trade and other contacts. Thus, the size of these empires vary depending on how “membership” in the empire is defined—as being under a single administration, accepting a particular ruler or following the dictates of the Caliph (which technically, Sunni Muslims in general were expected to do).
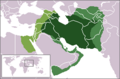
Similarly, the Mongol Empire lost its unity upon the death of the Great Khan Möngke during fighting in China in 1259, with the Golden Horde’s Berke Khan and the Il-Khanate’s Hulegu Khan even taking up arms against each other and supporting rival factions for selection of the Great Khan. However, upon the death of Berke—a Muslim—the religious impetus for conflict among the khanates subsided, with the Mongols again supposedly loyal to the new Great Khan Kublai before fragmenting yet again later. If the khanates are considered to have been a unified Mongol Empire under Kublai—stretching from Korea and China in the east through Siberia and Central Asia and into Persia and Eastern Europe in the west—it would easily be the world’s largest in terms of both land area and population (as a percentage of the world total). A related question arises with the granting of dominion and commonwealth statuses among former imperial domains, in which the domains acquire a high degree of self-rule, equivalent to independence in some estimations. For example, Australia attained dominion status in 1901 which may or may not have indicated a departure from the British Empire, depending on interpretation of the status.
Finally, many of history’s empires have had unusual arrangements among multiple powers, such as joint rule by several authorities, layers of rule (with different powers assuming different levels of administrative authority), territorial division with blurred boundaries or other forms of empire without a single obvious central authority. For example, the Manchus, who established the Qing Dynasty in 17th-century China, also conquered nomadic lands to the north, including Mongolia. The Manchus increasingly merged with the Chinese population over the centuries, so that the administration took on both Manchu and Chinese features with no clear division among them. The Mongol chieftains of Outer Mongolia in particular, pledged loyalty to the Manchus but retained substantial autonomy, and when the Qing Dynasty collapsed in the early 20th century, the status of Outer Mongolia relative to the new Chinese state became unclear. Britain had a very complicated arrangement with Egypt and Sudan. Egyptian forces battled the British in the Alexandria Expedition in 1807, but in the wake of this, British officials exerted varying degrees of sway in Egypt especially by the late 19th century, with the French also assuming a role in the Suez Canal territory. Sudan, in turn, was technically a colony of the Egyptians, but the British exerted de facto sway on Sudan indirectly via Egypt. Thus, accounts vary on the imperial status (or lack thereof) of both Egypt and Sudan. Lastly, in the wake of the Bolshevik Revolution, many nations took on a Communist character and attached themselves to the global Communist center of the Soviet Union. Mongolia, North Korea, and China following Communist victory in the Chinese civil war, all took guidance from the Soviet Union especially in the years just after their Communist transformations. The Soviet Union also exercised varying control over Eastern Europe via the Warsaw Pact even though the Pact countries were formally independent, while Communist nations in Africa and Latin America also sought Soviet guidance. Therefore, the lists of largest empires below represent merely a sample of possible rankings depending on the specific criteria used to define an empire.
European colonial empires
The first global empires were a product of the European Age of Exploration that began with a race of exploration between the then most advanced maritime powers, Portugal and Spain, in the 15th century. The initial impulse behind these maritime empires and those that followed was trade, driven by the new ideas and the capitalism that grew out of the European Renaissance. Agreements were also reached to divide the world up between them in 1479, 1493, and 1494.
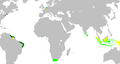
Portugal began establishing the first global trade network and empire under the leadership of Henry the Navigator. Portugal would eventually establish colonial domains from Brazil, in South America, to several colonies in Africa (namely Portuguese Guinea, Cape Verde, São Tomé and Príncipe, Angola and Mozambique), in Portuguese India (most importantly Bombay and Goa), in China (Macau), and Oceania (most importantly Timor, namely East Timor), amongst many other smaller or short-lived possessions (see Evolution of the Portuguese Empire).
During its peak, the Spanish Empire had possession of the Netherlands, Luxembourg, Belgium, most of Italy, parts of Germany, parts of France, and many colonies in the Americas, Africa, Asia and Oceania. With the conquest of inland Mexico, Peru, and the Philippines in the 16th century, Spain established overseas dominions on a scale and world distribution that had never been approached by its predecessors (the Mongol Empire had been larger but was restricted to Eurasia). Possessions in Europe, Africa, the Atlantic Ocean, the Americas, the Pacific Ocean, and the Far East qualified the Spanish Empire as attaining a global presence in this sense.
From 1580 to 1640 the Portuguese Empire and the Spanish Empire were conjoined in a personal union of its Habsburg monarchs, during the period of the Iberian Union, though the empires continued to be administered separately.
Subsequent global empires included the French, Dutch, and British empires. The latter, consolidated during the period of British maritime hegemony in the 19th century, became the largest of all empires by virtue of the improved transportation technologies of the time. At its height, the British Empire covered a quarter of the Earth's land area and comprised a quarter of its population. Germany and Italy were unified later than the other major European countries and so they joined other European powers in establishing colonies overseas only during the "Scramble for Africa" in the 19th century. By the 1860s, the Russian Empire — continued as the Soviet Union — became the largest contiguous state in the world. Russia continues this distinction, despite having "lost" its Soviet periphery (Russia today includes slightly over half the world's longitudes).
-
 Anachronous map of the Portuguese Empire
 -
 Anachronous map of the overseas Spanish Empire
 -
 Anachronous map of the Dutch Empire
 -
 Map of the British Empire in 1919
 -
 Anachronous map of the French Empire
 -
 Map of the German Empire in 1914
 -
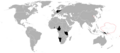
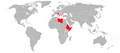 Map of the Italian Colonial Empire in 1939
 -
A map of the Russian Empire


.png)


Largest empires by land area and population
For context, note that the total land area of the Earth is 148,940,000 km2 (57,500,000 sq mi).[1]
All empires at their greatest extent
| Empire | Max Land area (million km2) | Max Land area (million mi2) | % of world land area | Era | Max Population (million) | % of world population |
|---|---|---|---|---|---|---|
| British Empire | 33.7 | 13.01 | 22.63% | 1922[2] | 458.0 (in 1938)[3] | 20.00% (458 million out of 2.295 billion in 1938)[3] |
| Mongol Empire | 24.0[4] | 09.27 | 16.11% | 1270 or 1309[5] | 110.0 (in the 13th century)[6] | 25.60% (110.0 million out of 429 million[7] in the 13th century) |
| Russian Empire | 22.8 | 08.80 | 15.31% | 1895[4][8] | 176.4 in 1913 | 09.80% (176.4 million out of 1.791 billion[9] in 1913) |
| Spanish Empire | 20.0 | 07.72 | 13.43% | 1740-1790 approx[10] | 68.2[11] | 12.30% (68.2 million out of 556 million[9] in the 17th century) |
| Qing Dynasty, China | 14.7 | 05.68 | 09.87% | 1790[4][8] | 432.2 in 1851.[12] | 36.60% (381.0 million out of 1.041 billion in 1820)[9] |
| Yuan Dynasty, China | 14.0 | 05.41 | 09.40% | 1310[8] | 59.8 in 1291.[13][14] | 17.10% (59.8 million out of 350 million in 1290) |
| Umayyad Caliphate | 13.0 | 05.02 | 08.73% | 720 or 750[15] | 62.0 (in the 8th century)[16] | 29.50% (62.0 million out of 210 million[17] in the 7th century AD) |
| Second French Colonial Empire | 13.0 | 05.02 | 08.73% | 1938[10] | 112.9 in 1938 | 05.10% (112.9 million out of 2.295 billion in 1938) |
| Abbasid Caliphate | 11.1 | 04.29 | 07.45% | 750[8] | 50.0 (in 850) | 20.00% (50.0 million out of 250 million in 850)[9] |
| Portuguese Empire | 10.4 | 04.02 | 06.98% | 1815[10] | — | — |
| Rashidun Caliphate | 09.0 | 03.48 | 06.04% | 654[8][18] | — | 19.10% (40.3 million out of 210 million in 7th century) |
| Achaemenid Empire | 08.75 | 03.42 | 05.85% | BC 480[19] | 50.0 (in 480 BC)[20] | 44.5% (50.0 million out of 112.4 million[21] in 480 BC)[22] |
| Empire of Brazil | 08.5 | 03.28 | 05.71% | 1880, similar to the Federative Republic of Brazil of today[10] | — | — |
| First French Colonial Empire | 08.1 | 03.13 | 05.44% | 1754[23] | 50.0 | 09.00% |
| Japanese Empire | 07.4 | 02.86 | 04.97% | 1942[10] | 134.8 in 1938 | 05.90% (134.8 million out of 2.295 billion[9] in 1938) |
| Ming Dynasty, China | 06.5 | 02.51 | 04.36% | 1450[4][8] | 110.0 in 1600.[24][25] | 28.80% (160.0 million out of 556.2 million in 1600)[9] |
| Han Dynasty, China | 06.5 | 02.51 | 04.36% | 100[26] | 74.0 in 2[13][27] | 26.00% (59.6 million out of 230 million[9] in 2 AD) |
| Roman Empire | 06.5 | 02.51 | 04.36% | 117[28] | 65.0 to 88.0 (in 2nd century AD)[29][30][31] | 29.20% to 39.50% (out of 223 million[29] in the 2nd century AD) |
| Nazi Germany | 06.4 | 02.47 | 04.30% | 1942 | 75.4 million out of 2.295 billion in 1938 | — |
| Göktürk Khaganate | 06.0 | 02.32 | 04.03% | 557[4][26] | — | — |
| Golden Horde Khanate | 06.0 | 02.32 | 04.03% | 1310[4][8] | — | |
| Sassanid Empire | 03.5 | 01.35 | 02.35% | 550[4] | 25.0 (in the 7th century AD) | 12.00% (25.0 million out of 210 million[17] in the 7th century AD) |
| Uyghur Khaganate | 03.1 | 01.20 | 02.08% | 800[4][8] | — | — |
| Macedonian Empire | 05.2 | 02.01 | 03.49% | BC 323[4][32] | — | — |
| Ottoman Empire | 05.2 | 02.01 | 03.49% | 1683[4][8] | 39.0 (in the 17th century) | 07.10% (39.0 million out of 556 million[9] in the 17th century) |
| Fatimid Caliphate | 04.1 | 01.58 | 02.75% | 969[4][8] | — | — |
| Mauryan Empire, India | 05.0 | 01.93 | 03.36% | BC 250[4] | 50.0 in the 2nd century BC | 33.30% (50.0 million out of 150 million in the 2nd century BC[33]) |
| Northern Yuan Dynasty, Mongolia | 05.0 | 01.93 | 03.36% | 1550[8] | — | — |
| First Mexican Empire | 04.9 | 01.89 | 03.29% | 1822[citation needed] | — | — |
| Xin Dynasty, China | 04.7 | 01.82 | 03.16% | 10[26] | — | — |
| Tibetan Empire | 04.6 | 01.78 | 03.09% | 800[4][8] | — | — |
| Timurid Empire | 04.4 | 01.70 | 02.95% | 1405[4][8] | — | — |
| Mughal Empire, India | 04.0 | 01.54 | 02.69% | 1690[4][8] | 175.0 in 1700 | 29.20% (175.0 million out of 600 million[34] in 1700) |
| Xiongnu Empire | 04.03 | 01.56 | 02.71% | BC 176[35] | — | — |
| Pala Empire | 04.0 | 01.54 | 02.69% | 850 | — | 24.00% (60.0 million out of 250 million in 850)[9] |
| Hunnic Empire | 04.0 | 01.54 | 02.69% | 441[26] | — | — |
| Hephtalite Empire | 04.0 | 01.54 | 02.69% | 490[26] | — | — |
| Eastern Turks Khanate | 04.0 | 01.54 | 02.69% | 624[26] | — | — |
| Afsharid Dynasty, Persia | 04.0 | 01.54 | 02.69% | 1747[citation needed] | — | — |
| Western Turks Khanate | 04.0 | 01.54 | 02.69% | 630[26] | — | — |
| Rouran Khaganate Juan-juan | 04.0 | 01.54 | 02.69% | 405[4][26] | — | — |
| Karkota Dynasty, Kashmir, India | 04.0 | 01.54 | 02.69% | 750[4][8] | — | — |
| Great Seljuq Empire | 03.9 | 01.51 | 02.62% | 1080[4][8] | — | — |
| Italian Empire | 03.8 | 01.47 | 02.55% | 1940[citation needed] | 51.9 in 1938 | 02.30% (51.9 million out of 2.295 billion in 1938) |
| Kushan Empire | 03.8 | 01.47 | 02.55% | 200[26] | — | 19.00% (42.37 million out of 223 million in 140)[9] |
| Ilkhanate | 03.75 | 01.45 | 02.52% | 1310[4][8] | — | — |
| Dutch Empire | 03.7 | 01.43 | 02.48% | 1940[citation needed] | 60.0 in 1940. | 03.50% (60.0 million out of 1.700 billion in 1907) |
| Chola Dynasty, India | 03.6 | 01.39 | 02.42% | 1050[36][37] | — | — |
| Khwarazmian Empire | 03.6 | 01.39 | 02.42% | 1218[8] | — | — |
| Gupta Empire | 03.5 | 01.35 | 02.35% | 400[4] | — | 26.36% (58.0 million out of 220 million in 400 AD)[3] |
| Chagatai Khanate | 03.5 | 01.35 | 02.35% | 1310 or 1350[4][8] | — | — |
| Safavid Dynasty, Persia | 03.5 | 01.35 | 02.35% | 1512[citation needed] | — | — |
| German Colonial Empire | 03.5 | 01.35 | 02.35% | 1914[citation needed] | 64.9 in 1914 | 03.70% (64.9 million out of 1.753 billion in 1910) |
| Western Jin Dynasty, China | 03.5 | 01.35 | 02.35% | 300[26] | 48.0 in 1195.[13][38] | — |
| Shaybanid Uzbek Dynasty | 03.5 | 01.35 | 02.35% | 1510[8] | — | — |
| Byzantine Empire | 03.5 | 01.35 | 02.35% | 555[26] | — | — |
| Northern Song Dynasty, China | 03.5 | 01.35 | 02.35% | 1100[4][8] | 123.0 in 1103[13][39] | 22.00% (59.0 million out of 268 million in 1000)[9] |
| Ghaznavid Empire | 03.4 | 01.31 | 02.28% | 1029[4][8] | — | — |
| Almoravid Caliphate | 03.3 | 01.27 | 02.22% | 1147[8] | — | — |
| Tughlaq Dynasty, India | 03.2 | 01.24 | 02.15% | 1320[8] | — | 18.91% (70.0 million out of 370 million in 1330)[9] |
| Ghurids Sultanate, Persia | 03.2 | 01.24 | 02.15% | 1200[8] | — | |
| Parthian Empire | 03.1 | 01.08 | 01.88% | 1[4][32] | — | |
| Median Empire | 03.1 | 01.08 | 01.88% | BC 585[4][32] | — | |
| Sui Dynasty, China | 03.1 | 01.20 | 02.08% | 610[8] | 53.0 in 606[13][40] | — |
| Seleucid Empire | 03.0 | 01.51 | 02.62% | BC 301[4][32] | — | — |
| Khazar Khanate | 03.0 | 01.16 | 02.01% | 850[4] | — | — |
| Kalmar Union | 03.0 | 01.16 | 02.01% | 1397[citation needed] | — | — |
| Kievan Rus' | 02.1 | 00.81 | 01.41% | 1000[4][8] | — | — |
| Kara-Khanid Khanate | 03.0 | 01.16 | 02.01% | 1025[8] | — | — |
| Qajar Dynasty, Persia | 03.0 | 01.16 | 02.01% | 1796[citation needed] | — | — |
| Danish Colonial Empire | 03.0 | 01.16 | 02.01% | 1800[citation needed] | — | — |
| Grand Duchy of Moscow | 03.0 | 01.16 | 02.01% | 1505[citation needed] | — | — |
| Samanid Dynasty, Persia | 02.85 | 01.10 | 01.91% | 928[4][8] | — | — |
| Qin Dynasty, China | 02.8 | 01.08 | 01.88% | BC 206[26] | — | — |
| Eastern Jin Dynasty, China | 02.8 | 01.08 | 01.88% | 347[26] | — | — |
| Liu Song Dynasty, China | 02.8 | 01.08 | 01.88% | 420[26] | — | — |
| Khilji Dynasty, India | 02.7 | 01.04 | 01.81% | 1312 or 1320[4][8] | — | — |
| Ayyubid Caliphate | 02.0 | 01.04 | 00.77% | 1190[4] | — | — |
| Majapahit Empire | 02.7 | 01.04 | 01.81% | 1389[26] | — | — |
| Liao Dynasty, China | 02.6 | 01.00 | 01.75% | 947[4][8] | — | — |
| Indo-Greek Yavana Kingdom | 02.5 | 00.97 | 01.68% | BC 150[26] | — | — |
| Bactrian Empire | 02.5 | 00.97 | 01.68% | BC 184[26] | — | — |
| Later Zhao Dynasty, China | 02.5 | 00.97 | 01.68% | 329[26] | — | — |
| Maratha Empire | 02.5 | 00.97 | 01.68% | 1760[4] | — | — |
| Belgian Empire | 02.5 | 00.97 | 01.68% | 1914[citation needed] | — | — |
| Kara-Khitan Khanate Western Liao | 02.5 | 00.97 | 01.68% | 1210[4] | — | — |
| Jurchen Jīn Dynasty, China | 02.3 | 00.89 | 01.54% | 1126[4][8] | — | — |
| Southern Qi Dynasty, China | 02.3 | 00.89 | 01.54% | 502[26] | — | — |
| Southern Song Dynasty, China | 02.1 | 00.81 | 01.41% | 1127[8] | 73.0 in 1193.[13][41] | — |
| Bahriyya Mamluks, Egypt | 02.1 | 00.81 | 01.41% | 1300[8] | — | — |
| Burjiyya Mamluks, Egypt | 02.1 | 00.81 | 01.41% | 1400[4] | — | — |
| First French Empire | 02.1 | 00.81 | 01.41% | 1813[8] | — | — |
| Wei Dynasty, China | 02.0 | 00.77 | 01.34% | 263[26] | — | — |
| Earlier Zhao Dynasty, China | 02.0 | 00.77 | 01.34% | 316[26] | 64 in 156[13][42] | — |
| Former Qin Dynasty, China | 02.0 | 00.77 | 01.34% | 376[26] | — | — |
| Western Roman Empire | 02.0 | 00.77 | 01.34% | 395[26] | — | — |
| Northern Wei Dynasty, China | 02.0 | 00.77 | 01.34% | 450[26] | — | — |
| Saffarid Dynasty, Persia | 02.0 | 00.77 | 01.34% | 900[citation needed] | — | — |
| Almohad Caliphate | 02.0 | 00.77 | 01.34% | 1200[4] | — | — |
| Satavahana Empire | 02.0 | 00.77 | 01.34% | 90 AD[26] | — | — |
| Inca Empire | 02.0 | 00.77 | 01.34% | 1527[4][8] | — | — |
| Second Mexican Empire | 02.0 | 00.77 | 01.34% | 1864, similar to the United Mexican States of today[43] | — | — |
| Gurjara Pratihara Dynasty, India | 01.8 | 00.69 | 01.21% | 860[8] | — | — |
| Sibir Khanate | 01.8 | 00.69 | 01.21% | 1520[8] | — | — |
| Rashtrakuta Dynasty, India | 01.7 | 00.66 | 01.41% | 805[citation needed] | — | — |
| Buyid Sultanate, Persia | 01.6 | 00.62 | 01.07% | 980[4][8] | — | — |
| Mamluk Sultanate, India | 01.6 | 00.62 | 01.07% | 1228[8] | — | — |
| Indo-Parthian Kingdom | 01.5 | 00.58 | 01.01% | 50[26] | — | — |
| Wu Dynasty, China | 01.5 | 00.58 | 01.01% | 221[26] | — | — |
| Northern Zhou Dynasty, China | 01.5 | 00.58 | 01.01% | 577[26] | — | — |
| Nanda Dynasty, India | 01.5 | 00.58 | 01.01% | BC 350 or 321[26][44] | — | — |
| Indo-Scythian Kingdom | 01.5 | 00.58 | 01.01% | BC 100[32] | — | — |
| Tulunids Emirate | 01.5 | 00.58 | 01.01% | 900[26] | — | — |
| Idrisid Dynasty, Morocco | 01.5 | 00.58 | 01.01% | 828[4] | — | — |
| Suri Dynasty, India | 01.5 | 00.58 | 01.01% | 1545 AD[4][8] | — | — |
| Neo-Assyrian Empire | 01.4 | 00.54 | 00.940% | BC 670[4][32] | — | — |
| Songhai Empire | 01.4 | 00.54 | 00.940% | 1500[45] | — | — |
| Empire of Harsha | 01.35 | 00.52 | 00.906% | 625 or 648[4][8] | — | — |
| Liang Dynasty, China | 01.3 | 00.50 | 00.873% | 502 or 549[4][26] | — | — |
| Western Wei Dynasty, China | 01.3 | 00.50 | 00.873% | 557[26] | — | — |
| Later Liang Dynasty, China | 01.3 | 00.50 | 00.873% | 923[8] | — | — |
| Later Tang Dynasty, China | 01.3 | 00.50 | 00.873% | 923[8] | — | — |
| Mali Empire | 01.29 | 00.50 | 00.866% | 1312[46] | — | 10.00% (45.0 million out of 450 million[47] in the mid-15th century) |
| Shang Dynasty, China | 01.25 | 00.48 | 00.839% | BC 1122[4][32] | — | — |
| Western Zhou Dynasty, China | 01.25 | 00.48 | 00.839% | BC 1122[32] | — | — |
| Aksumite Empire | 01.25 | 00.48 | 00.839% | 350[4] | — | — |
| Carolingian Dynasty, Francia | 01.2 | 00.46 | 00.806% | 814[4][8] | — | — |
| Srivijaya Empire | 01.2 | 00.46 | 00.806% | 1200[4] | — | — |
| Sunga Empire | 01.2 | 00.46 | 00.806% | BC 150[4] | — | — |
| Kingdom of Kush | 01.2 | 00.46 | 00.806% | BC 700[4] | — | — |
| Thai Empire | 01.12 | 00.43 | 00.752% | 1782[citation needed] | — | — |
| Chalukya Dynasty, India | 01.1 | 00.42 | 00.739% | 636[citation needed] | — | — |
| Swedish Empire | 01.1 | 00.42 | 00.739% | 1658[citation needed] | — | — |
| Lodhi Dynasty, India | 01.1 | 00.42 | 00.739% | 1517[citation needed] | — | — |
| Polish-Lithuanian Empire | 01.0[48] | 00.39 | 00.671% | 1619[49][50] | ca. 12.0 (in 1619) | 02.07% to 02.41% (avg. 02.2%)[21] |
| 18th Dynasty, Egypt | 01.0 | 00.39 | 00.671% | BC 1450[32] | — | — |
| New Kingdom, Egypt | 01.0 | 00.39 | 00.671% | BC 1300[4][32] | — | — |
| Ptolemaic Dynasty, Egypt | 01.0 | 00.39 | 00.671% | BC 301[32] | — | — |
| Eastern Wei Dynasty, China | 01.0 | 00.39 | 00.671% | 550[26] | — | — |
| Northern Qi Dynasty, China | 01.0 | 00.39 | 00.671% | 550[26] | — | — |
| Tahirid Dynasty, Persia | 01.0 | 00.39 | 00.671% | 800[8] | — | — |
| Kalachuri Dynasty, India | 01.0 | 00.39 | 00.671% | 1050[4][8] | — | — |
| Holy Roman Empire | 01.0 | 00.39 | 00.671% | 1050[8] | — | — |
| Western Xia Dynasty, China | 01.0 | 00.39 | 00.671% | 1100[4] | — | — |
| Western Chalukya Empire | 01.0 | 00.39 | 00.671% | 1121[citation needed] | — | — |
| Khmer Empire | 01.0 | 00.39 | 00.671% | 1290[4][8] | — | — |
| Avars Empire | 01.0 | 00.39 | 00.671% | 600[26] | — | — |
| Kanem Empire | 01.0 | 00.39 | 00.671% | 1200[8] | — | — |
| Maha-Meghavahana Dynasty, India | 00.9 | 00.35 | 00.604% | BC 10[32] | — | — |
| Konbaung Dynasty, Burma | 00.9 | 00.35 | 00.604% | 1800 AD[citation needed] | — | — |
| Volga Bulgars Khanate | 00.9 | 00.35 | 00.604% | 1100[4][8] | — | — |
| Akkadian Empire | 00.8 | 00.31 | 00.537% | BC 2250[32] | — | — |
| Later Jin Dynasty, China | 00.8 | 00.31 | 00.537% | 936[8] | — | — |
| Ghana Empire | 00.8 | 00.31 | 00.537% | 1067[26] | — | — |
| Pagan Kingdom | 00.8 | 00.31 | 00.537% | 1200[8] | — | — |
| Western Satraps Dynasty, India | 00.8 | 00.31 | 00.537% | 100[26] | — | — |
| Himyarite Kingdom | 00.8 | 00.31 | 00.537% | 400 AD[32] | — | — |
| Balhae Kingdom | 00.8 | 00.31 | 00.537% | 830[4] | — | — |
| Khanate of Kazan | 00.7 | 00.27 | 00.470% | 1540[8] | — | — |
| Merovingian Dynasty, Francia | 00.7 | 00.27 | 00.470% | 558[8] | — | — |
| Bulgarian Empire | 00.7 | 00.27 | 00.470% | 900[citation needed] | — | — |
| Shu Dynasty, China | 00.7 | 00.27 | 00.470% | 221[26] | — | — |
| Yadava Gauli Kingdom | 00.7 | 00.27 | 00.470% | 1250[8] | — | — |
| Paramara Dynasty, India | 00.7 | 00.27 | 00.470% | 1050[26] | — | — |
| Kingdom of Dali | 00.7 | 00.27 | 00.470% | 1200[citation needed] | — | — |
| Vijayanagara Empire | 00.7 | 00.27 | 00.470% | 1529[citation needed] | — | 05.00% (25.0 million out of 500 million[9] in the 16th century) |
| Kingdom of Nanzhao | 00.7 | 00.27 | 00.470% | 830[8] | — | — |
| Austro-Hungarian Empire | 00.676615 | 00.26 | 00.454% | — | 52.8 in 1914 | 02.90% (51.3 million out of 1.753 billion in 1910) |
| 15th Dynasty, Egypt | 00.65 | 00.25 | 00.436% | BC 1650[32] | — | — |
| 26th Dynasty, Egypt | 00.65 | 00.25 | 00.436% | BC 550[32] | — | — |
| Vakataka Kingdom | 00.65 | 00.25 | 00.436% | 450 AD[32] | — | — |
| Visigothic Kingdom | 00.6 | 00.23 | 00.403% | 580[26] | — | — |
| Caliphate of Córdoba | 00.6 | 00.23 | 00.403% | 1000[8] | — | — |
| Rai Dynasty, Sindh, India | 00.6 | 00.23 | 00.403% | 675 AD[26] | — | — |
| Maukhari Kannauj Dynasty, India | 00.6 | 00.23 | 00.403% | 600 AD[8] | — | — |
| Bahmani Sultanate, India | 00.6 | 00.23 | 00.403% | 1470 AD[8] | — | — |
| Nizams Dynasty, India | 00.6 | 00.23 | 00.403% | 1740 AD[citation needed] | — | — |
| Sikh Empire | 00.5609 | 00.22 | 00.377% | 1845[citation needed] | — | — |
| Middle Kingdom, Egypt | 00.5 | 00.19 | 00.336% | BC 1850[32] | — | — |
| Lydian Empire | 00.5 | 00.19 | 00.336% | BC 585[32] | — | — |
| Neo-Babylonian Empire | 00.5 | 00.19 | 00.336% | BC 562[32] | — | — |
| Kosala Dynasty, India | 00.5 | 00.19 | 00.336% | BC 543[26] | — | — |
| Shishunaga Dynasty, India | 00.5 | 00.19 | 00.336% | BC 510[26] | — | — |
| Chu Dynasty, China | 00.5 | 00.19 | 00.336% | BC 350[26] | — | — |
| Pandyan Dynasty, India | 00.5 | 00.19 | 00.336% | 1251[citation needed] | — | — |
| Later Han Dynasty, China | 00.5 | 00.19 | 00.336% | 947[8] | — | — |
| Kangju Empire | 00.5 | 00.19 | 00.336% | BC 100[26] | — | — |
| Ostrogothic Kingdom | 00.5 | 00.19 | 00.336% | 510 AD[8] | — | — |
| Goguryeo Kingdom | 00.45 | 00.17 | 00.302% | 476[32] | — | — |
| Xia Dynasty, China; (possible) | 00.45 | 00.17 | 00.302% | BC 1800[32] | — | — |
| Polish Piast State | 00.4 | 00.15 | 00.269% | 1003[49][51] | ca. 2 (in 1003)[48][52] | 0.58% to 0.79% (avg. 0.7%)[21] |
| Crimean Khanate | 00.4 | 00.15 | 00.269% | 1500[8] | — | — |
| Armenian Empire | 00.4 | 00.15 | 00.269% | BC 83[26] | — | — |
| Old Kingdom, Egypt | 00.4 | 00.15 | 00.269% | BC 2400[32] | — | — |
| Middle Kingdom, Assyria | 00.4 | 00.15 | 00.269% | BC 1080[32] | — | — |
| Latin Empire | 00.35 | 00.14 | 00.235% | 1204[26] | — | — |
| Mitanni Empire | 00.3 | 00.12 | 00.201% | BC 1450[32] | — | — |
| Carthaginian Empire | 00.3 | 00.12 | 00.201% | BC 220[32] | — | — |
| 1st Dynasty, Babylon | 00.25 | 00.10 | 00.168% | BC 1690[32] | — | — |
| Serbian Empire | 00.25 | 00.10 | 00.168% | 1350[citation needed] | — | — |
| Aztec Empire | 00.22 | 00.08 | 00.148% | 1520[8] | — | — |
| Middle Elamite | 00.2 | 00.08 | 00.134% | BC 1160[32] | — | — |
| 2nd Dynasty, Isin | 00.2 | 00.08 | 00.134% | BC 1130[32] | — | — |
| Urartu Empire | 00.2 | 00.08 | 00.134% | BC 800[32] | — | — |
| Amorian Dynasty, Byzantium | 00.2 | 00.08 | 00.134% | BC 750[32] | — | — |
| Old Kingdom, Assyria | 00.15 | 00.06 | 00.101% | BC 1730[32] | — | — |
| Eastern Zhou Dynasty, China | 00.15 | 00.06 | 00.101% | BC 770[32] | — | — |
Maps
Ancient empires
-
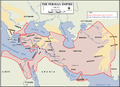 Achaemenid Empire around 490 BC shortly before its greatest extent.
 -
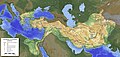 Macedonian Empire at its greatest extent.
 -
 The Roman Empire at its peak in 117 AD
 -
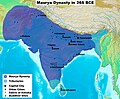 Maurya Empire at its greatest extent.


Medieval empires
-
 Mongol Empire at its greatest extent.
 -
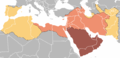 The expansion of the Caliphate.Expansion under Muhammad, 622-632Expansion during the Rashidun Caliphate, 632-661Expansion during the Umayyad Caliphate, 661-750
 -
 Animation showing Tang Dynasty territorial changes.
 -
 Sassanid Empire at its greatest extent.


Modern empires
-
British Empire at its greatest extent.
-
Russian Empire at its greatest extent.
-
Spanish Empire at its greatest extent.
-
Map of the Italian Colonial Empire in 1939
-
 All territories and spheres of influence ever held by the French Empire.
 -
Anachronous map of the Portuguese Empire.
-
 Qing Empire at its greatest extent
 -
 Ottoman territories acquired between 1481 and 1683 (See: list of territories)
.png)


Largest empires by economy
GDP estimates in the following list are mostly given for empires in modern times, from the 18th to 20th centuries. All dollar amounts are in 1990 USD.
GDP size
- British Empire - $918.7 billion (in 1938)[3]
- Nazi German Empire - $375.6 billion (in 1938)[3]
- Japanese Empire - $260.7 billion (in 1938)[3]
- Russian Empire - $257.7 billion (in 1913)[9]
- Qing Empire, China - $241.3 billion (GDP decline to 1912, immediately before its downfall)[9]
- French Empire - $234.1 billion (in 1938)[3]
- Italian Empire - $143.4 billion (in 1938)[3]
- Indian Empire (British Raj) - $134.9 billion (in 1870)[9]
- Afsharid Empire, Persia - $119.85 billion (in 1740)[9]
- Austro-Hungarian Empire - $100.5 billion (in 1913)[53]
- Mughal Empire, India - $90.8 billion (GDP decline in 1700)[9]
- Dutch Empire - $60 billion (in 1900)
- Ottoman Empire - $26.4 billion (in 1913)[54]
- Portuguese Empire - $12.6 billion (in 1913)[53]
This section's factual accuracy is disputed. (November 2009) |
See also
- Empire
- List of empires
- Historical powers
- List of historical countries and empires spanning more than one continent
- List of countries by area
- List of countries by GDP
- List of countries by population
- List of extinct states
- List of political and geographic subdivisions by total area
- European empires
- African empires
- The World Economy: Historical Statistics
Notes and references
- ^ CIA - The World Factbook
- ^ Ferguson, Niall (2004). Empire, The rise and demise of the British world order and the lessons for global power. Basic Books. ISBN 0-465-02328-2.
- ^ a b c d e f g h Harrison (1998, pp. 3,7).
- ^ a b c d e f g h i j k l m n o p q r s t u v w x y z aa ab ac ad ae af ag ah ai aj ak al am an ao ap aq ar as at au av aw ax ay az ba bb bc bd Peter Turchin, Thomas D. Hall and Jonathan M. Adams, "East-West Orientation of Historical Empires", Journal of World-Systems Research Vol. 12 (no. 2), pp. 219-229 (2006).
- ^ a b c «Mongolia se encomienda a Gengis Jan» (en español). diario El País 18.08.2007 (2007). Consultado el 19/06/2008.
- ^ The combined population of China and Korea in the 13th century was 83 in Biraben (2003[page needed]). The combined population of Eastern Europe, Russia, Central Asia, Iran, Iraq and Turkey was about 27 in Maddison (2006[page needed]).
- ^ Biraben, Jean-Noel; Biraben, Jean-Noel (1979-01). "Essai sur l'evolution du nombre des hommes". Population (French Edition). 34 (1). Institut National d'É: 13–25. doi:10.2307/1531855.
{{cite journal}}: Check date values in:|date=(help) - ^ a b c d e f g h i j k l m n o p q r s t u v w x y z aa ab ac ad ae af ag ah ai aj ak al am an ao ap aq ar as at au av aw ax ay az ba bb bc bd be bf bg bh bi bj bk bl Rein Taagepera (September 1997). "Expansion and Contraction Patterns of Large Polities: Context for Russia". International Studies Quarterly. 41 (3): 475–504. doi:10.1111/0020-8833.00053.
- ^ a b c d e f g h i j k l m n o p q r Maddison, op cit. For alternate estimates, see the Economic History Services' USA/UK GDP search tool.
- ^ a b c d e Gordon (2005)
- ^ The combined population of Spain, Portugal, Italy, Netherlands, United States and the Philippines was 29.2 in Maddison (2006[page needed]). The population of Latin America was 39 in Biraben (2003[page needed]), minus Brazil and its 4 people with was a part of the Portuguese empire.
- ^ Recorded number of persons in 1851 is 432,164,047 according to Draft History of Qing.
- ^ a b c d e f g (a) John D. Durand, 1960, "The Population Statistics of China, A.D. 2–1953," Population Studies Vol. 13 (No. 3), 209–256. (b) John D. Durand, 1974, "Historical Estimates of World Population: An Evaluation," University of Pennsylvania, Population Center, Analytical and Technical Reports, Number 10.
- ^ Recorded number of persons and households in 1290 are 58,834,711 and 13,196,206, respectively (History of Yuan), while recorded peak number of persons and households are 59,848,964 and 13,430,322 in 1291, respectively (History of Yuan).
- ^ Blankinship, Khalid Yahya (1994). The End of the Jihad State, the Reign of Hisham Ibn 'Abd-al Malik and the collapse of the Umayyads. State University of New York Press. p. 37. ISBN 0791418278.
- ^ The combined population of Southwest Asia and North Africa was about 57 in Biraben (2003[page needed]). The combined population of Spain and Portugal was about 5 in Maddison (2006[page needed]).
- ^ a b McEvedy and Jones (1978).
- ^ Rashidun Caliphate
- ^ Vasseghi, Sheda, "The other Iran story: Re-engineering the nation's cultural DNA", Breaking... WorldTribune.com World Tribune News, (12 October 2009).
- ^ While estimates for the Achaemenid Empire range from 10–80+ million, most prefer 50 million. Prevas (2009, p. 14) estimates 10 1. Langer (2001, p. 40) estimates around 16 2. McEvedy and Jones (2001, p. 50) estimates 17 3. Strauss (2004, p. 37) estimates about 20 4. Ward (2009, p. 16) estimates at 20 5. Aperghis (2007, p. 311) estimates 32 6. Scheidel (2009, p. 99) estimates 35 7. Zeinert (1996, p. 32) estimates 40 8. Rawlinson and Schauffler (1898, p. 270) estimates possibly 50 9. Astor (1899, p. 56) estimates almost 50 10. Lissner (1961, p. 111) estimates probably 50 11. Milns (1968, p. 51) estimates some 50 12. Hershlag (1980, p. 140) estimates nearly 50 13. Daniel (2001, p. 41) estimates at 50 15. Meyer and Andreades (2004, p. 58) estimates to 50 16. Pollack (2004, p. 7) estimates about 50 17. Jones (2004, p. 8) estimates over 50 18. Safire (2007, p. 627) estimates in 50 19. Dougherty (2009, p. 6) estimates about 70 20. Richard (2008, p. 34) estimates nearly 70 21. Mitchell (2004, p. 16) estimates over 70 22. Hanson (2001, p. 32) estimates almost 75 23. West (1913, p. 85) estimates about 75 24. Zenos (1889, p. 2) estimates exactly 75 25. Cowley (1999 and 2001, p. 17) estimates possibly 80 26. Cook (1904, p. 277) estimates exactly 80 27.
- ^ a b c Historical Estimates of World Population U.S. Census Bureau.
- ^ Yarshater (1996, p. 47)
- ^ French Books on India - an open access, 1000+ title bibliography with an introduction and annotations on the 50 most important books.
- ^ Jean-Noël Biraben, "The History of the Human Population From the First Beginnings to the Present" in Demography: Analysis and Synthesis: A Treatise in Population (Eds: Graziella Caselli, Jacques Vallin, Guillaume J. Wunsch), Vol. III, Chapter 66, pp 5-18, Academic Press:San Diego (2005).
- ^ Recorded number of persons and households in 1393 are 60,545,812 and 10,652,870, respectively (Ming Hui Dian), while recorded peak number of persons and households are 66,598,337 and 11,415,829 in 1403, respectively (Book of Ming).
- ^ a b c d e f g h i j k l m n o p q r s t u v w x y z aa ab ac ad ae af ag ah ai aj ak al am an ao ap aq ar as at au Rein Taagepera "Size and Duration of Empires: Growth-Decline Curves, 600 B.C. to 600 A.D.", Social Science History Vol. 3, 115-138 (1979).
- ^ Recorded number of persons and households in AD 2 are 59,594,978 and 12,233,062, respectively (Book of Han).
- ^ Steele, Christy, "Rome", p. 36 (2001).
- ^ a b Mclynn Frank "Marcus Aurelius" p. 4. Published by The Bodley Head 2009
- ^ There are several different estimates for the Roman Empire. Scheidel (2006, p. 2) estimates 60 . Goldsmith (1984, p. 263) estimates 55 . Beloch (1886, p. 507) estimates 54 . Maddison (2006, p. 51, 120) estimates 48 . Roman Empire Population estimates 65 (while mentioning several other estimates between 55 and 120 ).
- ^ Taagepera, Rein (1979). "Size and Duration of Empires: Growth-Decline Curves, 600 B.C. to 600 A.D.". Social Science History. 3 (3/4). Duke University Press: 125. doi:10.2307/1170959. JSTOR 1170959.
- ^ a b c d e f g h i j k l m n o p q r s t u v w x y z aa ab ac ad ae af ag Rein Taagepera "Size and Duration of Empires Growth-Decline Curves, 3000 to 600 B.C.", Social Science Research Vol. 7, 180-196 (1978).
- ^ Colin McEvedy and Richard Jones (1978), "Atlas of World Population History", Facts on File (p. 342-351). New York.
- ^ Thomlinson (1975, Table 1).
- ^ Claudio Cioffi-Revilla, J. Daniel Rogers, Steven P. Wilcox, & Jai Alterman, "Computing the Steppes: Data Analysis for Agent-Based Modeling of Polities in Inner Asia", Proceedings of the 104th Annual Meeting of the Amer. Pol. Sci. Assoc., Boston, MA, p. 8 August 28–31, (2008).
- ^ [1]
- ^ "The Cholas"" University of Madras"K. A. Nilakanta Sastri
- ^ Recorded number of persons and households in 1195 are 48,490,400 and 7,223,400, respectively (History of Jin).
- ^ Recorded number of persons and households in 1103 are 45,981,845 and 20,524,065, respectively (Song Huiyao), while recorded peak number of persons and households are 46,734,784 and 20,882,438 in 1109, respectively (Song Huiyao).
- ^ Recorded number of persons and households are 46,019,956 and 8,907,546, respectively, in 606 (Tongdian) or 609 (Book of Sui).
- ^ Recorded number of persons and households in 1193 are 27,845,085 and 12,302,873, respectively (Wenxian Tongkao), while recorded peak number of persons and households are 28,320,085 and 12,670.801 in 1223, respectively (Wenxian Tongkao).
- ^ Recorded number of persons and households in 156 are 56,486,856 and 10,677,960 respectively (Book of the Later Han).
- ^ "Mexico". The World Factbook (2024 ed.). Central Intelligence Agency.
- ^ Rein Taagepera "Size and Duration of Empires: Systematics of Size", Social Science Research Vol. 7, 108-127 (1978).
- ^ John O. Hunwick: Timbuktu and the Songahy Empire: Al-Sa’di’s Ta’rikh Al-sudan Down to 1613 and other Contemporary Documents (Brill, 2003),p. xlix.
- ^ Hempstone, page 312
- ^ Walker, Sheila S., African roots/American cultures: Africa in the creation of the Americas, Published by Rowman & Littlefield, p. 127. (2001)
- ^ a b Collective work. "Atlas Historyczny Polski". PPWK, 1985
- ^ a b Maps of border changes"[2]"
- ^ Administrative division in 1619"[3]"
- ^ State of Boleslaw Chrobry"History of Poland during the Piast dynasty"
- ^ Population of Poland"pl:Ludność Polski"
- ^ a b Broadberry and Harrison (2005).
- ^ Pamuk (2005[page needed]).
![[3]](http://images.wikia.com/historyatlas/images/e/ef/Polish-Lithuanian_Commonwealth-1619.png)
Bibliography
- Hempstone, Smith (2007). Africa, Angry Young Giant. Whitefish: Kessinger Publishing, LLC. pp. 664 pages. ISBN 0-54844-300-9.
- Jonathan M. Adams, Thomas D. Hall and Peter Turchin (2004). East-West Orientation of Historical Empires. University of Connecticut.
- J. Beloch (1886), Die Bevölkerung der griechisch–römischen Welt, Duncker and Humblot, Leipzig.
- Jean-Noël Biraben (2003). "The rising numbers of humankind", Populations & Societies 394.
- Roger Boesche (2003). "Kautilya’s Arthashastra on War and Diplomacy in Ancient India", The Journal of Military History 67 (p. 9–38).
- Stephen Broadberry and Mark Harrison (2005). The Economics of World War I. Cambridge University Press. ISBN 0-521-8521 2-9.
- Christopher Chase-Dunn, Alexis Álvarez, and Daniel Pasciuti (2002). Power and Size: Urbanization and Empire Formation in World-Systems Since the Bronze Age. University of California, Riverside.
- Ferguson, Niall (2004). Colossus: The Price of America's Empire. Penguin. ISBN 1594200130.
- Raymond W. Goldsmith (1984), "An estimate of the size and structure of the national product of the Early Roman Empire", Journal of the International Association for Research in Income and Wealth 30
- Bruce R. Gordon (2005). To Rule the Earth... (See Bibliography for sources used.)
- Mark Harrison (1998). The Economics of World War II: Six Great Powers in International Comparison.
- Angus Maddison (2001). The World Economy: A Millennial Perspective. OECD, Paris.
- Angus Maddison (2006). The Contours of the World Economy 1-2030 AD. Oxford University Press.
- Colin McEvedy and Richard Jones (1978), "Atlas of World Population History", Facts on File (p. 342-351). New York.
- Sevket Pamuk (2005), "The Ottoman Empire in World War I". In Stephen Broadberry and Mark Harrison (2005), The Economics of World War I, p. 112-136. Cambridge University Press. ISBN 0-521-8521 2-9.
- Donald Quataert (2005). The Ottoman Empire, 1700-1922.
- Walter Scheidel (2005). The monetary systems of the Han and Roman empires. Stanford University.
- Walter Scheidel (2006). Imperial state formation in Rome and China. Stanford University.
- Carla M. Sinopoli (2003). The Political Economy of Craft Production: Crafting Empire in South India, C. 1350-1650.
- Ralph Thomlinson (1975), Demographic Problems, Controversy Over Population Control, Second Edition.
- Frances Wood (2006). China: The Three Emperors. Royal Academy.
- H. Yoon (1985). "An early Chinese idea of a dynamic environmental cycle", GeoJournal 10 (2), p. 211-212.
- K. A. Nilakanta Sastri.(1935)"The Cholas"" University of Madras.