
Demographic history of Kosovo: Difference between revisions
Spelling fixes. No sign of any consensus to change spelling away from that used in censuses &c. |
we need to use the English names for cities of Kosovo, reverting biased user |
||
| Line 710: | Line 710: | ||
|} |
|} |
||
* 2011 - census population |
|||
===Wedlocks and divorces=== |
===Wedlocks and divorces=== |
||
| Line 840: | Line 840: | ||
| |
| |
||
|} |
|} |
||
===Ethnic groups=== |
===Ethnic groups=== |
||
{{further|Albanians of Kosovo|Bosniaks in Kosovo|Serbs of Kosovo|Montenegrins of Kosovo|Roma of Kosovo|Gorani (ethnic group)|Turks in Kosovo|Janjevci}} |
{{further|Albanians of Kosovo|Bosniaks in Kosovo|Serbs of Kosovo|Montenegrins of Kosovo|Roma of Kosovo|Gorani (ethnic group)|Turks in Kosovo|Janjevci}} |
||
The official results of the censuses in Kosovo after [[World War II]] are tabulated below. The proportion of [[Albanians]] was below 70% until 1961, but increased to 81.6% in 1991. The figures for Albanians in the 1991 census were estimates only, since that census was boycotted by most Albanians. Similarly, the figures for Serbs in the 2011 census omit those in [[North Kosovska Mitrovica]], [[ |
The official results of the censuses in Kosovo after [[World War II]] are tabulated below. The proportion of [[Albanians]] was below 70% until 1961, but increased to 81.6% in 1991. The figures for Albanians in the 1991 census were estimates only, since that census was boycotted by most Albanians. Similarly, the figures for Serbs in the 2011 census omit those in [[North Kosovska Mitrovica]], [[Leposavić]], [[Zubin Potok]], and [[Zvečan]]. The 2011 census also disambiguated the group formerly described as [[Muslims by nationality|Muslims]] into [[Bosniaks]] and [[Gorani people|Gorani]] and the group formerly known as [[Romani people|Romani]] into separate groups of [[Roma (Romani subgroup)|Roma]], [[Ashkali]], and [[Balkan Egyptians|Egyptians]]. For easy comparison, the table follows the older ethnic divisions. |
||
{| class="wikitable" |
{| class="wikitable" |
||
| Line 1,077: | Line 1,076: | ||
| align="center" style="background:#f0f0f0;"|'''Total''' |
| align="center" style="background:#f0f0f0;"|'''Total''' |
||
|- |
|- |
||
| |
| Dečan||64||39,402||3||0||60||33||42||393||1||19||2||40,019 |
||
|- |
|- |
||
| |
| Đakovica||134||87,672||17||16||73||738||613||5,177||13||92||71||94,556 |
||
|- |
|- |
||
| |
| Glogovac||38||58,445||2||5||14||0||0||3||0||22||3||58,531 |
||
|- |
|- |
||
| |
| Gnjilane||65||87,814||624||978||121||361||15||1||69||95||35||90,178 |
||
|- |
|- |
||
| |
| Dragaš||22||20,287||7||202||4,100||3||4||3||8,957||283||129||33,997 |
||
|- |
|- |
||
| |
| Istok||31||36,154||194||10||1,142||39||111||1,544||0||45||19||39,289 |
||
|- |
|- |
||
| |
| Kačanik||11||33,362||1||2||20||5||1||0||0||7||0||33,409 |
||
|- |
|- |
||
| |
| Klina||32||37,216||98||3||20||78||85||934||0||23||7||38,496 |
||
|- |
|- |
||
| |
| Kosovo Polje||32||30,275||321||62||34||436||3,230||282||15||131||9||34,827 |
||
|- |
|- |
||
| |
| Kosovska Kamenica||31||34,186||1,554||5||9||240||0||0||29||27||4||36,085 |
||
|- |
|- |
||
| |
| Kosovska Mitrovica||152||69,497||14||518||416||528||647||6||23||47||61||71,909 |
||
|- |
|- |
||
| |
| Leposavić|| - || - || - || - || - || - || - || - || - || - || - || - |
||
|- |
|- |
||
| |
| Lipljan||27||54,467||513||128||42||342||1,812||4||6||260||4||57,605 |
||
|- |
|- |
||
| |
| Novo Brdo||3||3,524||3,122||7||5||63||3||0||0||2||0||6,729 |
||
|- |
|- |
||
| |
| Obilić||12||19,854||276||2||58||661||578||27||5||48||28||21,549 |
||
|- |
|- |
||
| |
| Orahovac||83||55,166||134||2||10||84||404||299||0||11||15||56.208 |
||
|- |
|- |
||
| |
| Peć||79||87,975||332||59||3,786||993||143||2,700||189||132||62||96,450 |
||
|- |
|- |
||
| |
| Podujevo||120||87,523||12||5||33||74||680||2||0||43||7||88,499 |
||
|- |
|- |
||
| |
| Pristina||220||194,452||430||2,156||400||56||557||8||205||334||79||198,897 |
||
|- |
|- |
||
| Prizren||159||145,718||237||9,091||16,869||2,899||1,350||168||655||386||222||177,781 |
| Prizren||159||145,718||237||9,091||16,869||2,899||1,350||168||655||386||222||177,781 |
||
|- |
|- |
||
| |
| Srbica||60||50,685||50||1||42||0||10||1||0||5||4||50,858 |
||
|- |
|- |
||
| |
| Štimlje||19||26,447||49||1||20||23||750||0||2||13||0||27,324 |
||
|- |
|- |
||
| |
| Štrpce||6||3,757||3,148||0||2||24||1||0||0||7||4||6,949 |
||
|- |
|- |
||
| |
| Suva Reka||49||59,076||2||4||15||41||493||5||0||15||22||58,722 |
||
|- |
|- |
||
| |
| Uroševac||220||104,152||32||55||83||204||3,629||24||64||102||45||108,610 |
||
|- |
|- |
||
| |
| Vitina||48||46,669||113||4||25||12||14||0||7||83||12||46,987 |
||
|- |
|- |
||
| |
| Vučitrn||53||68,840||384||278||33||68||143||1||3||50||17||69,870 |
||
|- |
|- |
||
| |
| Zubin Potok|| -|| -|| -|| -|| -|| -|| -|| -|| -|| -|| -|| - |
||
|- |
|- |
||
| |
| Zvečan|| -|| -|| -|| -|| -|| -|| -|| -|| -|| -|| -|| - |
||
|- |
|- |
||
| |
| Mališevo||36||54,501||0||0||15||26||5||0||0||8||22||54,613 |
||
|- |
|- |
||
| Junik||9||6,069||0||0||0||0||0||0||0||4||2||6,084 |
| Junik||9||6,069||0||0||0||0||0||0||0||4||2||6,084 |
||
|- |
|- |
||
| |
| Mamuša||0||327||0||5,182||1||39||12||0||0||0||0||5,507 |
||
|- |
|- |
||
| |
| Đeneral Janković||1||9,357||0||0||42||0||0||0||0||2||1||9,403 |
||
|- |
|- |
||
| |
| Gračanica||17||2,474||7,209||15||15||745||104||3||3||45||26||10,675 |
||
|- |
|- |
||
| |
| Ranilug||6||164||3,692||0||1||0||0||0||0||3||0||3,866 |
||
|- |
|- |
||
| |
| Parteš||0||0||1,785||0||0||0||0||0||0||2||0||1,787 |
||
|- |
|- |
||
| |
| Klokot||1||1,362||1,777||1||0||9||0||0||0||6||0||2,556 |
||
|- |
|- |
||
| Total ||1,840||1,616,869||25,532||18,738||27,533||8,824||15,436||11,524||10,265||2,365||912||1,739,825 |
| Total ||1,840||1,616,869||25,532||18,738||27,533||8,824||15,436||11,524||10,265||2,365||912||1,739,825 |
||
| Line 1,184: | Line 1,183: | ||
population by sex is virtually the same in both urban and rural areas – 50.1% male and 49.9% |
population by sex is virtually the same in both urban and rural areas – 50.1% male and 49.9% |
||
female in urban areas and 50.2% male and 49.8% female in rural areas. |
female in urban areas and 50.2% male and 49.8% female in rural areas. |
||
;School Attendance: |
;School Attendance: |
||
As Table 2.6 displays, school participation rates are high, especially at ages 10–14, where they reach 98 percent of the people of these ages. The lower rate (80%) at ages 5–9 can be explained by the late starting age for some pupils, though it is noticeably higher than the 66 percent in the 2003 survey (see Figure 2.8). The school attendance rate for people aged 15–19 also increased between 2003 and 2009, from 63 percent to 77 percent. School attendance rates have also increased for other age groups.<ref>{{cite web|title=Demographic and Socioeconomic Fnidings, pg 7-11|url=http://esk.rks-gov.net/ENG/publikimet/doc_details/967-demographic-social-and-reproductive-health-survey-in-kosovo|accessdate=24 February 2013}}</ref> |
As Table 2.6 displays, school participation rates are high, especially at ages 10–14, where they reach 98 percent of the people of these ages. The lower rate (80%) at ages 5–9 can be explained by the late starting age for some pupils, though it is noticeably higher than the 66 percent in the 2003 survey (see Figure 2.8). The school attendance rate for people aged 15–19 also increased between 2003 and 2009, from 63 percent to 77 percent. School attendance rates have also increased for other age groups.<ref>{{cite web|title=Demographic and Socioeconomic Fnidings, pg 7-11|url=http://esk.rks-gov.net/ENG/publikimet/doc_details/967-demographic-social-and-reproductive-health-survey-in-kosovo|accessdate=24 February 2013}}</ref> |
||
There are differences in the attendance rates between rural and urban residents as well as between males and females. Males and females in rural areas who are age 15 or older attend school at a lower rate than their urban counterparts. The school attendance gap between rural and urban residents progressively widens in relative amounts as age increases. The urban-rural gap at older ages probably reflects the scarcity of higher educational opportunities in rural areas. In both urban and rural areas, among those aged 5–14, females are slightly more likely to be enrolled in school than males, but at older age groups males are more likely to be in school than females. |
There are differences in the attendance rates between rural and urban residents as well as between males and females. Males and females in rural areas who are age 15 or older attend school at a lower rate than their urban counterparts. The school attendance gap between rural and urban residents progressively widens in relative amounts as age increases. The urban-rural gap at older ages probably reflects the scarcity of higher educational opportunities in rural areas. In both urban and rural areas, among those aged 5–14, females are slightly more likely to be enrolled in school than males, but at older age groups males are more likely to be in school than females. |
||
| Line 1,210: | Line 1,205: | ||
;Crude Birth Rate: |
;Crude Birth Rate: |
||
In 2009 there were a total of 9,896 births to female respondents age 15-49 at the time of the survey, of which 370 occurred in the 12 months before the survey. From this we can calculate the crude birth rate (CBR) for the 12 months before the survey.<ref>{{cite web|title=Demographic and Socioeconomic Fnidings, pg 29|url=http://esk.rks-gov.net/ENG/publikimet/doc_details/967-demographic-social-and-reproductive-health-survey-in-kosovo|accessdate=24 February 2013}}</ref> |
In 2009 there were a total of 9,896 births to female respondents age 15-49 at the time of the survey, of which 370 occurred in the 12 months before the survey. From this we can calculate the crude birth rate (CBR) for the 12 months before the survey.<ref>{{cite web|title=Demographic and Socioeconomic Fnidings, pg 29|url=http://esk.rks-gov.net/ENG/publikimet/doc_details/967-demographic-social-and-reproductive-health-survey-in-kosovo|accessdate=24 February 2013}}</ref> |
||
===Health=== |
===Health=== |
||
| Line 1,296: | Line 1,289: | ||
However, around 3 percent of respondents born in Pristina region now live in a different region of Kosovo. On net, the population of Pristina region is 7.7 percent larger because of net internal lifetime migration. Peja region has the next highest rates of migration, with lifetime net inmigration of 6.7 percent. The regions of Gjakova and Mitrovica have suffered relatively large losses of lifetime migrants over the years, on net losing 6.4 percent and 5.2 percent, respectively, of the people born there (who are still alive and still in Kosovo) to net out-migration to other regions of Kosovo. This is not surprising given the very poor economic prospects in these two regions, as well as the political and security issues in Mitrovica.<ref>{{cite web|title=Demographic and Socioeconomic Fnidings, pg 72|url=http://esk.rks-gov.net/ENG/publikimet/doc_details/967-demographic-social-and-reproductive-health-survey-in-kosovo|accessdate=24 February 2013}}</ref> |
However, around 3 percent of respondents born in Pristina region now live in a different region of Kosovo. On net, the population of Pristina region is 7.7 percent larger because of net internal lifetime migration. Peja region has the next highest rates of migration, with lifetime net inmigration of 6.7 percent. The regions of Gjakova and Mitrovica have suffered relatively large losses of lifetime migrants over the years, on net losing 6.4 percent and 5.2 percent, respectively, of the people born there (who are still alive and still in Kosovo) to net out-migration to other regions of Kosovo. This is not surprising given the very poor economic prospects in these two regions, as well as the political and security issues in Mitrovica.<ref>{{cite web|title=Demographic and Socioeconomic Fnidings, pg 72|url=http://esk.rks-gov.net/ENG/publikimet/doc_details/967-demographic-social-and-reproductive-health-survey-in-kosovo|accessdate=24 February 2013}}</ref> |
||
;Emigration:<ref>{{cite web|title=Demographic and Socioeconomic Fnidings, pg 73|url=http://esk.rks-gov.net/ENG/publikimet/doc_details/967-demographic-social-and-reproductive-health-survey-in-kosovo|accessdate=24 February 2013}}</ref> |
;Emigration:<ref>{{cite web|title=Demographic and Socioeconomic Fnidings, pg 73|url=http://esk.rks-gov.net/ENG/publikimet/doc_details/967-demographic-social-and-reproductive-health-survey-in-kosovo|accessdate=24 February 2013}}</ref> |
||
=== Religion === |
=== Religion === |
||
| Line 1,676: | Line 1,668: | ||
359,346 total population |
359,346 total population |
||
* 194,190 Serbs (''10%'')<ref name="Political Parties of Eastern Europe">{{cite book|last=Bugajski|first=Janusz|title=Political Parties of Eastern Europe: A Guide to Politics in the Post-Communist Era|year=2002|publisher=The Center for Strategic and International Studies|location=New York|isbn=1563246767|page=479 |
* 194,190 Serbs (''10%'')<ref name="Political Parties of Eastern Europe">{{cite book|last=Bugajski|first=Janusz|title=Political Parties of Eastern Europe: A Guide to Politics in the Post-Communist Era|year=2002|publisher=The Center for Strategic and International Studies|location=New York|isbn=1563246767|page=479|url=http://books.google.co.uk/books?id=9gGKtLTQlUcC&printsec=frontcover&dq=Political+Parties+of+Eastern+Europe:+A+Guide+to+Politics+in+the+Post&hl=en&sa=X&ei=9aJUUebACILM0QWwpIC4Bg&ved=0CDIQ6AEwAA}}</ref> |
||
* 20,356 Montenegrins (''1%'') |
* 20,356 Montenegrins (''1%'') |
||
* 9,091 Albanians (most boycotted) |
* 9,091 Albanians (most boycotted) |
||
Revision as of 19:52, 8 April 2013
This article has multiple issues. Please help improve it or discuss these issues on the talk page. (Learn how and when to remove these template messages)
|
The demographic features of the population of Kosovo, includes various factors such as population density, ethnicity, education level, health of the populace, economic status, religious affiliations and other aspects of the population. The dominant ethnic group is Albanian, with significant minorities of Serbs and others.
The final results of the 2011 Census recorded Kosovo as having a population of 1,739,825 (excluding North Kosovo).[1]
Population
The 2000 Living Standard Measurement Survey by Statistical Office of Kosovo (rejected by Belgrade[2]): Total population estimated between 1.8-2.0 million.[3] From 2000, AMSJ (confirmed by Kosovo Statistical Office in 2003), estimating a 1,900,000 strong population.
Kosovo currently has the youngest population in Europe, with a fertility estimated by the Census Bureau of 2.4 children per woman. [2] As recently as 1990, [3] Kosovo's population structure resembled those of countries like Haiti, and was in stark contrast to the rest of Serbia [4] and other European countries. In recent years, however, Kosovo's population growth rate has begun to slow and its birth rate has decreased.
Vital statistics[4]
Vital phenomena In 2009 in Kosovo were registered 34,477 births, 34,240 of them were born alive, while 237 were born dead. The vitality ratio (ratio between live births and total deaths) was 9. Ratio of dead births-fetal deaths in 1000 births was 6.9 promil. The age group of mothers was as following: 25–29 years age group with 35.1%, 20–24 years old age groups with 26.4%, age group 30–34 years with 23.3%, and other age group compose 15.2% of the total number of births. The average age of women who have children born in 2009, is 27.7 years. Under the weight of children born in health institutions, the majority of infants with weight is 3000-3499gr. or 31.4% from 3500 to 3999 gr. 23.7%, from 2500 to 2999 gr.12.7%, etc. Live babies born weighing less than 1000 gr. constitute only 0.3%.[5] Under education, mothers with primary school dominate the top with 44.9% of secondary but not tertiary and university with 7.2%, etc. Frequent names in 2009 for girls were Erza(114 times)and Suela (108 times) while for boys was the names Leon (159 times) and Leart(124 times).[6] https://esk.rks-gov.net/ENG/pop/publications
| Year | Born alive | Dead (total) | Dead (infant) | Natural increase | Wedlock | Divorce |
| 2002 | 36,136 | 5,654 | 403 | 30,482 | 18,280 | : |
| 2003 | 31,994 | 6,417 | 483 | 25,577 | 17,034 | : |
| 2004 | 35,063 | 6,399 | 415 | 28,664 | 16,989 | 1,293 |
| 2005 | 37,218 | 7,207 | 357 | 30,011 | 15,732 | 1,445 |
| 2006 | 34,187 | 7,479 | 410 | 26,708 | 15,825 | 1,480 |
| 2007 | 33,112 | 6,681 | 366 | 26,431 | 16,824 | 1,558 |
| 2008 | 34,399 | 6,852 | 335 | 27,547 | 17,950 | 1,026 |
| 2009 | 34,240 | 7,030 | 288 | 27,210 | 20,209 | 1,555 |
| 2010 | 33,751 | 7,234 | 274 | 26,517 | 18,289 | 1,453 |
| 2011 | 34,262 | 7,556 | 337 | 26,706 | 17,343 | 1,469 |
VITAL PHENOMENA IN KOSOVO ACCORDING TO YEAR 2002 - 2011 result
| ' | Total | Male | Female | Sex Ratio |
| 2002 | 36,136 | 18,752 | 17,384 | 107.9 |
| 2003 | 31,994 | 16,777 | 15,217 | 110.3 |
| 2004 | 35,063 | 18,213 | 16,850 | 108.1 |
| 2005 | 37,218 | 19,431 | 17,787 | 109.2 |
| 2006 | 34,187 | 17,827 | 16,360 | 109 |
| 2007 | 33,112 | 17,394 | 15,718 | 110.7 |
| 2008 | 34,399 | 17,857 | 16,542 | 107.9 |
| 2009 | 34,240 | 17,853 | 16,387 | 108.9 |
| 2010 | 33,751 | 17,805 | 15,946 | 111.7 |
| 2011 | 34,262 | 17,837 | 16,425 | 108.6 |
DEATHS ACCORDING YEARS AND GENDER, 2002-2011
| Year | Total | Male | Female | Male % | Female % |
| 2002 | 5654 | 3348 | 2306 | 59.2 | 40.8 |
| 2003 | 6417 | 3741 | 2676 | 58.3 | 41.7 |
| 2004 | 6399 | 3654 | 2745 | 57.1 | 42.9 |
| 2005 | 7207 | 4058 | 3149 | 56.3 | 43.7 |
| 2006 | 7479 | 4313 | 3166 | 57.7 | 42.3 |
| 2007 | 6681 | 3867 | 2814 | 57.9 | 42.1 |
| 2008 | 6852 | 3963 | 2889 | 57.8 | 42.2 |
| 2009 | 7030 | 4079 | 2951 | 58 | 42 |
| 2010 | 7234 | 4263 | 2971 | 58.9 | 41.1 |
| 2011 | 7556 | 4442 | 3114 | 58.8 | 41.2 |
| Source: KAS, Vital Statistics | |||||
Population estimates in the table below may be unreliable since the 1990s. Besides, births and deaths exclude territories with a Serbian majority.
| Estimated population (x 1000) | Live births | Deaths | Natural change | Crude birth rate (per 1000) | Crude death rate (per 1000) | Natural change (per 1000) | |
|---|---|---|---|---|---|---|---|
| 1948 | 733 | 27 792 | 10 324 | 17 468 | 37.9 | 14.1 | 23.8 |
| 1949 | 751 | 31 643 | 12 937 | 18 706 | 42.1 | 17.2 | 24.9 |
| 1950 | 764 | 35 222 | 12 991 | 22 231 | 46.1 | 17.0 | 29.1 |
| 1951 | 780 | 29 299 | 14 833 | 14 466 | 37.6 | 19.0 | 18.5 |
| 1952 | 793 | 35 619 | 13 867 | 21 752 | 44.9 | 17.5 | 27.4 |
| 1953 | 813 | 34 595 | 16 726 | 17 869 | 42.6 | 20.6 | 22.0 |
| 1954 | 832 | 38 595 | 13 201 | 25 394 | 46.4 | 15.9 | 30.5 |
| 1955 | 842 | 36 736 | 15 292 | 21 444 | 43.6 | 18.2 | 25.5 |
| 1956 | 859 | 37 819 | 13 692 | 24 127 | 44.0 | 15.9 | 28.1 |
| 1957 | 873 | 34 159 | 15 300 | 18 859 | 39.1 | 17.5 | 21.6 |
| 1958 | 890 | 39 285 | 11 598 | 27 687 | 44.1 | 13.0 | 31.1 |
| 1959 | 921 | 37 364 | 12 878 | 24 486 | 40.6 | 14.0 | 26.6 |
| 1960 | 944 | 41 631 | 13 365 | 28 266 | 44.1 | 14.2 | 29.9 |
| 1961 | 972 | 40 561 | 11 759 | 28 802 | 41.7 | 12.1 | 29.6 |
| 1962 | 997 | 41 336 | 15 024 | 26 312 | 41.5 | 15.1 | 26.4 |
| 1963 | 1 021 | 41 525 | 12 423 | 29 102 | 40.7 | 12.2 | 28.5 |
| 1964 | 1 046 | 42 557 | 12 731 | 29 826 | 40.7 | 12.2 | 28.5 |
| 1965 | 1 075 | 43 569 | 11 767 | 31 802 | 40.5 | 10.9 | 29.6 |
| 1966 | 1 101 | 42 429 | 10 266 | 32 163 | 38.5 | 9.3 | 29.2 |
| 1967 | 1 131 | 44 001 | 11 308 | 32 693 | 38.9 | 10.0 | 28.9 |
| 1968 | 1 159 | 44 627 | 10 781 | 33 846 | 38.5 | 9.3 | 29.2 |
| 1969 | 1 189 | 46 480 | 10 892 | 35 588 | 39.1 | 9.2 | 29.9 |
| 1970 | 1 220 | 44 496 | 10 829 | 33 667 | 36.5 | 8.9 | 27.6 |
| 1971 | 1 254 | 47 060 | 10 312 | 36 748 | 37.5 | 8.2 | 29.3 |
| 1972 | 1 291 | 47 943 | 10 270 | 37 673 | 37.1 | 8.0 | 29.2 |
| 1973 | 1 329 | 47 714 | 10 358 | 37 356 | 35.9 | 7.8 | 28.1 |
| 1974 | 1 367 | 49 847 | 10 075 | 39 772 | 36.5 | 7.4 | 29.1 |
| 1975 | 1 406 | 49 310 | 10 018 | 39 292 | 35.1 | 7.1 | 27.9 |
| 1976 | 1 446 | 51 355 | 10 149 | 41 206 | 35.5 | 7.0 | 28.5 |
| 1977 | 1 487 | 49 849 | 9 811 | 40 038 | 33.5 | 6.6 | 26.9 |
| 1978 | 1 526 | 49 027 | 9 776 | 39 251 | 32.1 | 6.4 | 25.7 |
| 1979 | 1 566 | 48 125 | 9 575 | 38 550 | 30.7 | 6.1 | 24.6 |
| 1980 | 1 555 | 53 147 | 8 909 | 44 238 | 34.2 | 5.7 | 28.4 |
| 1981 | 1 595 | 48 111 | 9 677 | 38 434 | 30.2 | 6.1 | 24.1 |
| 1982 | 1 629 | 52 865 | 10 479 | 42 386 | 32.5 | 6.4 | 26.0 |
| 1983 | 1 664 | 49 645 | 11 040 | 38 605 | 29.8 | 6.6 | 23.2 |
| 1984 | 1 699 | 55 243 | 10 573 | 44 670 | 32.5 | 6.2 | 26.3 |
| 1985 | 1 735 | 53 925 | 11 826 | 42 099 | 31.1 | 6.8 | 24.3 |
| 1986 | 1 773 | 54 519 | 10 446 | 44 073 | 30.7 | 5.9 | 24.9 |
| 1987 | 1 811 | 56 221 | 10 307 | 45 914 | 31.0 | 5.7 | 25.4 |
| 1988 | 1 850 | 56 283 | 10 257 | 46 026 | 30.4 | 5.5 | 24.9 |
| 1989 | 1 889 | 53 656 | 10 181 | 43 475 | 28.4 | 5.4 | 23.0 |
| 1990 | 1 930 | 55 175 | 8 214 | 46 961 | 28.6 | 4.3 | 24.3 |
| 1991 | 1 967 | 52 263 | 8 526 | 43 737 | 26.6 | 4.3 | 22.2 |
| 1992 | 2 006 | 44 418 | 8 004 | 36 414 | 22.1 | 4.0 | 18.2 |
| 1993 | 2 043 | 44 132 | 7 804 | 36 328 | 21.6 | 3.8 | 17.8 |
| 1994 | 2 077 | 43 450 | 7 667 | 35 783 | 20.9 | 3.7 | 17.2 |
| 1995 | 2 113 | 44 776 | 8 671 | 36 105 | 21.2 | 4.1 | 17.1 |
| 1996 | 2 151 | 46 041 | 8 392 | 37 649 | 21.4 | 3.9 | 17.5 |
| 1997 | 2 186 | 42 920 | 8 624 | 34 296 | 19.6 | 3.9 | 15.7 |
| 1998 | 2 000 | 41 752 | 8 123 | 33 629 | 20.9 | 4.1 | 16.8 |
| 1999 | 2 000 | 40 020 | 7 569 | 32 451 | 20.0 | 3.8 | 16.2 |
| 2000 | 2 000 | 38 667 | 7 115 | 31 552 | 19.3 | 3.6 | 15.8 |
| 2001 | 2 000 | 37 412 | 6 672 | 30 740 | 18.7 | 3.3 | 15.4 |
| 2002 | 1 985 | 36 136 | 5 654 | 30 482 | 18.2 | 2.8 | 15.4 |
| 2003 | 2 016 | 31 994 | 6 417 | 25 577 | 15.9 | 3.2 | 12.7 |
| 2004 | 2 041 | 35 063 | 6 399 | 28 664 | 17.2 | 3.1 | 14.0 |
| 2005 | 2 070 | 37 218 | 7 207 | 30 011 | 18.0 | 3.5 | 14.5 |
| 2006 | 2 100 | 34 187 | 7 479 | 26 708 | 16.3 | 3.6 | 12.7 |
| 2007 | 2 126 | 33 112 | 6 681 | 26 431 | 15.6 | 3.1 | 12.4 |
| 2008 | 2 153 | 34 399 | 6 852 | 27 547 | 16.0 | 3.2 | 12.8 |
| 2009 | 2 175 | 34 240 | 7 030 | 27 210 | 15.7 | 3.2 | 12.5 |
| 2010 | 2 199 | 33 751 | 7 234 | 26 517 | 15.3 | ||
| 2011 | 1 739* | 34 262* | 7 556 | 26 706 | 19.7* |
- 2011 - census population
Wedlocks and divorces
In 2009, in Kosovo were registered 20209 marriages. The average age of couples was 29.5 years. The average age for male is 31 years old, while the average age for women was 28 years old. Municipality of Prizren takes first place in Kosovo with 1720 marriages or 8.5% then comes Pristina with 1643 or 8.1%, Podujeva with 1302 or 6.4%, etc. According to the education, to male dominates the secondary education by 75,3.4%, also to women, dominates the secondary education with 64.5%.[7]
MARIAGES ACCORDING TO YEARS AND OVERAGE AGES OF CUPLES 2002-2011
| Year | TOTAL | The average age women | The average age men | The average marriage age |
| 2002 | 18, 280 | 25.8 | 29.4 | 27.3 |
| 2003 | 17, 034 | 28.2 | 29.7 | 27.7 |
| 2004 | 16, 917 | 27 | 30.3 | 28.7 |
| 2005 | 15, 732 | 27. 0 | 30.3 | 29. 0 |
| 2006 | 15, 825 | 27. 0 | 30.3 | 29. 0 |
| 2007 | 16, 824 | 27. 0 | 31.0 | 29. 0 |
| 2008 | 17, 950 | 28. 0 | 30.0 | 26. 0 |
| 2009 | 20, 209 | 28. 0 | 31.0 | 29.5 |
| 2010 | 18, 289 | 28. 0 | 30.0 | 28. 0 |
| 2011 | 17, 343 | 27.9 | 32.0 | 29. 0 |
Source: KAS, Vital Statistics
DIVORCES ACCORDING YEARS AND DURATION OF MARIAGES
| Year | Total | Less than a year | One year | Two years | Three years | Four years | 5–9 years | 10–14 years | 15–19 years | 20–24 years | 25 and more | Unknown |
| 2004 | 1 293 | 54 | 149 | 181 | 129 | 97 | 249 | 221 | 118 | 48 | 45 | 2 |
| 2005 | 1 445 | 67 | 143 | 186 | 172 | 148 | 272 | 228 | 137 | 52 | 40 | 0 |
| 2006 | 1 480 | 74 | 152 | 191 | 172 | 177 | 351 | 147 | 128 | 46 | 41 | 1 |
| 2007 | 1 558 | 149 | 208 | 162 | 177 | 206 | 334 | 128 | 106 | 50 | 38 | 0 |
| 2008 | 1 026 | 73 | 141 | 121 | 103 | 146 | 258 | 72 | 62 | 24 | 26 | 0 |
| 2009 | 1 555 | 122 | 213 | 190 | 170 | 170 | 419 | 109 | 67 | 55 | 40 | 0 |
| 2010 | 1 453 | 124 | 215 | 202 | 170 | 129 | 377 | 86 | 68 | 37 | 45 | 0 |
| 2011 | 1469 | 129 | 211 | 159 | 154 | 139 | 384 | 104 | 77 | 49 | 63 | 0 |
Source:KAS, Vital Statistics
Cities
Based on estimation of Kosovo Agency of Statistics done in late 2011 and published in 2012 the total population of Kosovo is 1,794,303. With the current estimation on population, Kosovo ranks as the 150th largest country in the world based on how populous it is.[8] Some of the largest municipalities by population in Kosovo are Pristina, Prizren, Ferizaj, Peje, Gjakove, Gjilan and Mitrovica. (ask (2011)). Pristine being the capital city of Kosovo and in the mean time ranked as the largest one is also the city where the commuting phenomenon is present the most.[9] Pristine had a 34% (about 56,000 commuter) increase in population when commuters were added. Pristina commuters come mainly from neighboring municipalities like Podujeve, Fushe Kosovo and other municipalities which are further contribute with 30% on commuting.[10] Reasons of these movements can be because of education purposes where about 1/3 of commuters make the youth at 16 – 22 years old and also for purposes of work.The highest number of commuters however is at age 19-20.[11]
| Rank | Municipalities | Popullation (2011) | Rank | Municipalities | Popullation (2011) |
| 1 | Pristinë/Pristina | 198,897 | 18 | Istog | 39,289 |
| 2 | Prizren | 177,781 | 19 | Klinë | 38,496 |
| 3 | Ferizaj/Uroševac | 108,610 | 20 | Kamenicë | 36,085 |
| 4 | Pejë/Peć | 96,450 | 21 | Fushë Kosovë | 34,827 |
| 5 | Gjakovë/Đakovica | 94,556 | 22 | Dragash | 33,997 |
| 6 | Gjilan/Gnjilane | 90,178 | 23 | Kaçanik | 33,409 |
| 7 | Podujevë/Podujevo | 88,499 | 24 | Shtime | 27,324 |
| 8 | Mitrovicë/Mitrovica | 71,909 | 25 | Obiliq | 21,549 |
| 9 | Vushtrri/Vučitrn | 69,870 | 26 | Graçanicë | 10,675 |
| 10 | Suharekë/Suva Reka | 59,722 | 27 | Hani i Elezit | 9,403 |
| 11 | Gllogoc/Glogovac | 58,531 | 28 | Shtërpcë | 6,949 |
| 12 | Lipjan | 57,605 | 29 | Novobërdë | 6,729 |
| 13 | Rahovec/Orahovac | 56,208 | 30 | Junik | 6,084 |
| 14 | Malishevë/Mališevo | 54,613 | 31 | Mamushë | 5,507 |
| 15 | Skenderaj/Srbica | 50,858 | 32 | Ranillug | 3,866 |
| 16 | Viti/Vitina | 46,987 | 33 | Kllokot | 2,556 |
| 17 | Deçan/Dečani | 40,019 | 34 | Partesh | 1,787 |
| ask(2011)[1] | |||||
Ethnic groups
The official results of the censuses in Kosovo after World War II are tabulated below. The proportion of Albanians was below 70% until 1961, but increased to 81.6% in 1991. The figures for Albanians in the 1991 census were estimates only, since that census was boycotted by most Albanians. Similarly, the figures for Serbs in the 2011 census omit those in North Kosovska Mitrovica, Leposavić, Zubin Potok, and Zvečan. The 2011 census also disambiguated the group formerly described as Muslims into Bosniaks and Gorani and the group formerly known as Romani into separate groups of Roma, Ashkali, and Egyptians. For easy comparison, the table follows the older ethnic divisions.
Population of Kosovo according to ethnic group 1948-2011| Ethnic group |
census 1948 | census 1953 | census 1961 | census 1971 | census 1981 | census 1991 | census 2011 | |||||||
|---|---|---|---|---|---|---|---|---|---|---|---|---|---|---|
| Number | % | Number | % | Number | % | Number | % | Number | % | Number | % | Number | % | |
| Albanians | 498,244 | 68.5 | 524,559 | 64.9 | 646,605 | 67.1 | 916,168 | 73.7 | 1,226,736 | 77.4 | 1,596,072 | 81.6 | 1,616,869 | 92.9 |
| Serbs | 171,911 | 23.6 | 189,869 | 23.5 | 227,016 | 23.5 | 228,264 | 18.4 | 209,498 | 13.2 | 194,190 | 9.9 | 25,532 | 1.5 |
| Muslims | 9,679 | 1.3 | 6,241 | 0.8 | 8,026 | 0.8 | 26,357 | 2.1 | 58,562 | 3.7 | 66,189 | 3.4 | ||
| Bosniaks | 27,533 | 1.6 | ||||||||||||
| Gorani | 10,265 | 0.6 | ||||||||||||
| Montenegrins | 28,050 | 3.9 | 31,343 | 3.9 | 37,588 | 3.9 | 31,555 | 2.5 | 27,028 | 1.7 | 20,365 | 1.1 | ||
| Croats | 5,290 | 0.7 | 6,201 | 0.8 | 7,251 | 0.8 | 8,264 | 0.7 | 8,718 | 0.6 | 8,062 | 0.4 | ||
| Yugoslavs | 5,206 | 0.5 | 920 | 0.1 | 2,676 | 0.2 | 3,457 | 0.2 | ||||||
| Romani | 11,230 | 1.5 | 11,904 | 1.5 | 3,202 | 0.3 | 14.593 | 1.2 | 34,126 | 2.2 | 45,760 | 2.3 | 8,824 | 0,5 |
| Ashkali | 15,436 | 0.9 | ||||||||||||
| Egyptians | 11,524 | 0.6 | ||||||||||||
| Turks | 1,315 | 0.2 | 34,583 | 4.3 | 25,764 | 2.7 | 12,244 | 1.0 | 12,513 | 0.8 | 10,445 | 0.5 | 18,738 | 1.1 |
| Macedonians | 526 | 0.1 | 972 | 0.1 | 1,142 | 0.1 | 1,048 | 0.1 | 1,056 | 0.1 | ||||
| Others or unspecified | 1,577 | 0.2 | 2,469 | 0.3 | 2,188 | 0.2 | 4,280 | 0.3 | 3,454 | 0.2 | 11,656 | 0.6 | 3,264 | 0.6 |
| Total | 727,820 | 808,141 | 963,988 | 1,243,693 | 1,584,441 | 1,956,196 | 1,739,825 | |||||||
- Breakdown of the municipalities based on ethnic groups
The results of the census 2011 of ethnic groups in municipalities are tabulated below.[12]
| Municipality | Not in disposal | Albanians | Serbs | Turkish | Bosniak | Roma | Ashkali | Egyptian | Goran | Other | Prefer not to answer | Total |
| Dečan | 64 | 39,402 | 3 | 0 | 60 | 33 | 42 | 393 | 1 | 19 | 2 | 40,019 |
| Đakovica | 134 | 87,672 | 17 | 16 | 73 | 738 | 613 | 5,177 | 13 | 92 | 71 | 94,556 |
| Glogovac | 38 | 58,445 | 2 | 5 | 14 | 0 | 0 | 3 | 0 | 22 | 3 | 58,531 |
| Gnjilane | 65 | 87,814 | 624 | 978 | 121 | 361 | 15 | 1 | 69 | 95 | 35 | 90,178 |
| Dragaš | 22 | 20,287 | 7 | 202 | 4,100 | 3 | 4 | 3 | 8,957 | 283 | 129 | 33,997 |
| Istok | 31 | 36,154 | 194 | 10 | 1,142 | 39 | 111 | 1,544 | 0 | 45 | 19 | 39,289 |
| Kačanik | 11 | 33,362 | 1 | 2 | 20 | 5 | 1 | 0 | 0 | 7 | 0 | 33,409 |
| Klina | 32 | 37,216 | 98 | 3 | 20 | 78 | 85 | 934 | 0 | 23 | 7 | 38,496 |
| Kosovo Polje | 32 | 30,275 | 321 | 62 | 34 | 436 | 3,230 | 282 | 15 | 131 | 9 | 34,827 |
| Kosovska Kamenica | 31 | 34,186 | 1,554 | 5 | 9 | 240 | 0 | 0 | 29 | 27 | 4 | 36,085 |
| Kosovska Mitrovica | 152 | 69,497 | 14 | 518 | 416 | 528 | 647 | 6 | 23 | 47 | 61 | 71,909 |
| Leposavić | - | - | - | - | - | - | - | - | - | - | - | - |
| Lipljan | 27 | 54,467 | 513 | 128 | 42 | 342 | 1,812 | 4 | 6 | 260 | 4 | 57,605 |
| Novo Brdo | 3 | 3,524 | 3,122 | 7 | 5 | 63 | 3 | 0 | 0 | 2 | 0 | 6,729 |
| Obilić | 12 | 19,854 | 276 | 2 | 58 | 661 | 578 | 27 | 5 | 48 | 28 | 21,549 |
| Orahovac | 83 | 55,166 | 134 | 2 | 10 | 84 | 404 | 299 | 0 | 11 | 15 | 56.208 |
| Peć | 79 | 87,975 | 332 | 59 | 3,786 | 993 | 143 | 2,700 | 189 | 132 | 62 | 96,450 |
| Podujevo | 120 | 87,523 | 12 | 5 | 33 | 74 | 680 | 2 | 0 | 43 | 7 | 88,499 |
| Pristina | 220 | 194,452 | 430 | 2,156 | 400 | 56 | 557 | 8 | 205 | 334 | 79 | 198,897 |
| Prizren | 159 | 145,718 | 237 | 9,091 | 16,869 | 2,899 | 1,350 | 168 | 655 | 386 | 222 | 177,781 |
| Srbica | 60 | 50,685 | 50 | 1 | 42 | 0 | 10 | 1 | 0 | 5 | 4 | 50,858 |
| Štimlje | 19 | 26,447 | 49 | 1 | 20 | 23 | 750 | 0 | 2 | 13 | 0 | 27,324 |
| Štrpce | 6 | 3,757 | 3,148 | 0 | 2 | 24 | 1 | 0 | 0 | 7 | 4 | 6,949 |
| Suva Reka | 49 | 59,076 | 2 | 4 | 15 | 41 | 493 | 5 | 0 | 15 | 22 | 58,722 |
| Uroševac | 220 | 104,152 | 32 | 55 | 83 | 204 | 3,629 | 24 | 64 | 102 | 45 | 108,610 |
| Vitina | 48 | 46,669 | 113 | 4 | 25 | 12 | 14 | 0 | 7 | 83 | 12 | 46,987 |
| Vučitrn | 53 | 68,840 | 384 | 278 | 33 | 68 | 143 | 1 | 3 | 50 | 17 | 69,870 |
| Zubin Potok | - | - | - | - | - | - | - | - | - | - | - | - |
| Zvečan | - | - | - | - | - | - | - | - | - | - | - | - |
| Mališevo | 36 | 54,501 | 0 | 0 | 15 | 26 | 5 | 0 | 0 | 8 | 22 | 54,613 |
| Junik | 9 | 6,069 | 0 | 0 | 0 | 0 | 0 | 0 | 0 | 4 | 2 | 6,084 |
| Mamuša | 0 | 327 | 0 | 5,182 | 1 | 39 | 12 | 0 | 0 | 0 | 0 | 5,507 |
| Đeneral Janković | 1 | 9,357 | 0 | 0 | 42 | 0 | 0 | 0 | 0 | 2 | 1 | 9,403 |
| Gračanica | 17 | 2,474 | 7,209 | 15 | 15 | 745 | 104 | 3 | 3 | 45 | 26 | 10,675 |
| Ranilug | 6 | 164 | 3,692 | 0 | 1 | 0 | 0 | 0 | 0 | 3 | 0 | 3,866 |
| Parteš | 0 | 0 | 1,785 | 0 | 0 | 0 | 0 | 0 | 0 | 2 | 0 | 1,787 |
| Klokot | 1 | 1,362 | 1,777 | 1 | 0 | 9 | 0 | 0 | 0 | 6 | 0 | 2,556 |
| Total | 1,840 | 1,616,869 | 25,532 | 18,738 | 27,533 | 8,824 | 15,436 | 11,524 | 10,265 | 2,365 | 912 | 1,739,825 |

The 2000 Living Standard Measurement Survey by Statistical Office of Kosovo found an ethnic composition of the population as follows:
- 92% Albanians
- 8% others
A most comprehensive (October 2002) estimate (for the 1.9 million inhabitants) for these years:
During the Kosovo War in 1999, over 700,000 ethnic Albanians,[13] around 100,000 ethnic Serbs and more than 40,000 Bosniaks were forced out of the province to neighbouring Albania, Macedonia, Montenegro, Bosnia and Serbia. After the United Nations took over administration of Kosovo following the war, the vast majority of the Albanian refugees returned.[citation needed] The largest diaspora communities of Kosovo Albanians are in Germany and Switzerland accounting for some 200,000 individuals each, or for 20% of the population resident in Kosovo.
Many non-Albanians - chiefly Serbs and Roma - fled or were expelled, mostly to the rest of Serbia at the end of the war, with further refugee outflows occurring as the result of sporadic ethnic violence. The number of registered refugees is around 250,000.[14][unreliable source?][15][16] The non-Albanian population in Kosovo is now about half of its pre-war total[citation needed]. The largest concentration of Serbs in the province is in the north, but many remain in Kosovo Serb enclaves surrounded by Albanian-populated areas.
The Third Demographic, Social and Reproductive Health Survey in Kosovo
- Demographic and Socioeconomic Findings
Nearly two-thirds (63.2%) live in rural areas. The overwhelming majority (94.7%) of respondents are of the Muslim religion, with Orthodox (3.9%) being the majority of the remainder [17] The vast majority (92.4%) of the surveyed population belongs to the Albanian ethnicity, 3.9% are Serbian, and 1.1% are Bosnian. The remaining 2.6% are distributed across other minorities. Ethnic distributions are virtually the same for females and males.
- Age, Sex, and Residency
Half of the total survey sample (50.1%) is male. Similar to the 2003 survey, distribution of population by sex is virtually the same in both urban and rural areas – 50.1% male and 49.9% female in urban areas and 50.2% male and 49.8% female in rural areas.
- School Attendance
As Table 2.6 displays, school participation rates are high, especially at ages 10–14, where they reach 98 percent of the people of these ages. The lower rate (80%) at ages 5–9 can be explained by the late starting age for some pupils, though it is noticeably higher than the 66 percent in the 2003 survey (see Figure 2.8). The school attendance rate for people aged 15–19 also increased between 2003 and 2009, from 63 percent to 77 percent. School attendance rates have also increased for other age groups.[18]
There are differences in the attendance rates between rural and urban residents as well as between males and females. Males and females in rural areas who are age 15 or older attend school at a lower rate than their urban counterparts. The school attendance gap between rural and urban residents progressively widens in relative amounts as age increases. The urban-rural gap at older ages probably reflects the scarcity of higher educational opportunities in rural areas. In both urban and rural areas, among those aged 5–14, females are slightly more likely to be enrolled in school than males, but at older age groups males are more likely to be in school than females.
- Literacy
Seven percent of people aged 15 years and above are unable to read and write in any language. Figure 2.10 shows clear differences between the sexes for all age groups, especially older ones, in both urban and rural areas, with females overall being more than two times as likely to be illiterate as males (7.5% versus 3.3% in urban areas, and 11.3% versus 5.5% in rural areas). Furthermore, illiteracy is highly correlated with age. The level of illiteracy is very low at ages between 15 and 34—less than 2 percent—and is particularly low (0.4%) among males of this age group. However, at older ages, the illiteracy rate increases considerably, with 22 percent of females and 9 percent of males aged 55–64 being illiterate, and 56 percent of females and 25 percent of males aged 65 and older not being able to read and write in any language.[19]
- Income
The total of all sources of household income; answers were recorded in the categories seen in Table 2.13. Table 2.13 shows the distribution of households across these income categories, for the total sample and separately for urban and rural areas. Figure 2.16 shows the urban and rural data graphically.[20]
63% of all households in the 2009 reported that they earned 300 Euros or less monthly, 17.5 percent earned 301 to 400, 14.0 percent earned 401 to 800, and 4.7% earned more than that. People in rural areas were more likely to have monthly incomes of 300 Euros or less (66.0%) than those urban areas (58.5%), while the proportion of households earning 400 Euros or more monthly is higher in urban areas (22.3% versus 16.0%)
- Crude Birth Rate
In 2009 there were a total of 9,896 births to female respondents age 15-49 at the time of the survey, of which 370 occurred in the 12 months before the survey. From this we can calculate the crude birth rate (CBR) for the 12 months before the survey.[21]
Health
- Group of diseases
The data in the table below are from the Kosovo Agency of Statistics.
| Structure of group of diseases according to ICD-10 recorded in PHC in 2010 | ' | ' |
| Group of diseases | No | Percentage |
| Parasitic diseases | 53762 | 28 |
| Tumors/cancers | 2943 | 1.5 |
| Blood and homopotetic organ disease and immunity disorders | 5091 | 2.6 |
| Endocrinic disorder of feeding and metabolism | 25212 | 13.1 |
| Psychic and personality disorder | 13488 | 7 |
| SQN diseases | 15490 | 8.1 |
| Eye diseases | 21320 | 11.1 |
| Ear and mastoid process diseases | 18989 | 9.9 |
| Diseases of blood circulation system | 5139 | 2.7 |
| Diseases of respiratory system | 6962 | 3.6 |
| Diseases of digestive system | 3192 | 1.7 |
| Dermic and hypodermic tissue diseases | 1453 | 0.8 |
| Diseases of locomotor system and connective tissue | 1775 | 0.9 |
| Disease of urogenital system | 2198 | 1.1 |
| Pregnancy, delivery and maternity | 5737 | 3 |
| Certain states resulting from perinatal periods | 200 | 0.1 |
| Inborn deformity, chromosomal deformities and anomalies | 248 | 0.1 |
| Symptoms, indications, analyses and clinical abnormal ascertainments | 1556 | 0.8 |
| Injuries, poisoning, and other consequences caused by external factors | 2871 | 1.5 |
| External factors of morbidity and mortality 579 0.3 | 579 | 0.3 |
| Factors influencing on health conditions and contact with health services | 3948 | 2.1 |
| Total | 192154 | |
- Knowledge and Attitudes About HIV/AIDS Prevention
According to available data and the classification system of the United Nations Programme on AIDS (UNAIDS), Kosovo is categorized within states with a low rate of HIV epidemic, with a rate of HIV infection of less than 1 percent among the general population and less than 5 percent among high-risk groups. Official reports from relevant Kosovo institutions show that only 74 cases with HIV/AIDS were reported between 1986 and 2008, of which 28 are now deceased.33 However, the current situation in Kosovo with respect to the HIV/AIDS epidemic remains rather uncertain, due to the underreporting and insufficiency of programs for HIV prevention among high-risk populations. Moreover, the level of risk behaviors among subpopulations with high risk for HIV infection is increasing.34 The 2009 KDHS included questions to assess knowledge and attitudes about HIV/AIDS from all respondents, both male and female, ages 15 and older. The 2003 KDHS asked some of the same questions, but only of females aged 15–49. Table 6.1 below shows the tabulations of the data on knowledge and attitudes about HIV/AIDS from the 2009 KDHS. Much of this information is shown graphically later in this section, sometimes for women aged 15–49, for comparison with data from the 2003 KDHS. Overall, the level of awareness about HIV/AIDS is high (Table 6.1). Of those ages 15 and older, nearly 90 percent of males and more than 80 percent of females have heard of HIV/AIDS.[23]
As with knowing about HIV/AIDS, the level of positive recognition of the role of condoms and abstinence in reducing the risk of HIV/AIDS infection increases with the level of education. For the more educated groups, as we have seen for the population as a whole and other subgroups, people are somewhat less likely to reply that abstinence can reduce the risk of HIV/AIDS than to reply that condom use can.[24]
Migration
- Lifetime Internal Migration
Table 7.1 shows the percentages of persons who moved into or out of each of the seven regions of Kosovo during their lifetimes; for each percentage for each region, the denominator is the number of people in the survey sample who were born in the region (including those no longer living in it but living elsewhere in Kosovo). The final column of the table shows net migration (in-migration less out-migration), making it possible to see which regions have gained or lost population from the process of lifetime internal migration. The table also shows the percentage of all respondents to the 2009 KDHS who were born abroad – 1.7 percent. Altogether, 6.4 percent of 2009 KDHS survey respondents are lifetime migrants (i.e., lived in a different region [or country] at the time of the 2009 KDHS from where they were born).
Pristina is the region with the highest in-migration. Nearly 11 percent of respondents now living in Pristina region stated that they were born in other regions of Kosovo (or abroad). However, around 3 percent of respondents born in Pristina region now live in a different region of Kosovo. On net, the population of Pristina region is 7.7 percent larger because of net internal lifetime migration. Peja region has the next highest rates of migration, with lifetime net inmigration of 6.7 percent. The regions of Gjakova and Mitrovica have suffered relatively large losses of lifetime migrants over the years, on net losing 6.4 percent and 5.2 percent, respectively, of the people born there (who are still alive and still in Kosovo) to net out-migration to other regions of Kosovo. This is not surprising given the very poor economic prospects in these two regions, as well as the political and security issues in Mitrovica.[25]
- Emigration
- [26]
Religion


Most of the Albanian population of Kosovo, together with the Bosniak, Gorani and Turkish communities, and some of the Roma/Ashkali/Egyptian community, have Muslim family backgrounds.[27] The results of the 2011 census gave the following religious affiliations for the population included in the census:[28]
Islamic: 1,663,412 (95.6%) Orthodox: 25,837 (1.4%) Catholic: 38,438 (2.2%) Other: 1,188 (0.1%) None: 1,242 (0.1%) No answer: 9,708 (0.6%)
These figures will underestimate the Orthodox percentage of the population because the areas not covered by the census have an overwhelming Serb majority.
Kosovo's constitutional status as a secular state has no significant opposition, and urban areas feel predominantly secular. During the 2000s, large investments in Kosovo were made by Middle Eastern charities, especially Saudi Arabian. There are concerns[by whom?] that these investments are made with the intention of fostering radical Islam in Kosovo.[29]
The Protestant community in Kosovo was established in the 1870s, and today the country has more than 28 Protestant Evangelical churches. Albanian Christians are much less common in Kosovo than in Albania. Very few Albanians in Kosovo are Albanian Orthodox.
The Serb population, estimated before the 2011 census at 100,000 to 150,000 persons, is largely Serbian Orthodox. The Catholic Albanian communities are mostly concentrated in Đakovica, Prizren and Peć and a few villages near Uroševac and Klina. w[citation needed] There is a revival of Christianity (especially Catholicism) among Kosovo's Albanians recently.[30]
2011 Census
The final results of the 2011 census recorded Kosovo excluding North Kosovo as having 1,739,825 inhabitants.[31] This was below most previous estimates. The census enjoyed considerable technical assistance from international agencies and appears to have been endorsed by Eurostat; it was, however, the first full census since 1981, and not one of an uninterrupted series. The results show that there were no people temporarily resident in hotels or refugee camps at the time of the census;[32] that out of 312,711 conventional dwellings, 99,808 (over 30%) were unoccupied;[33] and that three municipalities designed under the Ahtisaari Plan - Klokot, Novo Brdo, and Štrpce to have Serb majorities in fact had ethnic Albanian majorities (although their municipal assemblies have Serb majorities).[34]
History
Archeological findings show that Bronze and Iron Age tombs were found only in Metohija, not in Kosovo proper.[35][unreliable source?]
The region was inhabited by Illyrians, Celts[36][37] and Thracians.[37][38] After Roman conquest of Illyria at 168 BC, Romans colonized and founded several cities in the region.[39]
Slavs are mentioned in the area since the 520s AD, with the Slav tribe of Sklavenoi settling the Praetorian prefecture of Illyricum, the mythological founders of the Serbs were the White Serbs; "who settled in the Balkans during the rule of Emperor Heraclius" (610-641).[40] In the 12th century, according to Anna Komnena, the Serbs were the main inhabitants of Kosovo (Eastern Dalmatia and former Moesia Superior).[41] Archeological findings from the 7th century onwards show a Serb (Slavic) cultural domination in case of glagolithic letters, pottery, cemeteries, churches and monasteries.[42][verification needed]
In 1054 the Great Schism occurred in the realm, the Byzantine Empire (Roman) was divided on religious basis and Kosovo & Metohija was part of the Orthodox world (Subsequently the base of the Serbian Orthodox Church).
14th century
1321-1331
The Dečani charters (Serbian: Дечанске хрисовуље) from 1321-1331 by Stephen Uroš III Dečanski of Serbia contains a detailed list of households and villages in Metohija and northwestern Albania. The first charter concludes that this region was ethnically Serb.[43]
89 settlements with 2,666 households were recorded of which:[44]
- 3 Albanian settlements (3,3%)
- 86 Serbian settlements (96,6%)
2,166 livestock households of 2,666 agricultural households:
- 44 Albanian households (2%)
- 2,122 Serbian households (98%)
15th century
The ethnic composition of Kosovo's population during this period included Serbs, Albanians, and Vlachs along with a token number of Greeks, Armenians, Saxons, and Bulgarians, according to Serbian monastic charters or chrysobulls (Hrisovulja). A majority of the given names in the charters are overwhelmingly Serbian (Of 24,795 names, 23,774 were ethnic Serb names, 470 of Roman origin, 65 of Albanian origin and 61 of Greek origin).
The essentially Serbian composition of medieval Kosovo's population is corroborated by Ottoman defters, showing that Serbs were majority until the 17th century.
1455
1455: Turkish cadastral tax census (defter)[45] of the Branković District (covering most of present-day Kosovo) recorded:
- 480 villages,
- 13,693 adult males,
- 12,985 dwellings,
- 14,087 household heads (480 widows and 13,607 adult males).
Totally there were around 75,000 inhabitants in 590 villages comprising modern-day Kosovo.
Turkish defter did not give any data on ethnicity. However, Yugoslav and Serbian sholars have researched ethnic structure of Kosovo population. According to them there were:[46]
- 13,000 Serb dwellings present in all 480 villages and towns
- 75 Vlach dwellings in 34 villages
- 46 Albanian dwellings in 23 villages
- 17 Bulgarian dwellings in 10 villages
- 5 Greek dwellings in Lauša, Vučitrn
- 1 Jewish dwelling in Vučitrn
- 1 Croat dwelling
1487
1487 defter recorded:
- Vučitrn district:
- Ipek (Peć) district:
- City of Ipek
- 121 Christian households
- 33 Muslim households
- 131 Christian households of which 52% in Suho Grlo were Serbs
- Donja Klina - 50% Serbs
- Dečani - 64% Serbs
- Rural areas:
- 6,124 Christian households (99%)
- 55 Moslem households (1%)
16th century
1520-1535
- Vučitrn: 19,614 households
- Christians
- 700 Muslim households (3,5%)
- Prizren
- Christians
- 359 Muslim households (2%)
1582
Ottoman defter of the Shkodra Sandjak (Defter-i Mufassal Liva-i Iskenderiye. № 416 (59))[47]
- Peć nahiya:
- 235 villages of which some 30 have Albanian families besides the majorital Orthodox Serbs.
- City of Peć - 18 mahalas; 3 free, 13 Muslim (newly Islamicised), 5 Serbian (2 houses were Albanian)
- Village Osek - Muslim (Islamicised) majority, with some settled Christian Albanians
- Village Selojani - Muslim majority, small Christian Albanian and Serb population
- Village Mramor - 22 houses. Albanian majority
- Village Belovci - 50 Serbian houses.
- Village Granica - 65 Serbian houses.
- Village Belo Polje - 2 Serbian mahalas. 3 priests.
- Village Bukovica - Serbian. 2 converts to Islam.
- Village Lipovac - Islamicised Albanian.
- Village Trakakin - Albanian. Islamicised majority.
- Village Baba - Serbian. 1 convert to Islam.
- Village Videš - Serbian.
- Village Veliki Đurđevik - 64 Serbian houses. 2 families from Prizren and Vučitrn.
- 17 Serb villages: 1 Albanian house.
- Village Suho Grlo - 3 Serbian mahalas. 1 Islamicised Serb.
- 3 Serb villages
- 17 Serb villages: 3 Muslim houses. 8 priests.
- Village Zlokućani - Serbian. 5 Muslim houses.
- Village Kavlica - Serbian. 8 Muslim houses.
- Village Strelice - 70 Serbian houses. few Islamicised.
- 8 Serb villages
- Village Rusance - Albanian majority. 3 Muslims.
- Village Muževine - Serbian. 1 priest.
- Village Srednja Crnja - 8 Albanian Muslim houses.
- 34 Serb villages: total 2 Albanian houses in 2 villages.
- Village Njivokos - Serbian majority. Notable Islamicisation.
- Village Vrela Manastir - Serbian.
- 13 Serb villages: 1 Islamicised house.
- Village Gusnica - 20 Albanian Islamicised houses.
- 15 Serb villages: Islamicisation occurred in 3 villages.
- Village Vinodol - Serbian. 8 soldier houses from Bosnian Sandzak.
- Village (?) - Serbs, Albanians and Muslims.
- 20 Serb villages: occurrence of Islamicisation.
- 2 Albanian villages: Islamicised.
- 39 Serb villages: 9 monasteries (one is Dečani). 1 Albanian male.
- Village Brestovac - 10 Albanian houses.
- Village Belica - 35 Muslim houses.
- 56 villages: 42 Serb villages of which 14 with a Muslim minority.
- Village Novosel - Muslim and Albanian.
- Village Labranima - Serbian majority. 2 Muslim houses.
- Village Dubak - 10 Albanian houses and 9 Muslim houses.
- Village Dobroševo - 28 houses. Albanian majority. 3 Muslim houses.
- Village Šankovac - Serbian majority. 3 Muslim houses.
- Village Dobrič-Dol - Muslim.
- Village Gornji Petrič - Serbian majority. ~50 Serbian houses, 3 Muslim houses.
- Village Vranić - Muslim and Albanian.
- Village Crni Potok - 25 Muslim houses.
- Village Arženik - Serbian. Few Muslim houses.
- Village Prelopci - Serbs, Albanians and Muslims.
- Village Rugovo - 86 Serbian houses.
- Altun-li nahiya:
- 41 villages - Serb majority, Albanian minority.
1591
Ottoman defter from 1591:[48]
17th - 18th centuries
The Great Turkish War of 1683–1699 between the Ottomans and the Habsburgs led to the flight of a substantial numbers of Serbs and Albanians who had sided with the Austrians, from within and outside Kosovo, to Austrian held Vojvodina and the Military Frontier - Patriarch Arsenije III, one of the refugees, referred to 30,000 or 40,000 souls, but a much later monastic source referred to 37,000 families. Serbian historians have used this second source to talk of a Great Migration of Serbs. Wars in 1717-1738 led to a second exodus of refugees (both Serbian and Albanian) from inside and outside Kosovo, together with reprisals and the enslavement and deportation of a number of Serbs and Albanians by the victorious Ottomans.[49]
19th century

19th century data about the population of Kosovo tend to be rather conflicting, giving sometimes numerical superiority to the Serbs and sometimes to the Albanians. The Ottoman statistics are regarded as unreliable, as the empire counted its citizens by religion rather than nationality, using birth records rather than surveys of individuals.
A study in 1838 by an Austrian physician, dr. Joseph Müller found Metohija to be mostly Slavic (Serbian) in character.[50] Müller gives data for the three counties (Bezirke) of Prizren, Peć and Đakovica which roughly covered Metohija, the portion adjacent to Albania and most affected by Albanian settlers. Out of 195,000 inhabitants in this region, Müller found:
- 114,000 Muslims (58%):
- Christians:
- 73,572 Eastern Orthodox Serbs (38%)
- 5,120 Roman Catholic Albanians (3%)
- 2,308 other non-Muslims (Janjevci etc.)
Müller's observations on towns:
- Peć: 11,050 Serbs, 500 Albanians
- Prizren: 16,800 Serbs, 6150 Albanians
- Đakovica: majority of Albanians, surrounding villages Serbian
Map published by French ethnographer G. Lejean[51] in 1861 shows that Albanians lived on around 57% of the territory of today's province while a similar map, published by British travellers G. M. Mackenzie and A. P. Irby[51] in 1867 shows slightly less; these maps don't show which population was larger overall. Nevethless, maps cannot be used to measure population as they leave out density.
A study done in 1871 by Austrian colonel Peter Kukulj[52] for the internal use of the Austro-Hungarian army showed that the mutesarifluk of Prizren (corresponding largely to present-day Kosovo) had some 500,000 inhabitants, of which:
- 318,000 Serbs (64%),
- 161,000 Albanians (32%),
- 10,000 Roma (Gypsies) and Circassians
- 2,000 Turks

Modern Serbian sources estimated that around 400,000[53] Serbs were cleansed out of the Vilayet of Kosovo between 1876 and 1912, especially during the Greek-Ottoman War in 1897.[54][unreliable source?]
Maps published by German historian Kiepert[51] in 1876, J. Hahn[51] and Austrian consul K. Sax,[51] show that Albanians live on most of the territory of today's province, however they don't show which population is larger. According to these, the regions of Kosovska Mitrovica and Kosovo Polje were settled mostly by Serbs, whereas most of the terrirory of western and eastern parts of today's province was settled by Muslim Albanians.
An Austrian statistics[55] published in 1899 estimated:
At the end of the 19th century, Spiridon Gopchevich, an Austrian traveller - comprised a statistics and published them in Vienna. They established that Prizren had 60,000 citizens of whome 11,000 were Christian Serbs and 36,000 Muslem Serbs. The remaining population were Turks, Albanians, Tzintzars and Roma. For Peć he said that it had 2,530 households of which 1,600 were Mohammedan, 700 Christian Serb, 200 Catholic Albanian and 10 Turkish.
Note: Descendants of Muslim Serbs mentioned by travelers today mostly self-declare as Muslims by nationality, Bosniaks or Gorani. Also note that territory of Ottoman Kosovo Vilayet was quite different than modern-day Kosovo.
20th century

British journalist H. Brailsford estimated in 1906[56] that two-thirds of the population of Kosovo was Albanian and one-third Serbian. The most populous western districts of Đakovica and Peć were said to have between 20,000 and 25,000 Albanian households, as against some 5,000 Serbian ones. A map of Alfred Stead,[57] published in 1909, shows that similar numbers of Serbs and Albanians were living in the territory.
German scholar Gustav Weigand gave the following statistical data about the population of Kosovo,[58] based on the pre-war situation in Kosovo in 1912:
- Pristina District: 67% Albanians, 30% Serbs
- Prizren District: 63% Albanians, 36% Serbs
- Vučitrn District: 90% Albanians, 10% Serbs
- Uroševac District: 70% Albanians, 30% Serbs
- Gnjilane District: 75% Albanians, 23% Serbs
- Mitrovica District: 60% Serbs, 40% Albanians
Metohija with the town of Đakovica is furthermore defined as almost exclusively Albanian by Weigand.[58] Citing Serbian sources, Noel Malcolm also states that in 1912 when Kosovo came under Serbian control, "the Orthodox Serb population at less than 25%,[5]"
Balkan Wars and World War I-World War II


- The 1921 Kingdom of Serbs, Croats and Slovenes population census for the territories comprising modern day Kosovo listed 439,010 inhabitants:
- By religion:
- Muslims: 329,502 (75.1%)
- Orthodox Serb: 93,203 (21.2%)
- Roman Catholics: 15,785 (3.6%)
- Jews: 427
- Greek Catholics: 26
- By native language:
- Albanian: 288,907 (65.8%)
- Serbian or Croatian: 114,095 (26.0%)
- Turkish: 27,915 (6.4%)
- Romanian-Cincarian: 402
- Slovene: 184
- German: 30
- Hungarian: 12
- According to the 1931 Kingdom of Yugoslavia population census, there were 552,064 inhabitants in today's Kosovo.
- By religion:
- Muslims: 379,981 (68.83%)
- Orthodox Serbs: 150,745 (27.31%)
- Roman Catholics: 20,568 (3.73%)
- Evangelists: 114 (0.02%)
- other: 656 (0.12%)
- By native language:
- Albanians: 331,549 (60.06%)
- Serbs, Croats, Slovenes and Macedonians: 180,170 (32.64%)
- Hungarians: 426 (0.08%)
- Germans: 241 (0.04%)
- other Slavs: 771 (0.14%)
- other: 38,907 (7.05%)
World War II
Most of the territory of today's province was occupied by Italian-controlled Greater Albania, massacres of some 10,000[59][60] Serbs, ethnic cleansing of about 100[59] to 250,000[59][61] or more[60][unreliable source?] occurred.
Nazi Germany estimated that from November 1943 to February 1944, 40 000 Serbs fled Italian-occupied Kosovo for Montenegro and Serbia.
1948 census
727,820 total inhabitants:
- 498,242 Albanians (68.46%)
- 171,911 Serbs (23.62%)
- 28,050 Montenegrins (3.86%)
- 11,230 Roma (1.54%)
- 5,290 Croats (0.73%)
- 1,315 Turks (0.18%)
- 526 Macedonians (0.07%)
- 362 Russians (0.05%)
- 283 Slovenes (0.04%)
- 197 Germans (0.03%)
- 83 Hungarians (0.01%)
- 77 Bulgarians (0.01%)
- 39 Italians
- 31 Rusyns
- 29 Czechs
- 18 Romanians
- 2 Slovaks
- 9,679 undecided Muslims (1.33%)
- 456 other and unknown (0.06%)
1953 census
808,141 total inhabitants
- 524,559 Albanians (64.91%)
- 189,969 Serbs (23.51%)
- 34,583 Turks (4.28%)
- 31,343 Montenegrins (3.88%)
- 6,201 Croat (0.77%)
- 972 Macedonians (0.12%)
- 411 Slovenes (0.05%)
- 6,241 undecided Yugoslav (0.77%)
- 401 other Slav (0.05%)
- 13,561 others (1.68%)
1961 census
963,959 total inhabitants
- 646,604 Albanians (67.08%)
- 227,016 Serbs (23.55%)
- 37,588 Montenegrins (3.9%)
- 8,026 Ethnic Muslims (0.83%)
- 7,251 Croat (0.75%)
- 5,203 Yugoslavs (0.54%)
- 3,202 Romani (0.33%)
- 1,142 Macedonians (0.12%)
- 510 Slovenes (0.05%)
- 210 Hungarians (0.02%)
-
 Ethnic structure of Kosovo and Metohija by settlements 1961.
 -
 Ethnic structure of Kosovo and Metohija by settlements 1961.
 -
 Ethnic structure of Kosovo and Metohija by settlements 1961.
 -
 Ethnic structure of Kosovo and Metohija by settlements 1961.
 -
 Distribution of Albanians on Kosovo and Metohija by settlements 1961.
 -
 Distribution of Serbs on Kosovo and Metohija by settlements 1961.
 -
 Distribution of Serbs on Kosovo and Metohija by settlements 1961.
 -
 Distribution of Montenegrins on Kosovo and Metohija by settlements 1961.
 -
 Distribution of Croats on Kosovo and Metohija by settlements 1961.


After 1961, 103,000 Serbs and Montenegrins left Kosovo, mainly due to alleged mistreatment by Albanian authorities and population.[62][unreliable source?]
After the province gained autonomy, the local provincial Statistical office given authority over the Census, whereas the rest of the country's Census was under the leadership of the Federal Statistical Commission. There were allegations of 'Census rigging' (for the 1971 and 1981 censuses) by Turkish, Muslim and Romani minorities who claim forceful Albanization[citation needed]. The Serbians claimed that the Albanians had drastically overinflated their prevalence within Kosovo. It was felt that this could not be substantiated though because the Kosovo Statistical offices were under the control of the majority Albanian population - this was against the national norm at the time, which dictated that census takers had to be of different nationalities
1971 census
1,243,693 total inhabitants[citation needed]
- 916,168 Albanians or 73.7%[61]
- 228,264 Serbs (18.4%)
- 31,555 Montenegrins (2.5%)
- 26,000 Slavic Muslims (2.1%)
- 14,593 Roma (1.2%)
- 12,244 Turks (1.0%)
- 8,000 Croats (0.7%)
- 920 Yugoslavs (0.1%)
-
 Ethnic structure of Kosovo and Metohija by settlements 1971.
 -
 Ethnic structure of Kosovo and Metohija by settlements 1971.
 -
 Ethnic structure of Kosovo and Metohija by settlements 1971.
 -
 Distribution of Albanians on Kosovo and Metohija by settlements 1971.
 -
 Distribution of Albanians on Kosovo and Metohija by settlements 1971.
 -
 Distribution of Serbs on Kosovo and Metohija by settlements 1971.
 -
 Distribution of Montenegrins on Kosovo and Metohija by settlements 1971.
 -
 Distribution of Muslims on Kosovo and Metohija by settlements 1971.


1981 census
1,584,558 total inhabitants
- 1,226,736 Albanians (77.42%)
- 209,498 Serbs (13.2%)
- 27,028 Montenegrins (1.7%)
- 2,676 Yugoslavs (0.2%)
-
 Ethnic structure of Kosovo and Metohija by settlements 1981.
 -
 Ethnic structure of Kosovo and Metohija by settlements 1981.
 -
 Ethnic structure of Kosovo and Metohija by settlements 1981.
 -
 Distribution of Albanians on Kosovo and Metohija by settlements 1981.
 -
 Distribution of Albanians on Kosovo and Metohija by settlements 1981.
 -
 Distribution of Serbs on Kosovo and Metohija by settlements 1981.
 -
 Distribution of Muslims on Kosovo and Metohija by settlements 1981.
 -
 Distribution of Montenegrins on Kosovo and Metohija by settlements 1981.
 -
 Distribution of Roma on Kosovo and Metohija by settlements 1981.
 -
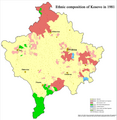 Ethnic composition of Kosovo in 1981 with Serb enclaves shown as in 2011


1991 census
Official Yugoslav statistical results, almost all Albanians and some Roma, Muslims boycott the census following a call by Ibrahim Rugova to boycott Serbian institutions.
359,346 total population
- 194,190 Serbs (10%)[63]
- 20,356 Montenegrins (1%)
- 9,091 Albanians (most boycotted)
- 66,189 Muslims
- 45,75 Romas
- 10,446 Turks
- 8,062 Croats (Janjevci, Letnicani)
- 3,457 Yugoslavs
-
 Ethnic structure of Kosovo and Metohija by settlement 1991.
 -
 Religious structure of Kosovo and Metohija by settlement 1991.


Official Yugoslav statistical corrections and projections, with the help of previous census results (1948–1981):
1,956,196 Total population
- 1,596,072 Albanians (81.6%)
- 194,190 Serbs (9.9%)
- 66,189 Muslims (3.4%)
- 45,760 Romas (2.34%)
- 20,365 Montenegrins (1.04%)
- 10,445 Turks (0.53%)
- 8,062 Croats (Janjevci) (0.41)
- 3,457 Yugoslavs (0.18%)
- 11,656 others (0.6%)
-
 Ethnic structure of Kosovo and Metohija by settlements 1991.
 -
 Distribution of Roma in Kosovo and Metohija by settlements 1991.
 -
 Ethnic map of Kosovo, 1991 data


.png)
The corrections should not taken to be fully accurate. The number of Albanians is sometimes regarded as being an underestimate. On the other hand, it is sometimes regarded as an overestimate, being derived from earlier censa which are believed to be overestimates. The Statistical Office of Kosovo states that the quality of the 1991 census is "questionable." [6].
In September 1993, the Bosniak parliament returned their historical name Bosniaks. Some Kosovar Muslims have started using this term to refer to themselves since.
1995 estimate
In the year of 1995, Official Yugoslav statistical results,[citation needed]. There was a total of around 1,600,000 inhabitants in Kosovo (and a further 600,000 living abroad):
1998 Federal Secretariat of Information
In 1998 the Federal Secretariat of Information in Belgrade issued a population estimate [citation needed] for the Autonomous Province of Kosovo and Metohija listing around 1,378,980 citizens:
- 917,000 Albanians
- 221,000 Serbs
- 97,000 Romas
- 72,500 Muslims
- 23,000 Montenegrins
- 21,000 Turks
- 3,500 Yugoslavs
- 980 Macedonians
- 23,000 others
Kosovo War refugees
The total list of countries in which the refugees took refuge and in what numbers:[citation needed]
- Montenegro - 61,900
- Serbia - 180,000
abroad:
- Albania - 405,000
- Republic of Macedonia - 197,000
- Bosnia and Herzegovina - 17,000
other countries in which Kosovars took refuge:
- Germany - 9,974
- Turkey - 6,259
- Norway - 2,476
- France - 2,354
- Austria - 1,455
- Belgium - 1,205
- United Kingdom - 330
CIA World Factbook demographic statistics
Age structure
- 0–14 years: 27.7% (male 260,678/female 239,779)
- 15–64 years: 65.7% (male 617,890/female 567,939)
- 65 years and over: 6.6% (male 50,463/female 68,089) (2010 est.)
Sex ratio
- at birth: 1.086 male(s)/female
- under 15 years: 1.09 male(s)/female
- 15–64 years: 1.09 male(s)/female
- 65 years and over: 0.74 male(s)/female
- total population: 1.06 male(s)/female (2010 est.)
See also
- Demographics of Serbia
- Albanians in Kosovo
- Bosniaks in Kosovo
- Montenegrins of Kosovo
- Serbs in Kosovo
- Turks in Kosovo
- Roma in Kosovo
- Gorani (ethnic group)
- Janjevci
- Ashkali
References
- ^ Final Results of the 2011 Kosovo census
- ^ People's Daily: Belgrade to Reject Results of U.N.-Conducted Census in Kosovo
- ^ Living Standard Measurement Survey 2000, Statistical Office of Kosovo - see also Kosovo and its Population
- ^ Statistical Office of Kosovo Ndryshimet demografike të popullsisë së Kosovës në periudhën 1948-2006
- ^ "Agjensia e Statistikave te Kosoves". Retrieved 24 February 2013.
- ^ "Statistikat e Popullsisë". Agjensia e statistikave te Kosoves. Retrieved 24 February 2013.
- ^ "Kosovo Agency of Statistics". Retrieved 24 February 2013.
- ^ "CIA- The World Factbook". Retrieved 24 February 2013.
- ^ "People on Move,pg.18". Retrieved 24 February 2013.
- ^ "People on Move,pg.22". Retrieved 24 February 2013.
- ^ "People on Move,pg.22". Retrieved 24 February 2013.
- ^ "People on Move,pg.20". Retrieved 24 February 2013.
- ^ BBC: [1]
- ^ Coordination Centre of Federal Republic of Yugoslavia and Republic of Serbia for Kosovo and Metohija
- ^ UNHCR: 2002 Annual Statistical Report: Serbia and Montenegro, pg. 9
- ^ USCR: Country report: Yugoslavia
- ^ "Demographic and Socioeconomic Fnidings, pg 6". Retrieved 24 February 2013.
- ^ "Demographic and Socioeconomic Fnidings, pg 7-11". Retrieved 24 February 2013.
- ^ "Demographic and Socioeconomic Fnidings, pg 8". Retrieved 24 February 2013.
- ^ "Demographic and Socioeconomic Fnidings, pg 27". Retrieved 24 February 2013.
- ^ "Demographic and Socioeconomic Fnidings, pg 29". Retrieved 24 February 2013.
- ^ "Health 2009". Retrieved 24 February 2013.
- ^ "Health survey". Retrieved 24 February 2013.
- ^ "Demographic and Socioeconomic Fnidings, pg 60". Retrieved 24 February 2013.
- ^ "Demographic and Socioeconomic Fnidings, pg 72". Retrieved 24 February 2013.
- ^ "Demographic and Socioeconomic Fnidings, pg 73". Retrieved 24 February 2013.
- ^ BBC NEWS | World | Europe | Muslims in Europe: Country guide
- ^ http://esk.rks-gov.net/rekos2011/repository/flipbook/2/Final%20Results_ENG, p.62
- ^ Radical Islam Uses Balkan Poor To Wield Influence 25 October 2010.
- ^ 'Muslim' Albanians return to Christianity. Published December 4, 2008.
- ^ http://esk.rks-gov.net/rekos2011/repository/flipbook/2/Final%20Results_ENG/#/143
- ^ http://esk.rks-gov.net/rekos2011/repository/flipbook/2/Final%20Results_ENG/#/144, p.125
- ^ http://esk.rks-gov.net/rekos2011/repository/flipbook/2/Final%20Results_ENG/#/144, p.131
- ^ http://esk.rks-gov.net/rekos2011/repository/flipbook/2/Final%20Results_ENG/#/144, p.145
- ^ Djordje Janković: Middle Ages in Noel Malcolm's "Kosovo. A Short History" and Real Facts
- ^ The central Balkan tribes in pre-Roman times: Triballi, Autariatae, Dardanians, Scordisci and Moesians by Fanula Papazoglu,ISBN 90-256-0793-4,page 265
- ^ a b Pannonia and Upper Moesia: a history of the middle Danube provinces of the Roman Empire The Provinces of the Roman Empire Tome 4,ISBN-0710077149, 9780710077141,1974,page 9
- ^ Wilkes, J. J. The Illyrians, 1992,ISBN 0-631-19807-5.,Page 85,"... Whether the Dardanians were an Illyrian or a Thracian people has been much debated and one view suggests that the area was originally populated with Thracians who where [sic?] then exposed to direct contact with illyrians over a long period..."
- ^ Hauptstädte in Südosteuropa: Geschichte, Funktion, nationale Symbolkraft by Harald Heppner,page 134
- ^ Constantine Porphyrogenitus: De administrando imperio
- ^ Anne Comnène, Alexiade - Règne de l'Empereur Alexis I Comnène 1081-1118, texte etabli et traduit par B. Leib, Paris 1937-1945, II, 147-148, 157, 166, 184
- ^ A. Backalov: The Early Middle Ages, The Archaeological Treasures of Kosovo and Metohija from the Neolityc to the Early Middle Ages, Gallery of Serbian Academy of Sciencies and Arts, 90, Beograd, 1998, pp 372-391, 678-728
- ^ Milica Grković, 2004, First charter of Dečani: Dečanski hrisovulja ili raskošni svitak, Zbornik Matice srpske za književnost i jezik, vol. 52, iss. 3, pp. 623-626
- ^ Pavle Ivić and Milica Grković, 1976, Dečanske hrisovulje, Institute of Linguistics (Novi Sad), (Serbo-Croatian)
- ^ The original Turkish-language copy of the census is stored in Istanbul's archives.
- ^ In 1972 the Sarajevo Institute of Middle Eastern Studies translated the original Turkish census and published an analysis of it Kovačević Mr. Ešref, Handžić A., Hadžibegović H. Oblast Brankovića - Opširni katastarski popis iz 1455., Orijentalni institut, Sarajevo 1972. Subsequently others have covered the subject as well such as Vukanović Tatomir, Srbi na Kosovu, Vranje, 1986.
- ^ Vasić, Milan (1991), "Etnički odnosi u jugoslovensko-albanskom graničnom području prema popisnom defteru sandžaka Skadar iz 1582/83. godine", Stanovništvo slovenskog porijekla u Albaniji : zbornik radova sa međunarodnog naučnog skupa održanog u Cetinju 21, 22. i 23. juna 1990 (in Serbo-Croatian), OCLC 29549273
{{citation}}: Cite has empty unknown parameter:|coauthors=(help); External link in|chapterurl=|author=and|last=specified (help); Unknown parameter|chapterurl=ignored (|chapter-url=suggested) (help) - ^ TKGM, TD № 55 (412), (Defter sandžaka Prizren iz 1591. godine).
- ^ Noel Malcolm, Kosovo, A Short History pp.139-171
- ^ Dr. Joseph Müller, Albanien, Rumelien und die Österreichisch-montenegrinische Gränze, Prag, 1844
- ^ a b c d e H.R. Wilkinson, Maps and Politics; a review of the ethnographic cartography of Macedonia, Liverpool University Press, 1951
- ^ Das Fürstenthum Serbien und Türkisch-Serbien, eine militärisch-geographische Skizze von Peter Kukolj, Major im k.k.Generalstabe, Wien 1871
- ^ ISBN 86-17-09287-4: Kosta Nikolić, Nikola Žutić, Momčilo Pavlović, Zorica Špadijer: Историја за трећи разред гимназије, Belgrade, 2002, pg. 63
- ^ http://www.kosovo.net/sk/history/kosovo_origins/ko_chapter2.html
- ^ Detailbeschreibung des Sandzaks Plevlje und des Vilajets Kosovo (Mit 8 Beilagen und 10 Taffeln), Als Manuskript gedruckt, Vien 1899, 80-81.
- ^ H. N. Brailsford, Macedonia, Its Races and Their Future, London, 1906
- ^ Servia by the Servians, Compiled and Edited by Alfred Stead, With a Map, London (William Heinemann), 1909. (Etnographical Map of Servia, Scale 1:2.750.000).
- ^ a b Gustav Weigand, Ethnographie von Makedonien, Leipzig, 1924; Густав Вайганд, Етнография на Македония (Bulgarian translation)
- ^ a b c Serge Krizman, Maps of Yugoslavia at War, Washington 1943.
- ^ a b ISBN 86-17-09287-4: Kosta Nikolić, Nikola Žutić, Momčilo Pavlović, Zorica Špadijer: Историја за трећи разред гимназије природно-математичког смера и четврти разред гимназије општег и друштвено-језичког смера, Belgrade, 2002, pg. 182
- ^ a b Annexe I, by the Serbian Information Centre-London to a report of the Select Committee on Foreign Affairs of the House of Commons of the Parliament of the United Kingdom.
- ^ Ruza Petrovic. "Preface". The Migration of Serbs and Montenegrins from Kosovo and Metohija.
{{cite book}}: External link in|chapterurl=|chapterurl=ignored (|chapter-url=suggested) (help); Unknown parameter|coauthor=ignored (|author=suggested) (help) - ^ Bugajski, Janusz (2002). Political Parties of Eastern Europe: A Guide to Politics in the Post-Communist Era. New York: The Center for Strategic and International Studies. p. 479. ISBN 1563246767.
External links
- Statistical Office of Kosovo
- Filling the Vacuum: Ensuring Protection and Legal Remedies for Minorities in Kosovo by Minority Rights Group International (May 2009)
- Groups working with all demographics in Kosovo
 | ||
| Larger ethnic minorities |  | |
|---|---|---|
| Smaller ethnic minorities | ||
| ||