
Economy of Moldova
 The International Business Centre Skytower in Chișinău | |
| Currency | Moldovan leu (MDL) |
|---|---|
| Calendar year | |
Trade organisations | WTO, GUAM, CEFTA, BSEC, CISFTA, EAEU (observer) |
Country group |
|
| Statistics | |
| Population | |
| GDP | |
| GDP rank | |
GDP growth |
|
GDP per capita | |
GDP per capita rank | |
GDP by sector |
|
| |
Population below poverty line |
|
| |
Labour force | |
Labour force by occupation |
|
| Unemployment | |
Average gross salary | MDL 11,539.1 / €604 / $651 monthly (Q4, 2022)[11] |
| MDL 9,240.51 / €483 / $521 monthly (Q4, 2022)[12][13][14] | |
Main industries | Food processing, agricultural machinery; foundry equipment, refrigerators and freezers, washing machines; hosiery, shoes, textiles, sugar processing, vegetable oil.[15] |
| External | |
| Exports | |
Export goods | Cereals and cereal-based products; seeds and oleaginous fruits; electrical machines, appliances and parts thereof; vegetable fats and oils − fixed, crude, refined or fractionated; vegetables and fruits; clothing and accessories; furniture and parts thereof; alcoholic and non-alcoholic beverages; yarns, fabrics, textiles and related products; road vehicles; Others.[15][17][18] |
Main export partners |
|
| Imports | |
Import goods | Refined petroleum and oils obtained from bituminous minerals; Medicaments; Motor cars and other motor vehicles, including station wagons and tractors; Insulated wire, cable and other insulated conductors; Optical, photographic, cinematographic instruments and apparatus; Insecticides, rodenticides, herbicides and similar products; Electrical apparatus for switching or protecting electrical circuits (switches, relays, fuses, etc.); Automatic data processing machines; Chemical products; Others.[15][21][22] |
Main import partners | |
FDI stock |
|
| |
Gross external debt |
|
| Public finances | |
| |
| |
| Revenues |
|
| Expenses |
|
| Moody's (2022):[27] B3 Outlook: Negative | |
All values, unless otherwise stated, are in US dollars. | |
The economy of Moldova is an emerging[1] upper-middle income economy,[2] with a high Human Development Index.[15] Moldova is a landlocked Eastern European country, bordered by Ukraine on the East and Romania to the West. It is a former Soviet republic and today a candidate member to the European Union.[29]
Background
On January 2, 1992, Moldova introduced a market economy, liberalising prices, which resulted in huge inflation. In 1993, a national currency, the Moldovan leu, was introduced to replace the Soviet rouble. The economic fortunes of Moldova began to change in 2001; since then the country has seen a steady annual growth of between 5% and 10%. Remittances from Moldovans abroad account for a quarter of Moldova's GDP, one of the highest percentages in the world.
Overview
This section needs to be updated. (January 2017) |
This section needs additional citations for verification. (October 2012) |

Moldova's proximity to the Black Sea gives it a mild and sunny climate. The fertile Chernozem soil supports wheat, corn, barley, tobacco, sugar beet, and soybeans. Beef and dairy cattle are raised, and beekeeping is widespread. Moldova's best-known product comes from its extensive and well-developed vineyards concentrated in the central and southern regions. Moldova produces liqueur and sparkling wine. It is also known for its sunflower seeds, walnuts, apples, and other fruits. This makes the area ideal for agriculture and food processing, which accounts for about 40% of the country's GDP.
Moldova produced in 2018:
- 2.0 million tons of maize;
- 1.1 million tons of wheat;
- 788 thousand tons of sunflower seed;
- 730 thousand tons of grape;
- 707 thousand tons of sugar beet (the beet is used to manufacture sugar and ethanol);
- 665 thousand tons of apple;
- 175 thousand tons of barley;
- 174 thousand tons of potato;
- 132 thousand tons of plum;
In addition to smaller productions of other agricultural products, like rapeseed (85 thousand tons). Moldova has a production of grape and apple between the 20th and 25th largest in the world, and a production of plum and sunflower seed between the 10th and 15th largest of the world.[30]


Moldova has experienced economic difficulties, like many other former Soviet republics. Since its economy was highly dependent on the rest of the former Soviet Union for energy and raw materials, the breakdown in trade following the breakup of the Soviet Union had a serious effect, exacerbated at times by drought and civil conflict. The Russian rouble devaluation of 1998 had a deleterious effect on Moldova's economy, but economic growth has been steady since 2000.
Moldova has made progress in economic reform since independence. The government has liberalized most prices and has phased out subsidies on most basic consumer goods. A program begun in March 1993 has privatized 80% of all housing units and nearly 2,000 small, medium, and large enterprises, which led to a rise in homelessness and unemployment. Other successes include the privatization of nearly all of Moldova's agricultural land from state to private ownership, as a result of an American assistance program completed in 2000. A stock market opened in June 1995.
Inflation was brought down from over 105% in 1994 to 11% in 1997. Though inflation spiked again after Russia’s 1998 currency devaluation, Moldova made great strides in bringing it under control: 18.4% in 2000, 6.3% in 2001, and 4.4% in 2002. In 2003 inflation escalated again – due mainly to a drought-driven rise in agricultural prices – reaching 15.7%, although it was reined in to 12.5% in 2004. The local currency appreciated considerably in 2003 and the first months of 2004. By May, the leu had reached its highest level since the end of 1999. After the National Bank of Moldova increased considerably its purchases on the foreign exchange market, the leu stabilized in November–December 2004 at 12.00-12.50 to the US dollar.
Moldova continues transitioning towards a free-market economy. The country recorded its fifth consecutive year of positive GDP growth in 2004, with year-end real GDP growth of 8%. This growth is impressive considering that, prior to 2000, Moldova had recorded only one year of positive GDP growth since independence. Budget execution in 2004 was also impressive, as actual consolidated budget revenues exceeded projections by 1.4% for most of the year.
Privatization results in 2004 were not significant: several smaller companies and one winery were privatized in 2004, but the government postponed indefinitely the privatization of several larger state enterprises, including two electricity distribution companies. Sporadic and ineffective enforcement of the law, economic and political uncertainty, and government harassment and interference continue to discourage inflows of foreign direct investment.
Imports continued to increase more rapidly than exports during the first nine months of 2004; Moldova’s terms of trade worsened, as higher-priced energy imports outpaced the value of Moldova’s main exports—agricultural and agro-processing goods.
During 2002, Moldova rescheduled an outstanding Eurobond, in the amount of $39.6 million, to avoid a potential default. In May 2004, Moldova redeemed promissory notes with a total value of $114.5 million to Russian Gazprom for just $50 million. Moldova informed its bilateral creditors in mid-2003 that it would no longer service its debts. The 2004 budget did provide funds for external debt service (interest) at some 6% of the government budget, the 2005 budget projects external debt service at some 4%. The International Monetary Fund (IMF) and World Bank resumed lending to Moldova in July 2002, and then suspended lending again in July 2003. Although Moldova passed a poverty reduction strategy in 2004, it has yet to reach an agreement with international financial institutions.
70% of total electrical energy power consumed in Moldova is imported from Ukraine and only 30% is produced in Moldova.
Macroeconomic situation
This section needs additional citations for verification. (October 2012) |

As a whole, Moldova is doing well, despite a series of consecutive shocks, which included the doubling of the price of imported natural gas and 2006 Russian ban of Moldovan and Georgian wines, and a severe drought in 2007. Growth is estimated at 5 percent in 2007 and is projected to increase to 7 percent in 2008. Investment is picking up, and is beginning to replace remittances as the main source of growth—an encouraging sign that the earlier model of consumption-driven growth is changing.
Moldova increasingly faces the challenges experienced by other transition economies. Improved growth prospects have come with strong appreciation pressures from foreign exchange inflows, and a widening trade deficit. Foreign direct investment (FDI) has picked up and is estimated to have reached 12 percent of GDP in 2007, compared with 7 percent in 2006.
The main macroeconomic concern is inflation, which at 13 percent remains high for the region.
A deterioration in the merchandise trade balance due to strong import growth has been offset by improvements in net income and transfers, with a small improvement in the current account deficit to 12 percent of GDP. A resumption of wine exports to Russia in October was a major positive development, although volumes are likely to recover slowly.
Fiscal policy remained tight, ending 2007 with a modest deficit of 0.3 percent of GDP. Strong revenue performance was driven by robust VAT on imports, while expenditure was kept in line with the budget. However, the tax cuts introduced in 2008 may undermine the favorable fiscal position.
Monetary tightening in 2007 was complicated by the strong inflow of foreign exchange. The National Bank of Moldova increased reserve requirements from 10 to 15 percent, and raised policy interest rates by 2.5 percentage points. Nevertheless, the possibility of second-round effects from the drought, liquidity pressures from growing remittances and FDI, and the continued strong growth in credit and broad money suggest that upside risks to inflation are not yet fully contained.
In spite of some favorable background, Moldova remains Europe's poorest nation, resisting pursuing the types of reforms that have vastly improved the economies of some of its Eastern European neighbors. The Communist Party retained political control after winning the March 2005 parliamentary elections and re-elected its leader, Vladimir Voronin, as president in collaboration with the opposition. Although the government maintains a pro-Western stance, it has had trouble pursuing structural reforms and has made little progress on the International Monetary Fund's program to attract external financial resources. The parliament approved the government's economic growth and strategy paper in December 2004, but international financial institutions and Western investors will not be satisfied until the government begins to address fiscal adjustment, wage restraint, and payment of debt arrears. Despite the fact that the pace of privatization and industrial output has slowed, GDP growth was 7.3 percent in 2004, consumption continues to grow, and the currency continues to appreciate. The impasse in the pro-Russian Transnistria enclave, plagued by corruption and the smuggling of arms and contraband, continues despite international attempts at mediation.
Business and economic environment
According to the 2023 Index of Economic Freedom, Moldova ranks 96th globally with the overall score of 58.5, a decrease relative to 2022.[31]
| Rule of Law | Regulatory Efficiency | Government Size | Open Markets | ||||||||
|---|---|---|---|---|---|---|---|---|---|---|---|
| Parameter | Score | Change in Yearly Score from 2022 | Parameter | Score | Change in Yearly Score from 2022 | Parameter | Score | Change in Yearly Score from 2022 | Parameter | Score | Change in Yearly Score from 2022 |
| Property Rights | 37.9 | Business Freedom | 60.2 | Government Spending | 64.4 | Trade Freedom | 75.6 | ||||
| Government Integrity | 35.6 | Labor Freedom | 46.6 | Tax Burden | 93.4 | Investment Freedom | 55.0 | ||||
| Judicial Effectiveness | 29.8 | Monetary Freedom | 71.2 | Fiscal Health | 82.1 | Financial Freedom | 50.0 | ||||
*Everything above 60 is considered to be Moderately Free.
According to the 2020 Ease of Doing Business Index, Moldova's Distance to Frontier is 74.4/100 (48th globally), an increase of 1.3 relative to 2019.[32]
| ||||||||||||||||||||||||||||||||||||||||||||||||||||||||||||
*DTF (Distance to Frontier): Higher is better
Trade policy
According to the World Bank, Moldova's weighted average tariff rate in 2001 (the most recent year for which World Bank data are available) was 2.8 percent. (The World Bank has revised the figure for 2001 downward from the 3.9 percent reported in the 2005 Index.) A 2004 World Bank report notes a "range of informal barriers to both imports and exports in Moldova, such as cumbersome and restrictive trade procedures, corruption, burdensome and inappropriate regulations and high transport costs." Based on the revised trade factor methodology, Moldova's trade policy score is unchanged.
Free Trade Agreements
Currently Moldova has signed multilateral and bilateral Free Trade Agreements with 43 countries.
| Agreement | Signed | Entry into Force | Comment |
|---|---|---|---|
| Moldova–Azerbaijan FTA | 1995 | 1996 | |
| Moldova–Georgia FTA | 1997 | 2007 | |
| CEFTA | 19 December 2006 | 28 July 2007 | |
| CISFTA | 18 October 2011 | 9 December 2012 | |
| DCFTA | 27 June 2014 | 1 July 2016 | Provisionally applied 1 September 2014 – 1 July 2016 |
| Moldova–Turkey FTA | 11 September 2014 | 1 November 2016 | |
| EFTA-Moldova FTA[33] | 27 June 2023[34] | Awaiting ratification | |
| Moldova–China FTA[35] | Under Negotiation |
Regional developments
Countries tend to benefit from sharing borders with developed markets as this facilitates trade and development. Below is a table of Moldova's neighboring countries, their GDP per capita in 1990 and 2015, and trade values between the pairs. Their evolution is distinct as Romania went from a GDP per capita which was only about a third larger than that of Moldova's in 1990 to one which in 2015 is more than four times as large. Ukraine on the other hand decreased its advantage over Moldova by almost 6pc. This is evident in trade as the value of exports to Ukraine is only about 10pc that of exports to Romania.
| Country | GDP per capita, PPP (current international $) 1990[36] |
Difference in GDP PPP (%) in 1990 |
GDP per capita, PPP (current international $) 2016[36] |
Difference in GDP PPP (%) in 2016 |
Exports to US millions (2016)[37] |
Percentage of total exports[37] |
Imports from US millions (2016)[37] |
Percentage of total imports[37] |
|---|---|---|---|---|---|---|---|---|
| Romania | 5,504 | 32.2 | 23,626 | 342.2 | 513.1 | 25.1 | 555.5 | 13.7 |
| Ukraine | 6,780 | 62.9 | 8,272 | 54.8 | 49.7 | 2.4 | 383.9 | 9.8 |
| Moldova | 4,162 | 5,343 |
Fiscal burden
Moldova's top income tax rate is 22 percent. The top corporate tax rate has been cut to 18 percent from 20 percent, effective January 2005. In 2003, government expenditures as a share of GDP increased 1.2 percentage points to 33.6 percent, compared to the 3.0 percentage point increase in 2002.
Government intervention
The World Bank reports that the government consumed 17.7 percent of GDP in 2003. In the same year, based on data from the International Monetary Fund, Moldova received 4.93 percent of its revenues from state-owned enterprises and government ownership of property.
Monetary policy
Between 1995 and 2004, Moldova's weighted average annual rate of inflation was 11.99 percent.
Foreign investment
The Moldovan government does not maintain many formal barriers to foreign investment, and the Moldovan embassy reports that foreign investors are free to "place their investments throughout the Republic of Moldova, in any area of business activity, as long as it does not go against the interests of the national security, anti-monopoly legislation, environment protection norms, public health and public order." However, there are significant informal barriers and indications that the formal reasons to block investment are liberally applied. According to the International Monetary Fund, "despite efforts to simplify licensing and business registration, there has been no significant improvement in the business climate. Moreover, the privatization program has stalled, while corruption remains widespread and governance weak. Government interference in the private sector…casts doubt over the authorities' commitment to market-oriented reforms." The Economist Intelligence Unit reports that the "poor investment climate, including annulments of some earlier sales, continues to deter many Western investors. Between 2001 and 2004 the government privatized less than 60 of the 480-odd enterprises scheduled for sale." Foreign investors may not purchase agricultural or forest land. The IMF reports that both residents and non-residents may hold foreign exchange accounts, but approval is required in some cases. Payments and transfers require supporting documentation and approval of the National Bank of Moldova if they exceed specified amounts. Nearly all capital transactions require approval by or registration with the National Bank of Moldova.
Banking and finance
There are no official barriers to founding foreign banks or branches in Moldova. The central bank has increased the minimum capital requirement, which is expected to contribute to consolidation in the banking sector. First Initiative reports that the banking sector "consists of 16 commercial banks (2003). There are 14 locally-owned banks, while the two remaining ones are from Russia and Romania. The banking sector is highly concentrated with the five largest banks accounting for over 70% of lending in 2002. Unlike the banking sector, the insurance sector has high levels of foreign-participation. The largest insurance firm in Moldova, the former state insurance company, is owned by an Australian company." Moldova's stock exchange is very small, listing fewer than 25 companies in 2002. The Moldovan embassy reports that the government holds shares in two banks—JSCB "Banca de Economii" SA and JSCB "EuroCreditBank"—including a controlling share of Banca de Economii. The Economist Intelligence Unit reports that foreign investment accounts for approximately 50 percent of total banking capital.
Wages and prices
The government influences prices through the large state-owned sector. According to the Ministry of Economy, the state regulates the prices of goods and services provided by monopolies and the prices of electric or thermal energy, land, medical services, and services offered by local tax regions. Moldova has two legal monthly minimum wages: one wage for state employees and another, higher wage for the private sector.
In 2015, the average monthly salary in the economy was MDL 4611 (approx. 210 EUR / 235 USD), up by 10.5% (0.7% inflation adjusted) against 2014.
In December 2015 the average salary for state employees was MDL 4162 and the average salary in private sector was MDL 5684, up by 4.0% and 8.6% against 2014 respectively.[38]
Property rights
The U.S. Department of Commerce reports that the "legal system has improved in recent years. Moldova has a documented and consistently applied commercial law." Nevertheless, much more needs to be done. According to the U.S. Department of State, "The Constitution provides for an independent judiciary; however, the executive branch has exerted undue influence on the judiciary. Many observers believe that arrears in salary payments also make it difficult for judges to remain independent from outside influences and free from corruption."
Regulation
"Bureaucratic procedures are not always transparent and red tape often makes processing unnecessarily long," reports the U.S. Department of Commerce. "[C]ommercial law is a confusing patchwork of narrow statutes and an outdated civil code. With USAID experts, a draft civil code has been developed which follows the current European practice of incorporating commercial law provisions." The same source reports that anti-corruption laws "are not effectively enforced and corruption exists at an advanced level." A report provided by the World Bank indicates that labor laws are somewhat rigid.
Informal market
Transparency International's 2004 score for Moldova is 2.3. Thereafter, Moldova's informal market score is 4 in 2005. In 2011 the corruption score for Moldova is 2.9, better than it was in 2004, concluding TI.[39]
Tourism
- Total:
 234,200 in 2016[40]
There are around 15,000 sights and 300 natural zones within Moldova, which represent a potential for domestic and international tourists.
Statistics
| Year | 2010 | 2011 | 2012 | 2013 | 2014 | 2015 | 2016 | 2017 | 2018 | 2019 | 2020 | |
| GDP Nominal (In US Dollars, Current Prices)[41] | ||||||||||||
|---|---|---|---|---|---|---|---|---|---|---|---|---|
| GDP Nominal | 6.977bn | 8.417bn | 8.708bn | 9.496bn | 9.510bn | 7.726bn | 8.072bn | 9.670bn | 11.457bn | 11.972bn | 11.912bn(e) | |
| Per Capita | 2,428.1 | 2,930.0 | 3,031.1 | 3,307.3 | 3,314.5 | 2,715.7 | 2,857.8 | 3,478.5 | 4,196.1 | 4,464.1 | 4,522.5(e) | |
| GDP Purchasing Power Parity (In US Dollars, Current Prices)[42] | ||||||||||||
| GDP PPP | 18.302bn | 19.772bn | 21.055bn | 23.961bn | 25.218bn | 26.233bn | 29.732bn | 32.101bn | 34.281bn | 36.186bn | 34.070bn(e) | |
| Per Capita | 6,369.3 | 6,882.4 | 7,329.1 | 8,345.0 | 8,789.2 | 9,221.8 | 10,527.0 | 11,547.4 | 12,555.6 | 13,493.4 | 12,934.7(e) | |
| Real GDP Growth (Percent Change, Relative to Previous Year)[43] | ||||||||||||
| GDP Growth | 7.1% | 5.8% | -0.6% | 9.0% | 5.0% | -0.3% | 4.4% | 4.7% | 4.3% | 3.7% | -6.9(e) | |
| Inflation, Average Consumer Prices (Percent Change, Relative to Previous Year)[44] | ||||||||||||
| CPI | 7.35% | 7.65% | 4.55% | 4.57% | 5.06% | 9.6% | 6.4% | 6.5% | 3.6% | 4.3% | 4.4% | |
| End of Period | 8.0% | 7.8% | 3.9% | 5.1% | 4.7% | 13.5% | 2.4% | 7.3% | 0.9% | 7.1% | 0.9% | |
| Public Debt (Percent of GDP)[45] | ||||||||||||
| Government Gross Debt | 25.5% | 24.2% | 31.2% | 29.9% | 34.9% | 42.4% | 39.2% | 34.3% | 31.2% | 28.3% | 34.8%(e) | |
| Current Account Balance | -6.9% | -10.1% | -7.4% | -5.2% | -6.0% | -6.0% | -3.5% | -5.7% | -10.3% | -9.3% | -6.7%(e) | |
| External Debt (In US Dollars)[46] | ||||||||||||
| General Government | 1.116bn | 1.157bn | 1.265bn | 1.305bn | 1.320bn | 1.354bn | 1.481bn | 1.722bn | 1.706bn | 1.718bn | 2.255bn(e) | |
| Total External Debt | 4.719bn | 5.194bn | 5.860bn | 6.729bn | 6.320bn | 5.932bn | 6.056bn | 6.833bn | 7.321bn | 7.416bn | 8.357bn(e) | |
(e) - estimate
Moldovan economy in graphics
-
 GDP (Nominal per capita) of Moldova and Neighboring Countries.
 -
 GDP (PPP per capita) of Moldova and Neighboring Countries.
 -
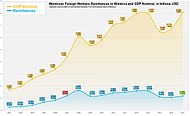 Moldovan Foreign Workers Remittances to Moldova and GDP Nominal.


Industrial production growth rate:
3.4% (2017)[47]
Agricultural production growth rate:
2.5% (2018)[48]
See also
References
![]() This article incorporates public domain material from The World Factbook. CIA.
This article incorporates public domain material from The World Factbook. CIA.
- ^ a b "World Economic Outlook Database, April 2022. Emerging market and developing economies. Emerging and developing Europe (16 countries)". IMF.org. International Monetary Fund. Retrieved 16 August 2022.
- ^ a b "World Bank Country and Lending Groups". datahelpdesk.worldbank.org. World Bank. Retrieved 16 August 2022.
- ^ a b c d e f g h i j k "World Economic Outlook Database, October 2022. Moldova". IMF.org. International Monetary Fund. Retrieved 15 October 2022.
- ^ "Moldova: Distribution of gross domestic product (GDP) across economic sectors from 2011 to 2021". statista.com. Statista. Sep 8, 2022. Retrieved Oct 15, 2022.
In 2021, agriculture contributed around 10.39 percent to the GDP of Moldova, 20.61 percent came from the industry and 54.85 percent from the services sector.
- ^ "Poverty headcount ratio at national poverty lines (% of population)". World Bank. Retrieved 16 August 2022.
- ^ a b Europe Central Asia Economic Update, Spring 2020 : Fighting COVID-19. World Bank. 9 April 2020. pp. 59, 60. ISBN 9781464815645. Retrieved 16 August 2022.
{{cite book}}:|website=ignored (help) - ^ "Gini index - Moldova". data.worldbank.org. World Bank. Retrieved 16 August 2022.
- ^ a b "Human Development Reports: Moldova (Republic of)". Human Development Reports. HDRO (Human Development Report Office) United Nations Development Programme. Retrieved 13 September 2022.
- ^ a b c d "Biroul Național de Statistică al Republicii Moldova. Forţa de muncă". statistica.gov.md (in Romanian). National Bureau of Statistics of the Republic of Moldova. Retrieved 15 Oct 2022.
- ^ "Forța de muncă în Republica Moldova: ocuparea și șomajul în trimestrul II 2022". statistica.gov.md (in Romanian). National Bureau of Statistics of the Republic of Moldova. 2 Sep 2022. Retrieved 15 Oct 2022.[permanent dead link]
- ^ "Banca de date statistice Moldova / Câştigul salarial mediu lunar brut". statbank.statistica.md (in Romanian). National Bureau of Statistics of the Republic of Moldova. Retrieved 18 May 2023.
- ^ "Calculator salarii brut – net – total 2022". Salarii.md (in Romanian). Retrieved 18 May 2023.
- ^ "9,240 MDL to EUR - Convert Moldovan Lei to Euros". WorldForexRates. 2023-05-18.
- ^ "9,240 MDL to USD - Convert Moldovan Lei to US Dollars". WorldForexRates. 2023-05-18.
- ^ a b c d "The World Factbook". CIA.gov. Central Intelligence Agency. Retrieved 16 August 2022.
- ^ a b c "Exporturile Republicii Moldova, structurate pe tari si grupe de tari, 1997-2021". statbank.statistica.md (in Romanian). National Bureau of Statistics of the Republic of Moldova. Retrieved 16 August 2022.
- ^ "Republica Moldova, tot mai legată de exporturile mărfurilor în UE. România e destinație principală, Rusia în scădere abruptă". g4media.ro (in Romanian). G4 Media. 17 May 2022. Retrieved 17 August 2022.
- ^ "What does Moldova export? (2020)". oec.world. The Observatory of Economic Complexity. Retrieved 17 August 2022.
- ^ "Where does Moldova export to? (2021)". oec.world. OEC - The Observatory of Economic Complexity. Retrieved 14 April 2023.
- ^ a b c "Importurile Republicii Moldova, structurate pe tari si grupe de tari, 1997-2021". statbank.statistica.md (in Romanian). National Bureau of Statistics of the Republic of Moldova. Retrieved 17 August 2022.
- ^ "Moldova. Imports and Exports. World−ALL COMMODITIES−Value (US$) and Value Growth, YoY (%). 2009 - 2020". trendeconomy.com. TrendEconomy. Retrieved 17 August 2022.
- ^ "What does Moldova import? (2020)". oec.world. The Observatory of Economic Complexity. Retrieved 17 August 2022.
- ^ "Where does Moldova import from? (2021)". oec.world. OEC - The Observatory of Economic Complexity. Retrieved 14 April 2023.
- ^ "Investiţiile străine directe: Impactul asupra economiei Republicii Moldova. 2021 report, p. 15" (PDF). fia.md (in Romanian). Foreign Investors Association. Retrieved 17 August 2022.
- ^ "External debt / Datoria externă la sfârșitul trimestrului II 2022 (date provizorii)". bnm.md (in Romanian). National Bank of Moldova. 30 Sep 2022. Retrieved 15 Oct 2022.
Conform datelor preliminare, datoria externă brută a Republicii Moldova s-a diminuat neesențial pe parcursul trimestrului II 2022, cu 0,9 la sută și a totalizat 8 687,24 mil. USD la 30.06.2022, ceea ce constituie 60,9 la sută raportat la PIB (-3,2 p.p. față de 31.12.2021).
- ^ "RAPORT privind situaţia în domeniul datoriei sectorului public, garanţiilor de stat şi recreditării de stat în semestrul I al anului 2022" (PDF). mf.gov.md (in Romanian). Ministry of Finance (Moldova). p. 4. Retrieved 15 Oct 2022.
Drept urmare a analizei privind evoluția datoriei sectorului public, se atestă o creșterea soldului acesteia cu 1,1% la situația din 30 iunie 2022 comparativ cu sfârșitul anului 2021, constituind 82 742,2 mil. lei sau 29,6% din PIB-ul prognozat pentru anul 2022. Ca pondere în PIB, datoria sectorului public s-a micșorat cu 4,2 p.p. comparativ cu situația de la finele anului 2021.
- ^ "Moldova: Sovereign credit ratings (measure: Sovereign credit rating, source: Standard & Poor's, Moody's, Fitch, and Scope)". theglobaleconomy.com. The Global Economy. April 2022. Retrieved 18 August 2022.
- ^ "Report : Official reserve assets and other foreign currency assets". bnm.md. National Bank of Moldova. Retrieved 15 Oct 2022.
- ^ "EU awards Ukraine and Moldova candidate status". BBC News. 2022-06-23. Retrieved 2022-08-16.
- ^ "Moldova production in 2018, by FAO".
- ^ "Moldova Economy: Population, GDP, Inflation, Business, Trade, FDI, Corruption".
- ^ "Doing Business in Moldova - World Bank Group". Archived from the original on 2010-10-17.
- ^ "EFTA website on Moldova trade negotiations".
- ^ "EFTA and Moldova sign a Free Trade Agreement".
- ^ "China FTA Network".
- ^ a b "GDP per capita, PPP (Current international $) - Romania, Moldova, Ukraine | Data".
- ^ a b c d "Biroul Naţional de Statistică // Comunicate de presă".
- ^ "Average earnings in the IV-th quarter 2018". statistica.md. National Bureau of Statistics of the Republic of Moldova. Retrieved 3 March 2019.
- ^ Transparency International e.V. "2011 Corruption Perceptions Index -- Results". Archived from the original on 10 August 2012. Retrieved 3 March 2015.
- ^ "Activitatea turistică a agenţiilor de turism şi turoperatorilor din Republica Moldova în anul 2016 // Biroul Naţional de Statistică" (in Romanian). Retrieved 21 February 2017.
- ^ "Moldova; Gross Domestic Product (Nominal) // World Economic Outlook Database, October 2021". International Monetary Fund. Retrieved 31 October 2021.
- ^ "Moldova; Gross Domestic Product (Purchasing Power Parity) // World Economic Outlook Database, October 2021". International Monetary Fund. Retrieved 31 October 2021.
- ^ "Moldova; Gross Domestic Product (Percent Change) // World Economic Outlook Database, October 2021". International Monetary Fund. Retrieved 31 October 2021.
- ^ "Moldova; Inflation, Average Consumer Prices (Percent Change) // World Economic Outlook Database, October 2021". International Monetary Fund. Retrieved 31 October 2021.
- ^ "Moldova; General Government Gross Debt (Percent of GDP) // World Economic Outlook Database, October 2021". International Monetary Fund. Retrieved 31 October 2021.
- ^ "External debt at the end of 2020 (preliminary data)". Banca Naţională a Moldovei. Retrieved 31 October 2021.
- ^ "Activitatea industriei Republicii Moldova în ianuarie-decembrie 2017" (in Romanian). Biroul Naţional de Statistică. Retrieved 5 March 2018.
- ^ "Producţia globală agricolă în anul 2018" (in Romanian). Biroul Naţional de Statistică. Retrieved 18 February 2019.
External links
- National Bureau of Statistics of Moldova
- National Bank of Moldova
- International Monetary Fund: Republic of Moldova: Statistical Appendix
| History |  | ||||
|---|---|---|---|---|---|
| Geography |
| ||||
| Politics | |||||
| Economy | |||||
| Society |
| ||||
| Authority control databases: National |
|---|