
Kiowa County, Kansas
Kiowa County | |
|---|---|
 New 2009 County Courthouse in Greensburg | |
 Location within the U.S. state of Kansas | |
 Kansas's location within the U.S. | |
| Coordinates: 37°34′00″N 99°17′00″W / 37.5667°N 99.2833°W | |
| Country | |
| State | |
| Founded | February 26, 1867 |
| Named for | Kiowa tribe |
| Seat | Greensburg |
| Largest city | Greensburg |
| Area | |
| • Total | 723 sq mi (1,870 km2) |
| • Land | 723 sq mi (1,870 km2) |
| • Water | 0.2 sq mi (0.5 km2) 0.03% |
| Population | |
| • Estimate (2016) | 2,483 |
| • Density | 3.5/sq mi (1.4/km2) |
| Time zone | UTC−6 (Central) |
| • Summer (DST) | UTC−5 (CDT) |
| Congressional district | 4th |
| Website | KiowaCountyKS.org |
Kiowa County (standard abbreviation: KW) is a county located in the U.S. state of Kansas. As of the 2010 census, the county population was 2,553.[1] The largest city and county seat is Greensburg.[2]
History
In 1854, the Kansas Territory was organized, then in 1861 Kansas became the 34th U.S. state. In 1867, Kiowa County was established and named after the Kiowa tribe.[3]
21st century
On May 4, 2007, Greensburg was devastated by an EF5 tornado during the May 2007 tornado outbreak.
Geography
According to the U.S. Census Bureau, the county has a total area of 723 square miles (1,870 km2), of which 723 square miles (1,870 km2) is land and 0.2 square miles (0.52 km2) (0.03%) is water.[4]
Kiowa County has a large number of iron-rich meteorites in its soil due to the Brenham meteor fall over 10 thousand years ago.
Adjacent counties
- Edwards County (north)
- Pratt County (east)
- Barber County (southeast)
- Comanche County (south)
- Clark County (southwest)
- Ford County (west)
Demographics
| Census | Pop. | Note | %± |
|---|---|---|---|
| 1890 | 2,873 | — | |
| 1900 | 2,365 | −17.7% | |
| 1910 | 6,174 | 161.1% | |
| 1920 | 6,164 | −0.2% | |
| 1930 | 6,035 | −2.1% | |
| 1940 | 5,112 | −15.3% | |
| 1950 | 4,743 | −7.2% | |
| 1960 | 4,626 | −2.5% | |
| 1970 | 4,088 | −11.6% | |
| 1980 | 4,046 | −1.0% | |
| 1990 | 3,660 | −9.5% | |
| 2000 | 3,278 | −10.4% | |
| 2010 | 2,553 | −22.1% | |
| 2016 (est.) | 2,483 | [5] | −2.7% |
| U.S. Decennial Census[6] 1790-1960[7] 1900-1990[8] 1990-2000[9] 2010-2016[1] | |||

As of the census[10] of 2000, there were 3,278 people, 1,365 households, and 924 families residing in the county. The population density was 4 people per square mile (2/km²). There were 1,643 housing units at an average density of 2 per square mile (1/km²). The racial makeup of the county was 97.19% White, 0.21% Black or African American, 0.61% Native American, 0.27% Asian, 0.98% from other races, and 0.73% from two or more races. 2.04% of the population were Hispanic or Latino of any race.
There were 1,365 households out of which 27.70% had children under the age of 18 living with them, 59.60% were married couples living together, 5.30% had a female householder with no husband present, and 32.30% were non-families. 30.50% of all households were made up of individuals and 15.50% had someone living alone who was 65 years of age or older. The average household size was 2.32 and the average family size was 2.89.
In the county, the population was spread out with 24.00% under the age of 18, 8.20% from 18 to 24, 21.80% from 25 to 44, 24.60% from 45 to 64, and 21.30% who were 65 years of age or older. The median age was 42 years. For every 100 females there were 96.30 males. For every 100 females age 18 and over, there were 95.10 males.
The median income for a household in the county was $31,576, and the median income for a family was $40,950. Males had a median income of $29,063 versus $20,764 for females. The per capita income for the county was $17,207. About 7.40% of families and 10.80% of the population were below the poverty line, including 13.50% of those under age 18 and 8.70% of those age 65 or over.
Government
Presidential elections
| Year | Republican | Democratic | Third Parties |
|---|---|---|---|
| 2016 | 83.4% 900 | 10.6% 114 | 6.0% 65 |
| 2012 | 85.3% 976 | 14.3% 163 | 0.4% 5 |
| 2008 | 80.4% 912 | 17.6% 200 | 2.0% 23 |
| 2004 | 81.5% 1,275 | 16.4% 256 | 2.2% 34 |
| 2000 | 78.5% 1,262 | 18.3% 294 | 3.2% 52 |
| 1996 | 71.0% 1,264 | 18.6% 331 | 10.5% 186 |
| 1992 | 55.9% 1,057 | 18.8% 355 | 25.3% 479 |
| 1988 | 71.1% 1,276 | 27.0% 485 | 1.9% 34 |
| 1984 | 79.5% 1,537 | 18.7% 361 | 1.8% 35 |
| 1980 | 72.2% 1,433 | 22.1% 438 | 5.8% 115 |
| 1976 | 59.5% 1,180 | 38.5% 764 | 2.0% 40 |
| 1972 | 76.4% 1,559 | 19.9% 406 | 3.8% 77 |
| 1968 | 70.9% 1,484 | 23.0% 481 | 6.2% 129 |
| 1964 | 53.3% 1,135 | 45.5% 970 | 1.2% 25 |
| 1960 | 74.6% 1,662 | 24.9% 555 | 0.5% 12 |
| 1956 | 76.2% 1,717 | 22.9% 517 | 0.9% 20 |
| 1952 | 78.6% 1,838 | 18.5% 432 | 2.9% 68 |
| 1948 | 59.8% 1,258 | 34.3% 722 | 5.9% 124 |
| 1944 | 69.6% 1,479 | 29.1% 618 | 1.3% 28 |
| 1940 | 64.1% 1,571 | 34.4% 844 | 1.5% 36 |
| 1936 | 47.3% 1,280 | 52.4% 1,417 | 0.3% 8 |
| 1932 | 52.2% 1,306 | 46.4% 1,159 | 1.4% 35 |
| 1928 | 82.1% 1,929 | 17.3% 406 | 0.6% 15 |
| 1924 | 70.1% 1,541 | 22.7% 498 | 7.3% 160 |
| 1920 | 69.5% 1,411 | 28.9% 587 | 1.6% 32 |
| 1916 | 41.0% 901 | 43.5% 956 | 15.6% 342 |
| 1912 | 19.6% 276 | 35.9% 506 | 44.5% 627[a] |
| 1908 | 59.5% 699 | 34.8% 409 | 5.7% 67 |
| 1904 | 59.2% 494 | 30.1% 251 | 10.7% 89 |
| 1900 | 51.5% 322 | 46.9% 293 | 1.6% 10 |
| 1896 | 49.8% 250 | 48.8% 245 | 1.4% 7 |
| 1892 | 50.4% 398 | 49.6% 391 | |
| 1888 | 50.3% 525 | 36.5% 381 | 13.1% 137 |
Like all of the High Plains, Kiowa County is overwhelmingly Republican. The only Democrat to ever win a majority in the county has been Franklin D. Roosevelt in 1936, who ironically achieved the feat against Kansas native Alf Landon. Woodrow Wilson won a plurality in 1916, but since 1944 only three Democrats have reached thirty percent of the county’s vote, and Michael Dukakis in 1988 during a major drought and consequent farm crisis is the last Democrat to receive so much as twenty percent.
Laws
Although the Kansas Constitution was amended in 1986 to allow the sale of alcoholic liquor by the individual drink with the approval of voters, Kiowa County has remained a prohibition, or "dry", county.[12]
Education
Unified school districts
Colleges
- Barclay College, Haviland
Communities

Incorporated cities
Unincorporated communities
Townships
Kiowa County has only one township, and none of the cities within the county are considered governmentally independent; all figures for the township include those of the cities.
| Township | FIPS | Population | Population density /km² (/sq mi) |
Land area km² (sq mi) |
Water area km² (sq mi) |
Water % | Geographic coordinates |
|---|---|---|---|---|---|---|---|
| Kiowa Rural | 37185 | 3,278 | 2 (5) | 1,871 (722) | 1 (0) | 0.03% | 37°34′45″N 99°15′28″W / 37.57917°N 99.25778°W |
See also
- Community information for Kansas
- Kansas locations by per capita income
- List of counties in Kansas
- List of townships in Kansas
- List of cities in Kansas
- List of unincorporated communities in Kansas
- List of ghost towns in Kansas
References
- ^ a b "State & County QuickFacts". United States Census Bureau. Archived from the original on July 13, 2011. Retrieved July 26, 2014.
{{cite web}}: Unknown parameter|deadurl=ignored (|url-status=suggested) (help) - ^ "Find a County". National Association of Counties. Archived from the original on 2011-05-31. Retrieved 2011-06-07.
{{cite web}}: Unknown parameter|deadurl=ignored (|url-status=suggested) (help) - ^ Gannett, Henry (1905). The Origin of Certain Place Names in the United States. Govt. Print. Off. p. 176.
- ^ "US Gazetteer files: 2010, 2000, and 1990". United States Census Bureau. 2011-02-12. Retrieved 2011-04-23.
- ^ "Population and Housing Unit Estimates". Retrieved June 9, 2017.
- ^ "U.S. Decennial Census". United States Census Bureau. Archived from the original on May 12, 2015. Retrieved July 26, 2014.
{{cite web}}: Unknown parameter|deadurl=ignored (|url-status=suggested) (help) - ^ "Historical Census Browser". University of Virginia Library. Retrieved July 26, 2014.
- ^ "Population of Counties by Decennial Census: 1900 to 1990". United States Census Bureau. Retrieved July 26, 2014.
- ^ "Census 2000 PHC-T-4. Ranking Tables for Counties: 1990 and 2000" (PDF). United States Census Bureau. Retrieved July 26, 2014.
- ^ "American FactFinder". United States Census Bureau. Retrieved 2008-01-31.
- ^ http://uselectionatlas.org/RESULTS
- ^ "Map of Wet and Dry Counties". Alcoholic Beverage Control, Kansas Department of Revenue. November 2004. Archived from the original on 2007-10-08. Retrieved 2007-01-21.
{{cite web}}: Unknown parameter|deadurl=ignored (|url-status=suggested) (help)
- Notes
- ^ This total comprises 549 votes (38.96 percent) for Progressive Theodore Roosevelt (who carried the county), 72 votes (5.11 percent) for Socialist Eugene V. Debs, and six votes (0.43 percent) for write-in candidates.
Further reading
- Standard Atlas of Kiowa County, Kansas; Geo. A. Ogle & Co; 53 pages; 1906.
External links
- County
- Historical
- Kiowa County from American History and Genealogy Project (AHGP)
- Maps
- Kiowa County Maps: Current, Historic, KDOT
- Kansas Highway Maps: Current, Historic, KDOT
- Kansas Railroad Maps: Current, 1996, 1915, KDOT and Kansas Historical Society
Places adjacent to Kiowa County, Kansas | ||||||||||||||||
|---|---|---|---|---|---|---|---|---|---|---|---|---|---|---|---|---|
| ||||||||||||||||
Municipalities and communities of Kiowa County, Kansas, United States | ||
|---|---|---|
| Cities | 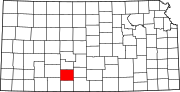 | |
| Unincorporated communities | ||
| Township | ||