New York's 26th congressional district
| New York's 26th congressional district | |
|---|---|
Interactive map of district boundaries | |
| Representative | |
| Distribution |
|
| Population (2021) | 734,798 |
| Median household income | $56,082[1] |
| Ethnicity |
|
| Cook PVI | D+10[2] |
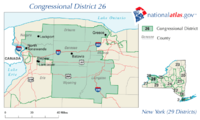
The 26th congressional district of New York is a congressional district for the United States House of Representatives in Western New York. It includes parts of Erie and Niagara counties. The district includes the cities of Buffalo, Lackawanna, Niagara Falls, Tonawanda, and North Tonawanda.
The office of representative for this district became vacant on February 9, 2011, following the resignation of Republican Chris Lee.[3] A special election was held May 24, 2011, and Democrat Kathy Hochul was elected.[4] After redistricting, Brian Higgins, a Democrat, has represented the district since 2013.
Voting
| Year | Office | Results |
|---|---|---|
| 1992 | President | Clinton 44 - 35% |
| 1996 | President | Clinton 51 - 35% |
| 2000 | President | Bush 51 - 44% |
| 2004 | President | Bush 55 - 43% |
| 2008 | President | McCain 52 - 46% |
| 2012 | President | Obama 63 - 34% |
| 2016 | President | Clinton 57 - 38% |
| 2020 | President | Biden 62 - 35% |
History
Historically, most of this district was located Upstate, However, over the years until the 2002 redistricting, most of this area was in the 27th District. During the 1980s this area was primarily in the 31st District. Two districts covered this area in the 1970s, the Erie County based 38th and the Monroe County based 35th. The 26th District covered the area now in the 22nd District during the 1990s and the area now in the 23rd District in the 1980s. In the 1970s this district was centered in Orange and Rockland counties. During the 1960s it covered areas in Westchester County now in the 18th and 19th District.
Representatives
1823–1833: Two seats
From the creation of the district in 1823 to 1833, two seats were apportioned, elected at-large on a general ticket.
| Years | Cong ress |
Seat A | Seat B | |||||
|---|---|---|---|---|---|---|---|---|
| Member | Party | Electoral history | Member | Party | Electoral history | |||
| March 4, 1823 – March 3, 1825 |
18th |  Dudley Marvin |
Democratic-Republican | Elected in 1822. Re-elected in 1824. Re-elected in 1826. Lost re-election. |
 Robert S. Rose |
Democratic-Republican | Elected in 1822. Re-elected in 1824. [data missing] | |
| March 4, 1825 – March 3, 1827 |
19th | Anti-Jacksonian | Anti-Jacksonian | |||||
| March 4, 1827 – March 3, 1829 |
20th | John Maynard | Anti-Jacksonian | Elected in 1826 | ||||
| March 4, 1829 – March 3, 1831 |
21st | Jehiel H. Halsey | Jacksonian | Elected in 1828. [data missing] |
 Robert S. Rose |
Anti-Masonic | Elected in 1828. [data missing] | |
| March 4, 1831 – March 3, 1833 |
22nd | William Babcock | Anti-Masonic | Elected in 1830. [data missing] |
John Dickson | Anti-Masonic | Elected in 1830. Re-elected in the single-seat district. | |
1833–present: One seat
Election results
In New York electoral politics, there are numerous minor parties at various points on the political spectrum. Certain parties will invariably endorse either the Republican or Democratic candidate for every office; hence, the state electoral results contain both the party votes, and the final candidate votes (Listed as "Recap").
| Party | Candidate | Votes | % | ±% | |
|---|---|---|---|---|---|
| Democratic | Maurice D. Hinchey (incumbent) | 122,850 | 55.2 | ||
| Republican | Sue Wittig | 94,125 | 42.3 | ||
| Independence | Douglas Walter Drazen | 5,531 | 2.5 | ||
| Majority | 28,725 | 12.9 | |||
| Total votes | 222,506 | 100 | |||
| Party | Candidate | Votes | % | ±% | |
|---|---|---|---|---|---|
| Democratic | Maurice D. Hinchey (incumbent) | 108,204 | 61.8 | +6.6 | |
| Republican | Bud Walker | 54,776 | 31.3 | −11.0 | |
| Right to Life | Randall Terry | 12,160 | 6.9 | +6.9 | |
| Majority | 53,428 | 30.5 | +17.6 | ||
| Total votes | 175,140 | 100 | -21.3 | ||
| Party | Candidate | Votes | % | ±% | |
|---|---|---|---|---|---|
| Democratic | Maurice D. Hinchey (incumbent) | 140,395 | 62.0 | +0.2 | |
| Republican | Bob Moppert | 83,856 | 37.0 | +5.7 | |
| Right to Life | Paul J. Laux | 2,328 | 1.0 | −5.9 | |
| Majority | 56,539 | 25.0 | −5.5 | ||
| Total votes | 226,579 | 100 | +29.4 | ||
| Party | Candidate | Votes | % | ±% | |
|---|---|---|---|---|---|
| Republican | Thomas M. Reynolds | 135,089 | 73.6 | +36.6 | |
| Democratic | Ayesha F. Nariman | 41,140 | 22.4 | −39.6 | |
| Right to Life | Shawn Harris | 4,084 | 2.2 | +1.2 | |
| Green | Paul E. Fallon | 3,146 | 1.7 | +1.7 | |
| Majority | 93,949 | 51.2 | +26.2 | ||
| Total votes | 183,459 | 100 | -19.0 | ||
| Party | Candidate | Votes | % | ±% | |
|---|---|---|---|---|---|
| Republican | Thomas M. Reynolds (incumbent) | 157,466 | 55.6 | −18.0 | |
| Democratic | Jack Davis | 125,613 | 44.4 | +22.0 | |
| Majority | 31,853 | 11.3 | −39.9 | ||
| Total votes | 283,079 | 100 | +54.3 | ||
| Party | Candidate | Votes | % | ±% | |
|---|---|---|---|---|---|
| Republican | Thomas M. Reynolds (incumbent) | 109,257 | 52.0 | −3.6 | |
| Democratic | Jack Davis | 100,914 | 48.0 | +3.6 | |
| Majority | 8,343 | 4.0 | −7.3 | ||
| Total votes | 210,171 | 100 | -25.8 | ||
| Party | Candidate | Votes | % | ±% | |
|---|---|---|---|---|---|
| Republican | Chris J. Lee | 148,607 | 55.0 | +3.0 | |
| Democratic | Alice Kryzan | 109,615 | 40.5 | −7.5 | |
| Working Families Party | Jon Powers | 12,104 | 4.5 | +4.5 | |
| Majority | 38,992 | 14.5 | +10.5 | ||
| Total votes | 270,326 | 100 | +28.6 | ||
| Party | Candidate | Votes | % | ±% | |
|---|---|---|---|---|---|
| Republican | Chris J. Lee (incumbent) | 151,449 | 73.6 | +18.6 | |
| Democratic | Philip A. Fedele | 54,307 | 26.4 | −14.1 | |
| Majority | 97,142 | 47.2 | +32.7 | ||
| Total votes | 205,756 | 100 | -23.9 | ||
| Party | Candidate | Votes | % | |
|---|---|---|---|---|
| Democratic | Kathy Courtney Hochul | 47,519 | 42.58 | |
| Working Families | Kathy Courtney Hochul | 5,194 | 4.65 | |
| Total | Kathy Courtney Hochul | 52,713 | 47.24 | |
| Republican | Jane L. Corwin | 35,721 | 32.01 | |
| Conservative | Jane L. Corwin | 9,090 | 8.15 | |
| Independence | Jane L. Corwin | 2,376 | 2.13 | |
| Total | Jane L. Corwin | 47,187 | 42.28 | |
| Tea Party | Jack Davis | 10,029 | 8.99 | |
| Green | Ian L. Murphy | 1,177 | 1.05 | |
| Blank and void | 259 | 0.23 | ||
| Scattering | 232 | 0.21 | ||
| Total votes | 111,597 | 100.0 | ||
| Turnout | ||||
| Democratic gain from Republican | ||||
| Party | Candidate | Votes | % | ±% | |
|---|---|---|---|---|---|
| Democratic | Brian Higgins | 212,588 | 74.8 | +48.4 | |
| Republican | Michael Madigan | 71,666 | 25.2 | −48.4 | |
| Majority | 140,922 | 49.6 | +2.4 | ||
| Total votes | 284,254 | 100 | +38.2 | ||
| Party | Candidate | Votes | % | ±% | |
|---|---|---|---|---|---|
| Democratic | Brian Higgins (incumbent) | 113,210 | 68.1 | −6.7 | |
| Republican | Kathy Weppner | 52,909 | 31.9 | +6.7 | |
| Majority | 60,301 | 36.2 | −13.4 | ||
| Total votes | 166,119 | 100 | -41.6 | ||
| Party | Candidate | Votes | % | ±% | |
|---|---|---|---|---|---|
| Democratic | Brian Higgins (incumbent) | 215,289 | 74.6 | +6.5 | |
| Republican | Shelly Schratz | 73,377 | 25.4 | −6.5 | |
| Majority | 141,912 | 50.2 | +14.0 | ||
| Total votes | 288,666 | 100 | +73.4 | ||
| Party | Candidate | Votes | % | |
|---|---|---|---|---|
| Democratic | Brian Higgins | 156,968 | 68.0 | |
| Working Families | Brian Higgins | 8,929 | 3.9 | |
| Women's Equality | Brian Higgins | 3,269 | 1.4 | |
| Total | Brian Higgins (incumbent) | 169,166 | 73.3 | |
| Republican | Renee Zeno | 61,488 | 26.7 | |
| Total votes | 230,654 | 100.0 | ||
| Democratic hold | ||||
| Party | Candidate | Votes | % | |
|---|---|---|---|---|
| Democratic | Brian Higgins | 202,315 | 63.3 | |
| Working Families | Brian Higgins | 20,304 | 6.4 | |
| SAM | Brian Higgins | 657 | 0.2 | |
| Total | Brian Higgins (incumbent) | 223,276 | 69.9 | |
| Republican | Ricky Donovan | 91,687 | 28.7 | |
| Green | Michael Raleigh | 4,628 | 1.4 | |
| Total votes | 319,591 | 100.0 | ||
| Democratic hold | ||||
See also
- List of United States congressional districts
- New York's congressional districts
- United States congressional delegations from New York
Notes
- ^ "My Congressional District".
- ^ "Introducing the 2021 Cook Political Report Partisan Voter Index". The Cook Political Report. April 15, 2021. Retrieved April 15, 2021.
- ^ "Current Vacancies". Office of the Clerk, U.S. House of Representatives.
- ^ "Associated Press News". AP News.
References
- Martis, Kenneth C. (1989). The Historical Atlas of Political Parties in the United States Congress. New York: Macmillan Publishing Company.
- Martis, Kenneth C. (1982). The Historical Atlas of United States Congressional Districts. New York: Macmillan Publishing Company.
- "Congressional Biographical Directory of the United States 1774–present". United States Congress.
- "1996 House election data". Clerk of the United States House of Representatives. Archived from the original on January 26, 2006. Retrieved August 27, 2006.
- "1998 House election data". Clerk of the United States House of Representatives. Archived from the original on September 1, 2006. Retrieved August 27, 2006.
- "2000 House election data". Clerk of the United States House of Representatives. Archived from the original on September 29, 2006. Retrieved August 27, 2006.
- "2002 House election data". Clerk of the United States House of Representatives. Archived from the original on August 31, 2006. Retrieved August 27, 2006.
- "2004 House election data". Clerk of the United States House of Representatives. Archived from the original on September 1, 2006. Retrieved August 27, 2006.


