
Ohio's 11th congressional district
| Ohio's 11th congressional district | |||
|---|---|---|---|
 Ohio's 11th congressional district since January 3, 2013 | |||
| Representative |
| ||
| Distribution |
| ||
| Population (2016) | 692,226[1] | ||
| Median household income | $35,954[2] | ||
| Ethnicity |
| ||
| Cook PVI | D+32[3] | ||
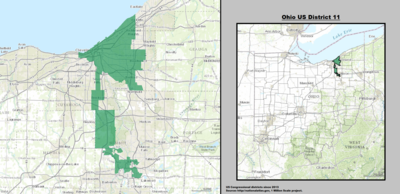
Ohio's 11th congressional district is represented by Representative Marcia Fudge, a Democrat, having been elected after the death of Stephanie Tubbs Jones. This district includes most of the majority-black precincts between Cleveland and Akron, as well as it has the largest population of Jewish residents of Ohio's congressional districts.
Ohio has had at least 11 congressional districts since the 1820 Census. The district's current configuration dates from the 1990 Census, when most of the old 21st District was combined with portions of the old 20th District to form the new 11th District. Much of Akron was added to the district when the congressional map was redrawn after the 2010 Census, when Ohio lost two seats in the House of Representatives.
With a Cook Partisan Voting Index of D+32, it is the most Democratic district in Ohio and the 19th most Democratic district in the nation.
It was one of several districts challenged in a 2018 lawsuit seeking to overturn Ohio's congressional map due to alleged unconstitutional gerrymandering.[4] The lawsuit describes the 11th as "a detached shoulder blade with a robotic arm" extending from Cleveland to Akron.[5]
Recent history
Rep. Stephanie Tubbs Jones served from 1999 through August 20, 2008, when she died in office. Ohio Governor Ted Strickland ordered a special election on November 18, 2008 to fill the remaining month of Jones' term. In addition, the seat was up for election during the November 4, 2008 general election, with the winner of that election to serve a full term beginning January 6, 2009. Marcia L. Fudge, the mayor of Warrensville Heights, just east of Cleveland, won both the general and special elections and was sworn in on November 19, 2008.
Election results from presidential races
| Year | Office | Result |
|---|---|---|
| 2000 | President | Al Gore 79% - George W. Bush 18% |
| 2004 | President | John Kerry 81% - George W. Bush 18% |
| 2008 | President | Barack Obama 82% - John McCain 17.2% |
| 2012 | President | Barack Obama 82.7% - Mitt Romney 16.5% |
| 2016 | President | Hillary Clinton 80.5% - Donald Trump 17.0% |
List of members representing the district
District created March 4, 1823.


Election results
This is an incomplete list of historic election results. Bold type indicates victor. Italic type indicates incumbent.
Historical district boundaries

See also
References
- ^ https://www.census.gov/mycd/?st=39&cd=11
- ^ https://www.census.gov/mycd/?st=39&cd=11
- ^ "Partisan Voting Index – Districts of the 115th Congress" (PDF). The Cook Political Report. April 7, 2017. Retrieved April 7, 2017.
- ^ Todd Ruger, "Voters Challenge Ohio Congressional Map as Partisan Gerrymander", Roll Call, May 23, 2018. Retrieved 7 August 2018.
- ^ Ohio A. Philip Randolph Institute et al., v. John Kasich, UNITED STATES DISTRICT COURT FOR THE SOUTHERN DISTRICT OF OHIO, filed 05/23/2018. Retrieved 7 August 2018.
- ^ Special election November 18, 2008 to fill remainder of term through January 3, 2009
- ^ "2012 Election Results". Ohio Secretary of State.
- Martis, Kenneth C. (1989). The Historical Atlas of Political Parties in the United States Congress. New York: Macmillan Publishing Company.
{{cite book}}: Cite has empty unknown parameter:|coauthors=(help) - Martis, Kenneth C. (1982). The Historical Atlas of United States Congressional Districts. New York: Macmillan Publishing Company.
{{cite book}}: Cite has empty unknown parameter:|coauthors=(help) - Congressional Biographical Directory of the United States 1774–present