Illinois's 5th congressional district
| Illinois's 5th congressional district | |
|---|---|
 Illinois's 5th congressional district since January 3, 2013 | |
| Representative | |
| Area | 96 sq mi (250 km2) |
| Distribution |
|
| Population (2018 est.) | 743,699 |
| Median household income | $87,326[1] |
| Ethnicity |
|
| Cook PVI | D+20[2][3] |
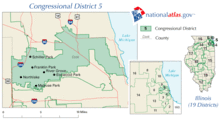
The 5th congressional district of Illinois covers parts of Cook and DuPage counties, as of the 2011 redistricting which followed the 2010 census. All or parts of Chicago, Elmhurst, Elmwood Park, Franklin Park, Hinsdale, La Grange Park, Norridge, Northlake, River Grove, Schiller Park, and Oakbrook Terrace are included.[4]
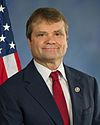
It has been represented by Democrat Mike Quigley since a special election in April 2009.
History
The district was created as part of the 28th United States Congress, which first met on March 4, 1843; it was initially represented by Stephen A. Douglas, whose Kansas–Nebraska Act prompted the creation of the Republican Party. Since the 1990s redistricting, it has covered most of Chicago's North Side; the 2010 redistricting extended it into DuPage County.
It was represented by Democrat Rahm Emanuel from January 2003 until he resigned on January 2, 2009, to become White House Chief of Staff. On April 8, 2009, Mike Quigley won a special election to fill the seat.[5]
George W. Bush received 33% of the vote in this district in 2004.[citation needed] The district has a Cook Partisan Voting Index score of D +20.[6] Despite its recent historical preference for Democrats, the district was represented by a Republican for two years after Dan Rostenkowski lost his seat because of the Congressional Post Office scandal. On a national level, the scandal helped prompt the Republican Revolution of 1994.
Emanuel's predecessor was Rod Blagojevich, who was elected Governor in 2002. Blagojevich was impeached, convicted, and removed from office by the Illinois legislature in 2009. He was convicted in 2010 of one count of lying to federal investigators.
Mike Quigley was challenged for the seat by Republican nominee David Ratowitz and Green Party nominee Matt Reichel in the 2010 congressional elections.
Recent election results
Presidential elections
| Year | Result |
| 2000 | Gore 63–33% |
| 2004 | Kerry 67–33% |
| 2008 | Obama 70–29%[3] |
| 2012 | Obama 66–32%[3] |
| 2016 | Clinton 71–24% |
List of members representing the district
Historical district boundaries
See also
- Illinois's congressional districts
- List of United States congressional districts
- United States congressional delegations from Illinois
- Political history of Chicago
References
- ^ a b https://www.census.gov/mycd/?st=17&cd=05
- ^ "Partisan Voting Index – Districts of the 115th Congress" (PDF). The Cook Political Report. April 7, 2017. Retrieved April 7, 2017.
- ^ a b c Barone, Michael; McCutcheon, Chuck (2013). The Almanac of American Politics 2014. Chicago: University of Chicago Press. p. 564. ISBN 978-0-226-10544-4. Copyright National Journal.
- ^ Illinois Congressional District 5, Illinois Board of Elections
- ^ "Topic Galleries". Chicago Tribune.
- ^ "Cook Political Report, PVI for the 110th Congress" (PDF). Cook Political Report. Archived from the original (PDF) on 2008-11-26. Retrieved 2008-10-08.
- Martis, Kenneth C. (1989). The Historical Atlas of Political Parties in the United States Congress. New York: Macmillan Publishing Company.
{{cite book}}: Cite has empty unknown parameter:|coauthors=(help) - Martis, Kenneth C. (1982). The Historical Atlas of United States Congressional Districts. New York: Macmillan Publishing Company.
{{cite book}}: Cite has empty unknown parameter:|coauthors=(help) - Congressional Biographical Directory of the United States 1774–present
External links
- District Fact Sheet from the U.S. Census Bureau

