
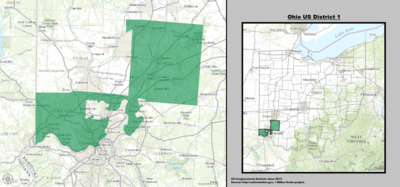
Ohio's 1st congressional district
| Ohio's 1st congressional district | |||
|---|---|---|---|
 Ohio's 1st congressional district since January 3, 2013 | |||
| Representative |
| ||
| Distribution |
| ||
| Population (2016) | 739,216[1] | ||
| Median household income | $59,719[1] | ||
| Ethnicity |
| ||
| Cook PVI | R+5[2] | ||
Ohio's 1st congressional district is represented by Republican Steve Chabot. This district includes the western four-fifths of Cincinnati, and borders both Kentucky and Indiana. This district was once represented by President William Henry Harrison.
Cities
- Cincinnati (partial)
- Springboro (partial)
- Cheviot
- Forest Park
- Franklin
- Harrison
- Indian Hill
- Springdale
- St. Bernard
- Mason
- Lebanon
- Sharonville
- Middletown (partial)
- Carlisle
List of members representing the district


.png)


_001.png)


Recent election results
| Year | Democratic | Republican | Other |
|---|---|---|---|
| 1920 | John H. Allen: 40,195 | √ Nicholas Longworth (Incumbent): 57,328 | Edward L. Hutchins (FL): 926 Eli G. Frankenstein: 1,134 |
| 1922 | Sidney G. Stricker: 30,945 | √ Nicholas Longworth (Incumbent): 45,253 | Edward L. Hutchins (FL): 3,094 |
| 1924 | Thomas B. Paxton: 36,065 | √ Nicholas Longworth (Incumbent): 58,125 | |
| 1926 | John C. Rogers: 26,511 | √ Nicholas Longworth (Incumbent): 45,317 | Edward D. Colley: 268 |
| 1928 | Arthur Espy: 49,880 | √ Nicholas Longworth (Incumbent): 80,812 | |
| 1930 | John W. Pattison: 46,974 | √ Nicholas Longworth (Incumbent): 50,481 | |
| 1932 | Edward H. Brink: 55,416 | √ John B. Hollister (Incumbent): 66,018 | |
| 1934 | Edwin G. Becker: 42,723 | √ John B. Hollister (Incumbent): 53,985 | |
| 1936 | √ Joseph A. Dixon: 71,935 | John B. Hollister (Incumbent): 66,082 | |
| 1938 | Joseph A. Dixon (Incumbent): 45,536 | √ Charles H. Elston: 63,285 | |
| 1940 | Joseph A. Dixon: 61,382 | √ Charles H. Elston (Incumbent): 84,622 | |
| 1942 | William H. Hessler: 33,884 | √ Charles H. Elston (Incumbent): 54,120 | |
| 1944 | Frank J. Richter: 62,617 | √ Charles H. Elston (Incumbent): 82,373 | |
| 1946 | G. Andrews Espy: 40,594 | √ Charles H. Elston (Incumbent): 72,909 | |
| 1948 | Morse Johnson: 69,240 | √ Charles H. Elston (Incumbent): 73,952 | |
| 1950 | Rollin H. Everett: 53,760 | √ Charles H. Elston (Incumbent): 77,507 | |
| 1952 | Walter A. Kelly: 60,015 | √ Gordon H. Scherer: 96,385 | |
| 1954 | Mrs. Warwick B. Hobart: 39,421 | √ Gordon H. Scherer (Incumbent): 71,042 | |
| 1956 | Leonard D. Slutz: 49,701 | √ Gordon H. Scherer (Incumbent): 91,181 | |
| 1958 | W. Ted Osborne: 54,119 | √ Gordon H. Scherer (Incumbent): 70,686 | |
| 1960 | W. Ted Osborne: 62,043 | √ Gordon H. Scherer (Incumbent): 88,899 | |
| 1962 | Monica Nolan: 44,264 | √ Carl W. Rich: 74,320 | |
| 1964 | √ John J. Gilligan: 74,525 | Carl W. Rich (Incumbent): 69,114 | |
| 1966 | John J. Gilligan (Incumbent): 62,580 | √ Robert Taft Jr.: 70,366 | |
| 1968 | Carl F. Heiser: 49,830 | √ Robert Taft Jr. (Incumbent): 102,219 | |
| 1970 | Bailey W. Turner: 39,820 | √ William J. Keating: 89,169 | |
| 1972 | Carl F. Heiser: 50,575 | √ William J. Keating (Incumbent): 119,469 | |
| 1974 | Thomas A. Luken (Incumbent): 67,685 | √ Willis D. Gradison Jr.: 70,284 | |
| 1976 | William F. Bowen: 56,995 | √ Willis D. Gradison Jr. (Incumbent): 109,789 | Christopher L. Martinson: 2,732 |
| 1978 | Timothy M. Burke: 38,669 | √ Willis D. Gradison Jr. (Incumbent): 73,593 | Joseph E. May: 1,907 |
| 1980 | Donald J. Zwick: 38,529 | √ Willis D. Gradison Jr. (Incumbent): 124,080 | Scott A. Breen: 3,571 |
| 1982 | √ Thomas A. Luken (Incumbent): 99,143 | John E. Held: 52,658 | Jim Berms (L): 4,386 |
| 1984 | √ Thomas A. Luken (Incumbent): 121,577 | Norman A. Murdock: 88,859 | Other: 10,222 |
| 1986 | √ Thomas A. Luken (Incumbent): 90,477 | Fred E. Morr: 56,100 | |
| 1988 | √ Thomas A. Luken (Incumbent): 117,628 | Steve Chabot: 90,738 | |
| 1990 | √ Charles J. Luken: 83,932 | Ken Blackwell: 80,362 | |
| 1992 | √ David S. Mann: 120,190 | Stephen Grote: 101,498 | Jim Berns: 12,734 |
| 1994 | David S. Mann (Incumbent): 72,822 | √ Steve Chabot: 92,997 | |
| 1996 | Mark P. Longabaugh: 94,719 | √ Steve Chabot (Incumbent): 118,324 | John G. Halley (N): 5,381 |
| 1998 | Roxanne Qualls: 82,003 | √ Steve Chabot (Incumbent): 92,421 | |
| 2000 | John Cranley: 98,328 | √ Steve Chabot (Incumbent): 116,768 | David A. Groshoff (L): 3,399 Richard L. Stevenson (N): 1,933 |
| 2002 | Greg Harris: 60,168 | √ Steve Chabot (Incumbent): 110,760 | |
| 2004 | Greg Harris: 116,320 | √ Steve Chabot (Incumbent): 167,991 | |
| 2006 | John Cranley: 90,963 | √ Steve Chabot (Incumbent): 101,838 | |
| 2008[3] | √ Steve Driehaus: 155,089 | Steve Chabot (Incumbent): 140,469 | Eric Wilson: 84, Rich Stevenson: 67 |
| 2010 | Steve Driehaus (Incumbent): 92,672 | √ Steve Chabot: 103,770 | Jim Berns: 3,076, Rich Stevenson: 2000 |
| 2012[4] | Jeff Sinnard: 131,490 | √ Steve Chabot (Incumbent): 201,907 | Jim Berns (L) : 9,674 Rich Stevenson (G) : 6,654 |
| 2014[5] | Fred Kundrata: 72,604 | √ Steve Chabot (Incumbent): 124,779 | |
| 2016[6] | Michele Young: 144,644 | √ Steve Chabot (Incumbent): 210,014 | |
| 2018[7] | Aftab Pureval: 141,118 | √ Steve Chabot (Incumbent): 154,409 | Dirk Kubala (L): 5,339 |
2010
| Party | Candidate | Votes | % | |||
|---|---|---|---|---|---|---|
| Republican | Steve Chabot | 103,770 | 51.49 | |||
| Democratic | Steve Driehaus (Incumbent) | 92,672 | 45.99 | |||
| Libertarian | Jim Berns | 3,076 | 1.53 | |||
| Green | Rich Stevenson | 2,000 | 0.99 | |||
| Total votes | 201,518 | 100.00 | ||||
| Turnout | ||||||
| Republican gain from Democratic | ||||||
Source: "Representative to Congress: November 2, 2010". Ohio Secretary of State. Archived from the original on December 27, 2010. Retrieved April 1, 2011.
Competitiveness
Election results from presidential races:
| Year | Office | Results |
|---|---|---|
| 2000 | President | George W. Bush 51 - Al Gore 46% |
| 2004 | President | George W. Bush 51 - John Kerry 49% |
| 2008 | President | Barack Obama 55 - John McCain 44% |
| 2012 | President | Mitt Romney 52 - Barack Obama 46% |
| 2016 | President | Donald Trump 51 - Hillary Clinton 45% |
Historical district boundaries

See also
References
- Martis, Kenneth C. (1989). The Historical Atlas of Political Parties in the United States Congress. New York: Macmillan Publishing Company.
{{cite book}}: Cite has empty unknown parameter:|coauthors=(help) - Martis, Kenneth C. (1982). The Historical Atlas of United States Congressional Districts. New York: Macmillan Publishing Company.
{{cite book}}: Cite has empty unknown parameter:|coauthors=(help) - Congressional Biographical Directory of the United States 1774–present
- ^ a b c https://www.census.gov/mycd/?st=39&cd=01
- ^ "Partisan Voting Index – Districts of the 115th Congress" (PDF). The Cook Political Report. April 7, 2017. Retrieved April 7, 2017.
- ^ "2008 Election Results". Ohio Secretary of State.
- ^ "2012 Election Results". Ohio Secretary of State.
- ^ [1] Ohio Secretary of State. Retrieved February 27, 2015
- ^ https://ballotpedia.org/Ohio%27s_1st_Congressional_District
- ^ "2018 Election Results". Ohio Secretary of State.