| Representative
|
Party
|
Years
|
Cong
ress
|
Electoral history
|
District location
|
| District established March 4, 1843
|
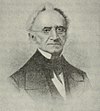
Henry Y. Cranston
(Newport)
|
Law and Order
|
March 4, 1843 –
March 3, 1845
|
28th
29th
|
Elected in 1843.
Re-elected in 1845.
Retired.
|
1843–1863
[data missing]
|
| Whig
|
March 4, 1845 –
March 3, 1847
|
Robert B. Cranston
(Newport)
|
Whig
|
March 4, 1847 –
March 3, 1849
|
30th
|
Elected in 1847.
Retired.
|
George Gordon King
(Newport)
|
Whig
|
March 4, 1849 –
March 3, 1853
|
31st
32nd
|
Elected in 1849.
Re-elected in 1851.
Lost re-election.
|
Thomas Davis
(Providence)
|
Democratic
|
March 4, 1853 –
March 3, 1855
|
33rd
|
Elected in 1853.
Lost re-election.
|

Nathan B. Durfee
(Tiverton)
|
American
|
March 4, 1855 –
March 3, 1857
|
34th
35th
|
Elected in 1855.
Re-elected in 1857.
Retired.
|
| Republican
|
March 4, 1857 –
March 3, 1859
|
Christopher Robinson
(Woonsocket)
|
Republican
|
March 4, 1859 –
March 3, 1861
|
36th
|
Elected in 1859.
Lost re-election.
|

William Paine Sheffield
(Newport)
|
Unionist
|
March 4, 1861 –
March 3, 1863
|
37th
|
Elected in 1861.
Retired.
|

Thomas Jenckes
(Providence)
|
Republican
|
March 4, 1863 –
March 3, 1871
|
38th
39th
40th
41st
|
Elected in 1863.
Re-elected in 1865.
Re-elected in 1867.
Re-elected in 1868.
Lost re-election.
|
1863–1875
[data missing]
|

Benjamin T. Eames
(Providence)
|
Republican
|
March 4, 1871 –
March 3, 1879
|
42nd
43rd
44th
45th
|
Elected in 1870.
Re-elected in 1872.
Re-elected in 1874.
Re-elected in 1876.
Retired.
|
1875–1883
[data missing]
|

Nelson W. Aldrich
(Providence)
|
Republican
|
March 4, 1879 –
October 4, 1881
|
46th
|
Elected in 1878.
Re-elected in 1880.
Resigned when elected U.S. senator.
|
| Vacant
|
October 4, 1881 –
December 5, 1881
|
|

Henry J. Spooner
(Providence)
|
Republican
|
December 5, 1881 –
March 3, 1891
|
46th
47th
48th
49th
50th
51st
|
Elected to finish Aldrich's term.
Re-elected in 1882.
Re-elected in 1884.
Re-elected in 1886.
Re-elected in 1888.
Lost re-election.
|
1883–1913
[data missing]
|

Oscar Lapham
(Providence)
|
Democratic
|
March 4, 1891 –
March 3, 1895
|
52nd
53rd
|
Elected in 1890.
Re-elected in 1892.
Lost re-election.
|

Melville Bull
(Middletown)
|
Republican
|
March 4, 1895 –
March 3, 1903
|
54th
55th
56th
57th
|
Elected in 1894.
Re-elected in 1896.
Re-elected in 1898.
Re-elected in 1900.
Lost re-election.
|

Daniel L.D. Granger
(Providence)
|
Democratic
|
March 4, 1903 –
February 14, 1909
|
58th
59th
60th
|
Elected in 1902.
Re-elected in 1904.
Re-elected in 1906.
Lost re-election and died.
|
| Vacant
|
February 14, 1909 –
March 3, 1909
|
60th
|
|

William Paine Sheffield
(Newport)
|
Republican
|
March 4, 1909 –
March 3, 1911
|
61st
|
Elected in 1908.
Lost re-election.
|

George F. O'Shaunessy
(Providence)
|
Democratic
|
March 4, 1911 –
March 3, 1919
|
62nd
63rd
64th
65th
|
Elected in 1910.
Re-elected in 1912.
Re-elected in 1914.
Re-elected in 1916.
Lost re-election.
|
1913–1931
[data missing]
|

Clark Burdick
(Newport)
|
Republican
|
March 4, 1919 –
March 3, 1933
|
66th
67th
68th
69th
70th
71st
72nd
|
Elected in 1918.
Re-elected in 1920.
Re-elected in 1922.
Re-elected in 1924.
Re-elected in 1926.
Re-elected in 1928.
Re-elected in 1930.
Lost re-election.
|
1931–1933
[data missing]
|

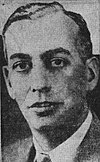
Francis Condon
(Central Falls)
|
Democratic
|
March 4, 1933 –
January 10, 1935
|
73rd
|
Redistricted from the 3rd district and re-elected in 1932.
Re-elected in 1934.
Resigned to join the Rhode Island Supreme Court.
|
1933–1965
[data missing]
|
| Vacant
|
January 10, 1935 –
August 6, 1935
|
73rd
74th
|
|
Charles Risk
(Saylesville)
|
Republican
|
August 6, 1935 –
January 3, 1937
|
74th
|
Elected to finish Condon's term.
Lost re-election.
|

Aime Forand
(Central Falls)
|
Democratic
|
January 3, 1937 –
January 3, 1939
|
75th
|
Elected in 1936.
Lost re-election.
|
Charles Risk
(Saylesville)
|
Republican
|
January 3, 1939 –
January 3, 1941
|
76th
|
Elected in 1938.
Lost re-election.
|
Aime Forand
(Cumberland)
|
Democratic
|
January 3, 1941 –
January 3, 1961
|
77th
78th
79th
80th
81st
82nd
83rd
84th
85th
86th
|
Elected in 1940.
Re-elected in 1942.
Re-elected in 1944.
Re-elected in 1946.
Re-elected in 1948.
Re-elected in 1950.
Re-elected in 1952.
Re-elected in 1954.
Re-elected in 1956.
Re-elected in 1958.
Retired.
|

Fernand St. Germain
(Woonsocket)
|
Democratic
|
January 3, 1961 –
January 3, 1989
|
87th
88th
89th
90th
91st
92nd
93rd
94th
95th
96th
97th
98th
99th
100th
|
Elected in 1960.
Re-elected in 1962.
Re-elected in 1964.
Re-elected in 1966.
Re-elected in 1968.
Re-elected in 1970.
Re-elected in 1972.
Re-elected in 1974.
Re-elected in 1976.
Re-elected in 1978.
Re-elected in 1980.
Re-elected in 1982.
Re-elected in 1984.
Re-elected in 1986.
Lost re-election.
|
1965–1973
[data missing]
|
1973–1983
[data missing]
|
1983–1993
Bristol and Newport; part of Providence
|

Ronald Machtley
(Portsmouth)
|
Republican
|
January 3, 1989 –
January 3, 1995
|
101st
102nd
103rd
|
Elected in 1988.
Re-elected in 1990.
Re-elected in 1992.
Retired to run for Governor of Rhode Island.
|
1993–2003
Bristol and Newport; part of Providence
|

Patrick J. Kennedy
(Providence)
|
Democratic
|
January 3, 1995 –
January 3, 2011
|
104th
105th
106th
107th
108th
109th
110th
111th
|
Elected in 1994.
Re-elected in 1996.
Re-elected in 1998.
Re-elected in 2000.
Re-elected in 2002.
Re-elected in 2004.
Re-elected in 2006.
Re-elected in 2008.
Retired.
|
2003–2013

Bristol and Newport; part of Providence
|

David Cicilline
(Providence)
|
Democratic
|
January 3, 2011 –
May 31, 2023
|
112th
113th
114th
115th
116th
117th
118th
|
Elected in 2010.
Re-elected in 2012.
Re-elected in 2014.
Re-elected in 2016.
Re-elected in 2018.
Re-elected in 2020.
Re-elected in 2022.
Resigned.[6]
|
2013–2023
Bristol and Newport; part of Providence
|
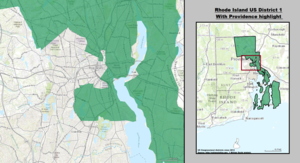
2023–present

Bristol and Newport; part of Providence
|
| Vacant
|
May 31, 2023 –
November 13, 2023
|
118th
|
|

Gabe Amo
(Providence)
|
Democratic
|
November 13, 2023 –
present
|
118th
|
Elected to finish Cicilline's term.
|

.svg)

.jpg)


.jpg)
.jpg)
.jpg)

.jpg)


.jpg)
.jpg)


.jpg)


