Erie County, Ohio: Difference between revisions
| Line 39: | Line 39: | ||
==Demographics== |
==Demographics== |
||
==Demographics== |
|||
{{USCensusPop |
|||
|1840=12599 |
|||
|1850=18568 |
|||
|1860=24474 |
|||
|1870=28188 |
|||
|1880=32640 |
|||
|1890=35462 |
|||
|1900=37650 |
|||
|1910=38327 |
|||
|1920=39789 |
|||
|1930=42133 |
|||
|1940=43201 |
|||
|1950=52565 |
|||
|1960=68000 |
|||
|1970=75909 |
|||
|1980=79655 |
|||
|1990=76779 |
|||
|2000=79551 |
|||
|estimate=77323 |
|||
|estyear=2007 |
|||
|footnote=Population 1820-2007.<ref name="odod"/> |
|||
}} |
|||
As of the [[census]]{{GR|2}} of 2000, there were 79,551 people, 31,727 households, and 21,764 families residing in the county. The [[population density]] was 312 people per square mile (121/km²). There were 35,909 housing units at an average density of 141 per square mile (54/km²). The racial makeup of the county was 88.64% [[Race (United States Census)|White]], 8.64% [[Race (United States Census)|Black]] or [[Race (United States Census)|African American]], 0.21% [[Race (United States Census)|Native American]], 0.37% [[Race (United States Census)|Asian]], 0.01% [[Race (United States Census)|Pacific Islander]], 0.53% from [[Race (United States Census)|other races]], and 1.60% from two or more races. 2.09% of the population were [[Race (United States Census)|Hispanic]] or [[Race (United States Census)|Latino]] of any race. 35.7% were of [[germans|German]], 9.2% [[irish people|Irish]], 8.2% [[english people|English]], 8.1% [[italians|Italian]] and 7.8% [[united states|American]] ancestry according to [[Census 2000]]. |
As of the [[census]]{{GR|2}} of 2000, there were 79,551 people, 31,727 households, and 21,764 families residing in the county. The [[population density]] was 312 people per square mile (121/km²). There were 35,909 housing units at an average density of 141 per square mile (54/km²). The racial makeup of the county was 88.64% [[Race (United States Census)|White]], 8.64% [[Race (United States Census)|Black]] or [[Race (United States Census)|African American]], 0.21% [[Race (United States Census)|Native American]], 0.37% [[Race (United States Census)|Asian]], 0.01% [[Race (United States Census)|Pacific Islander]], 0.53% from [[Race (United States Census)|other races]], and 1.60% from two or more races. 2.09% of the population were [[Race (United States Census)|Hispanic]] or [[Race (United States Census)|Latino]] of any race. 35.7% were of [[germans|German]], 9.2% [[irish people|Irish]], 8.2% [[english people|English]], 8.1% [[italians|Italian]] and 7.8% [[united states|American]] ancestry according to [[Census 2000]]. |
||
Revision as of 17:12, 10 November 2009
Erie County | |
|---|---|
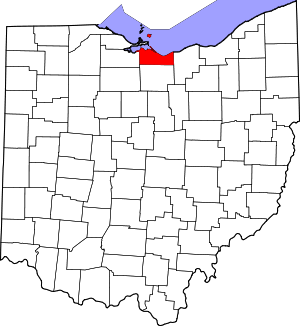
 Location within the U.S. state of Ohio | |
 Ohio's location within the U.S. | |
| Coordinates: 41°31′N 82°37′W / 41.51°N 82.61°W | |
| Country | |
| State | |
| Founded | March 16, 1838[1] |
| Named for | the Erie (tribe) |
| Seat | Sandusky |
| Largest city | Sandusky |
| Area | |
| • Total | 626 sq mi (1,622 km2) |
| • Land | 255 sq mi (660 km2) |
| • Water | 371 sq mi (962 km2) 59.29% |
| Population (2000) | |
| • Total | 79,551 |
| • Density | 312/sq mi (121/km2) |
| Time zone | UTC−5 (Eastern) |
| • Summer (DST) | UTC−4 (EDT) |
| Website | www |
Erie County is a county located in the state of Ohio, United States. As of 2000, the population was 79,551. Its county seat is SanduskyTemplate:GR and is named for the Erie (tribe), whose name was their word for "wildcat".[2] It is home to the popular amusement park Cedar Point. It was formed in 1838 from the northern third of Huron County, and a portion of Sandusky County. It is part of the Sandusky Metropolitan Statistical Area which encompasses all of Erie County.
Erie County was designated a Metropolitan Statistical Area with Sandusky as its principal city in 2003.[3]
Geography
According to the U.S. Census Bureau, the county has a total area of 626 square miles (1,622 km²).255 square miles (660 km²) of it is land and 371 square miles (962 km²) of it (59.29%) is water.
Adjacent counties
- Across Lake Erie lies Essex County and Chatham-Kent, Ontario, Canada (north)
- Lorain County (east)
- Huron County (south)
- Sandusky County (west)
- Ottawa County (northwest, connected by the Thomas A. Edison Memorial Bridge)
Demographics
Demographics
| Census | Pop. | Note | %± |
|---|---|---|---|
| 1840 | 12,599 | — | |
| 1850 | 18,568 | 47.4% | |
| 1860 | 24,474 | 31.8% | |
| 1870 | 28,188 | 15.2% | |
| 1880 | 32,640 | 15.8% | |
| 1890 | 35,462 | 8.6% | |
| 1900 | 37,650 | 6.2% | |
| 1910 | 38,327 | 1.8% | |
| 1920 | 39,789 | 3.8% | |
| 1930 | 42,133 | 5.9% | |
| 1940 | 43,201 | 2.5% | |
| 1950 | 52,565 | 21.7% | |
| 1960 | 68,000 | 29.4% | |
| 1970 | 75,909 | 11.6% | |
| 1980 | 79,655 | 4.9% | |
| 1990 | 76,779 | −3.6% | |
| 2000 | 79,551 | 3.6% | |
| 2007 (est.) | 77,323 | ||
| Population 1820-2007.[1] | |||
As of the censusTemplate:GR of 2000, there were 79,551 people, 31,727 households, and 21,764 families residing in the county. The population density was 312 people per square mile (121/km²). There were 35,909 housing units at an average density of 141 per square mile (54/km²). The racial makeup of the county was 88.64% White, 8.64% Black or African American, 0.21% Native American, 0.37% Asian, 0.01% Pacific Islander, 0.53% from other races, and 1.60% from two or more races. 2.09% of the population were Hispanic or Latino of any race. 35.7% were of German, 9.2% Irish, 8.2% English, 8.1% Italian and 7.8% American ancestry according to Census 2000.
There were 31,727 households out of which 30.40% had children under the age of 18 living with them, 53.70% were married couples living together, 11.20% had a female householder with no husband present, and 31.40% were non-families. 27.00% of all households were made up of individuals and 10.80% had someone living alone who was 65 years of age or older. The average household size was 2.45 and the average family size was 2.97.
In the county the population was spread out with 24.70% under the age of 18, 7.20% from 18 to 24, 27.00% from 25 to 44, 25.50% from 45 to 64, and 15.60% who were 65 years of age or older. The median age was 40 years. For every 100 females there were 95.00 males. For every 100 females age 18 and over, there were 92.40 males.
The median income for a household in the county was $42,746, and the median income for a family was $51,756. Males had a median income of $39,249 versus $23,697 for females. The per capita income for the county was $21,530. About 6.00% of families and 8.30% of the population were below the poverty line, including 11.60% of those under age 18 and 6.80% of those age 65 or over.
In 2008, the Census Bureau announced that the county's population had declined to an estimated 77,323 by July 1, 2007.[4]
Government

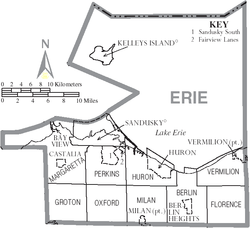
Communities

Cities
Villages
Townships
Census-designated places
Other communities
|
|
|
|
Places of Interest
School Districts
All or part of eleven school districts serve Erie County and its residents:
- Bellevue City School District: includes parts of Bellevue and Groton Township.
- Berlin-Milan Local School District: includes parts of Berlin Heights and Milan, and Berlin, Florence, Huron, Milan, Oxford, Perkins, and Vermilion Townships.
- Firelands Local School District: includes parts of Florence Township.
- Huron City School District: includes parts of Huron and Berlin, Huron, and Milan Townships.
- Kelleys Island Local School District: includes all of Kelleys Island.
- Margaretta Local School District: includes parts of Bay View and Castalia, and Groton and Margaretta Townships.
- Monroeville Local School District: includes parts of Oxford Township.
- Perkins Local School District: includes parts of Groton, Huron, Margaretta, Milan, Oxford, and Perkins Townships.
- Sandusky Central Catholic Schools: includes Sandusky's three Parishes (St. Mary, Ss. Peter & Paul, and Holy Angels).
- St. Peter's School: a private catholic elementary school in Huron
- Sandusky City School District: includes all of Sandusky.
- Vermilion Local School District: includes parts of Vermilion and Florence and Vermilion Townships.
- Western Reserve Local School District: including parts of Florence Township.
References
- ^ a b "Ohio County Profiles: Erie County" (PDF). Ohio Department of Development. Retrieved 2007-04-28.
- ^ "Erie County data". Ohio State University Extension Data Center. Retrieved 2007-04-28.
- ^ "Metropolitan Statistical Areas and Components, 2003" (TXT). Metropolitan statistical areas defined by Office of Management and Budget, June 6, 2003. United States Census Bureau, Population Division. 2003-07-10. Retrieved 2009-02-07.
{{cite web}}: Check date values in:|date=(help) - ^ "Annual Estimates of the Population of Metropolitan and Micropolitan Statistical Areas: April 1, 2000 to July 1, 2007 (CBSA-EST2007-01)" (CSV). 2007 Population Estimates. United States Census Bureau, Population Division. 2008-03-27. Retrieved 2009-02-07.
{{cite web}}: Check date values in:|date=(help)

