List of United States cities by population
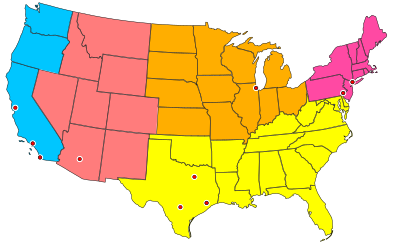
The following is a list of the most populous incorporated places in the United States. As defined by the United States Census Bureau, an "incorporated place" includes a variety of designations, including a city, town, village, borough, and municipality.[a] Some census-designated places may also be included in the Census Bureau's listing of incorporated places.[b][c] Consolidated city-counties represent a distinct type of government that includes the entire population of a county, or county equivalent. Some consolidated city-counties, however, include multiple incorporated places. This list presents only that portion (or "balance") of such consolidated city-counties that are not a part of another incorporated place.
Note that this list refers only to the population of individual municipalities within their defined limits, which does not include other municipalities or unincorporated suburban areas within urban agglomerations. A different ranking is evident when considering U.S. metropolitan area populations.
Incorporated places over 100,000 population
The following table lists the incorporated places in the United States with a population on April 1, 2010, of more than 100,000 as counted in the 2010 United States Census.[1] Land area and population density are also provided to the nearest tenth to give a general idea of how densely packed each city is. Since the U.S. Census Bureau typically does not rank the cities of U.S. territories along with those of the fifty states and the District of Columbia, the cities of Puerto Rico with populations greater than 100,000 are listed separately below. Capital cities are bolded.
| Rank | City | State | Population (2010) |
Land Area (square miles, 2010 data) |
Population Density (per square mile of land area, 2010 data) |
|---|---|---|---|---|---|
| 1 | New York | New York | 8,175,133 | 302.6 | 27,016.3 |
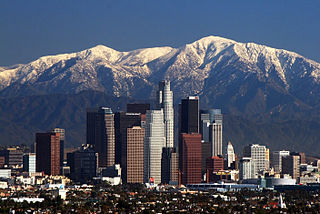
| 2 | Los Angeles | California | 3,792,621 | 468.7 | 8,091.8 |
| 3 | Chicago | Illinois | 2,695,598 | 227.6 | 11,843.6 |
| 4 | Houston | Texas | 2,099,451 | 599.6 | 3,501.4 |
| 5 | Philadelphia | Pennsylvania | 1,526,006 | 134.1 | 11,379.6 |
| 6 | Phoenix | Arizona | 1,445,632 | 516.7 | 2,797.8 |
| 7 | San Antonio | Texas | 1,327,407 | 460.9 | 2,880.0 |
| 8 | San Diego | California | 1,307,402 | 325.2 | 4,020.3 |
| 9 | Dallas | Texas | 1,197,816 | 340.5 | 3,517.8 |
| 10 | San Jose | California | 945,942 | 176.5 | 5,359.4 |
| 11 | Jacksonville[g] | Florida | 821,784 | 747.0 | 1,100.1 |
| 12 | Indianapolis[f] | Indiana | 820,445 | 361.4 | 2,270.2 |
| 13 | San Francisco | California | 805,235 | 46.9 | 17,169.2 |
| 14 | Austin | Texas | 790,390 | 297.9 | 2,653.2 |
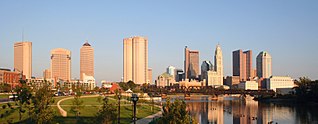
| 15 | Columbus | Ohio | 787,033 | 217.2 | 3,623.5 |
| 16 | Fort Worth | Texas | 741,206 | 339.8 | 2,181.3 |
| 17 | Louisville | Kentucky | 741,096 | 385.09 | 1,866.3 |
| 18 | Charlotte | North Carolina | 731,424 | 297.7 | 2,456.9 |
| 19 | Detroit | Michigan | 713,777 | 138.8 | 5,142.5 |
| 20 | El Paso | Texas | 649,121 | 255.2 | 2,543.6 |
| 21 | Memphis | Tennessee | 646,889 | 315.1 | 2,053.0 |
| 22 | Baltimore | Maryland | 620,961 | 80.9 | 7,675.7 |
| 23 | Boston | Massachusetts | 617,594 | 48.3 | 12,786.6 |
| 24 | Seattle | Washington | 608,660 | 83.9 | 7,254.6 |
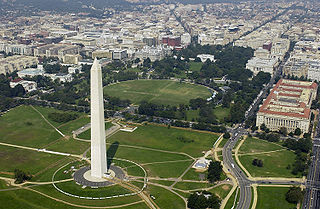
| 25 | Washington | District of Columbia | 601,723 | 61.0 | 9,864.3 |
| 26 | Nashville [f] | Tennessee | 601,222 | 475.1 | 1,265.5 |
| 27 | Denver [f] | Colorado | 600,158 | 153.3 | 3,979.3 |
| 28 | Milwaukee | Wisconsin | 594,833 | 96.1 | 6,189.7 |
| 29 | Portland | Oregon | 583,776 | 134.3 | 4,346.8 |
| 30 | Las Vegas | Nevada | 583,756 | 135.8 | 4,298.6 |
| 31 | Oklahoma City | Oklahoma | 579,999 | 606.4 | 956.5 |
| 32 | Albuquerque | New Mexico | 545,852 | 187.7 | 2,908.1 |
| 33 | Tucson | Arizona | 520,116 | 226.7 | 2,294.3 |
| 34 | Fresno | California | 494,665 | 112.0 | 4,416.7 |
| 35 | Sacramento | California | 466,488 | 97.9 | 4,764.9 |
| 36 | Long Beach | California | 462,257 | 50.3 | 9,190.0 |
| 37 | Kansas City | Missouri | 459,787 | 315.0 | 1,459.6 |
| 38 | Mesa | Arizona | 439,041 | 136.5 | 3,216.4 |
| 39 | Virginia Beach [e] | Virginia | 437,994 | 249.0 | 1,759.0 |
| 40 | Atlanta | Georgia | 420,003 | 133.2 | 3,153.2 |
| 41 | Colorado Springs | Colorado | 416,427 | 194.5 | 2,141.0 |
| 42 | Omaha | Nebraska | 408,958 | 127.1 | 3,217.6 |
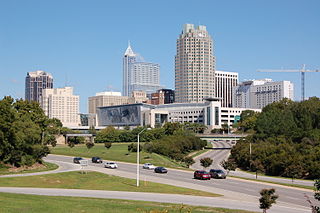
| 43 | Raleigh | North Carolina | 403,892 | 142.9 | 2,826.4 |
| 44 | Miami | Florida | 399,457 | 35.9 | 11,126.9 |
| 45 | Cleveland | Ohio | 396,815 | 77.7 | 5,107.0 |
| 46 | Tulsa | Oklahoma | 391,906 | 196.8 | 1,991.4 |
| 47 | Oakland | California | 390,724 | 55.8 | 7,002.2 |
| 48 | Minneapolis | Minnesota | 382,578 | 54.0 | 7,084.8 |
| 49 | Wichita | Kansas | 382,368 | 159.3 | 2,400.3 |
| 50 | Arlington | Texas | 365,438 | 95.9 | 3,810.6 |
| 51 | Bakersfield | California | 347,483 | 142.2 | 2,443.6 |
| 52 | New Orleans | Louisiana | 343,829 | 169.4 | 2,029.7 |
| 53 | Honolulu [b] | Hawaii | 337,256 | 60.5 | 5,574.5 |
| 54 | Anaheim | California | 336,265 | 49.8 | 6,752.3 |
| 55 | Tampa | Florida | 335,709 | 113.4 | 2,960.4 |
| 56 | Aurora | Colorado | 325,078 | 154.7 | 2,101.3 |
| 57 | Santa Ana | California | 324,528 | 27.3 | 11,887.5 |
| 58 | Saint Louis [d] | Missouri | 319,294 | 61.9 | 5,158.2 |
| 59 | Pittsburgh | Pennsylvania | 305,704 | 55.4 | 5,518.1 |
| 60 | Corpus Christi | Texas | 305,215 | 160.6 | 1,900.5 |
| 61 | Riverside | California | 303,871 | 81.1 | 3,746.9 |
| 62 | Cincinnati | Ohio | 296,943 | 77.9 | 3,811.8 |
| 63 | Lexington | Kentucky | 295,803 | 283.6 | 1,043.0 |
| 64 | Anchorage | Alaska | 291,826 | 1,704.7 | 171.2 |
| 65 | Stockton | California | 291,707 | 61.7 | 4,727.8 |
| 66 | Toledo | Ohio | 287,208 | 80.7 | 3,559.0 |
| 67 | Saint Paul | Minnesota | 285,068 | 52.0 | 5,482.1 |
| 68 | Newark | New Jersey | 277,140 | 24.2 | 11,452.1 |
| 69 | Greensboro | North Carolina | 269,666 | 126.5 | 2,131.7 |
| 70 | Buffalo | New York | 261,310 | 40.4 | 6,468.1 |
| 71 | Plano | Texas | 259,841 | 71.6 | 3,629.1 |
| 72 | Lincoln | Nebraska | 258,379 | 89.1 | 2,899.9 |
| 73 | Henderson | Nevada | 257,729 | 107.7 | 2,393.0 |
| 74 | Fort Wayne | Indiana | 253,691 | 110.6 | 2,293.8 |
| 75 | Jersey City | New Jersey | 247,597 | 14.8 | 16,729.5 |
| 76 | Saint Petersburg | Florida | 244,769 | 61.7 | 3,967.1 |
| 77 | Chula Vista | California | 243,916 | 49.6 | 4,917.7 |
| 78 | Norfolk [e] | Virginia | 242,803 | 54.1 | 4,488.0 |
| 79 | Orlando | Florida | 238,300 | 102.4 | 2,327.1 |
| 80 | Chandler | Arizona | 236,123 | 64.4 | 3,666.5 |
| 81 | Laredo | Texas | 236,091 | 88.9 | 2,655.7 |
| 82 | Madison | Wisconsin | 233,209 | 76.8 | 3,036.6 |
| 83 | Winston-Salem | North Carolina | 229,617 | 132.4 | 1,734.3 |
| 84 | Lubbock | Texas | 229,573 | 122.4 | 1,875.6 |
| 85 | Baton Rouge | Louisiana | 229,493 | 76.9 | 2,984.3 |
| 86 | Durham | North Carolina | 228,330 | 107.4 | 2,126.0 |
| 87 | Garland | Texas | 226,876 | 57.1 | 3,973.3 |
| 88 | Glendale | Arizona | 226,721 | 60.0 | 3,778.7 |
| 89 | Reno | Nevada | 225,221 | 103.0 | 2,186.6 |
| 90 | Hialeah | Florida | 224,669 | 21.5 | 10,449.7 |
| 91 | Chesapeake [e] | Virginia | 222,209 | 340.8 | 652.0 |
| 92 | Scottsdale | Arizona | 217,385 | 183.9 | 1,182.1 |
| 93 | North Las Vegas | Nevada | 216,961 | 101.3 | 2,141.8 |
| 94 | Irving | Texas | 216,290 | 67.0 | 3,228.2 |
| 95 | Fremont | California | 214,089 | 77.5 | 2,762.4 |
| 96 | Irvine | California | 212,375 | 66.1 | 3,212.9 |
| 97 | Birmingham | Alabama | 212,237 | 146.1 | 1,452.7 |
| 98 | Rochester | New York | 210,565 | 35.8 | 5,881.7 |
| 99 | San Bernardino | California | 209,924 | 59.2 | 3,546.0 |
| 100 | Spokane | Washington | 208,916 | 59.2 | 3,529.0 |
| 101 | Gilbert | Arizona | 208,453 | 68.0 | 3,065.5 |
| 102 | Arlington [c] | Virginia | 207,627 | 26.0 | 7,985.7 |
| 103 | Montgomery | Alabama | 205,764 | 159.6 | 1,289.2 |
| 104 | Boise | Idaho | 205,671 | 79.4 | 2,590.3 |
| 105 | Richmond [e] | Virginia | 204,214 | 59.8 | 3,414.9 |
| 106 | Des Moines | Iowa | 203,433 | 80.9 | 2,514.6 |
| 107 | Modesto | California | 201,165 | 36.9 | 5,451.6 |
| 108 | Fayetteville | North Carolina | 200,654 | 145.8 | 1,376.2 |
| 109 | Shreveport | Louisiana | 199,311 | 105.4 | 1,891.0 |
| 110 | Akron | Ohio | 199,110 | 62.0 | 3,211.5 |
| 111 | Tacoma | Washington | 198,397 | 49.7 | 3,991.9 |
| 112= | Aurora | Illinois | 197,899 | 44.9 | 4,407.6 |
| 112= | Oxnard | California | 197,899 | 26.9 | 7,356.8 |
| 114 | Fontana | California | 196,069 | 42.4 | 4,624.3 |
| 115 | Yonkers | New York | 195,976 | 18.0 | 10,887.6 |
| 116 | Augusta [f] | Georgia | 195,844 | 302.5 | 647.4 |
| 117 | Mobile | Alabama | 195,111 | 139.1 | 1,402.7 |
| 118 | Little Rock | Arkansas | 193,524 | 119.2 | 1,623.5 |
| 119 | Moreno Valley | California | 193,365 | 51.3 | 3,769.3 |
| 120 | Glendale | California | 191,719 | 30.5 | 6,285.9 |
| 121 | Amarillo | Texas | 190,695 | 99.5 | 1,916.5 |
| 122 | Huntington Beach | California | 189,992 | 26.7 | 7,115.8 |
| 123 | Columbus | Georgia | 189,885 | 216.4 | 877.5 |
| 124 | Grand Rapids | Michigan | 188,040 | 44.4 | 4,235.1 |
| 125 | Salt Lake City | Utah | 186,440 | 111.1 | 1,678.1 |
| 126 | Tallahassee | Florida | 181,376 | 100.2 | 1,810.1 |
| 127 | Worcester | Massachusetts | 181,045 | 37.4 | 4,840.8 |
| 128 | Newport News [e] | Virginia | 180,719 | 68.7 | 2,630.6 |
| 129 | Huntsville | Alabama | 180,105 | 209.1 | 861.3 |
| 130 | Knoxville | Tennessee | 178,874 | 98.5 | 1,816.0 |
| 131 | Providence | Rhode Island | 178,042 | 18.4 | 9,676.2 |
| 132 | Santa Clarita | California | 176,320 | 52.7 | 3,345.7 |
| 133 | Grand Prairie | Texas | 175,396 | 72.1 | 2,432.7 |
| 134 | Brownsville | Texas | 175,023 | 132.3 | 1,322.9 |
| 135 | Jackson | Mississippi | 173,514 | 111.0 | 1,563.2 |
| 136 | Overland Park | Kansas | 173,372 | 74.8 | 2,317.8 |
| 137 | Garden Grove | California | 170,883 | 17.9 | 9,546.5 |
| 138 | Santa Rosa | California | 167,815 | 41.3 | 4,063.3 |
| 139 | Chattanooga | Tennessee | 167,674 | 137.2 | 1,222.1 |
| 140 | Oceanside | California | 167,086 | 41.2 | 4,055.5 |
| 141 | Fort Lauderdale | Florida | 165,521 | 34.8 | 4,756.4 |
| 142 | Rancho Cucamonga | California | 165,269 | 39.9 | 4,142.1 |
| 143 | Port Saint Lucie | Florida | 164,603 | 114.0 | 1,443.9 |
| 144 | Ontario | California | 163,924 | 49.9 | 3,285.1 |
| 145 | Vancouver | Washington | 161,791 | 46.5 | 3,479.4 |
| 146 | Tempe | Arizona | 161,719 | 39.9 | 4,053.1 |
| 147 | Springfield | Missouri | 159,498 | 81.7 | 1,952.2 |
| 148 | Lancaster | California | 156,633 | 94.3 | 1,661.0 |
| 149 | Eugene | Oregon | 156,185 | 43.7 | 3,574.0 |
| 150 | Pembroke Pines | Florida | 154,750 | 33.1 | 4,675.2 |
| 151 | Salem | Oregon | 154,637 | 47.9 | 3,228.3 |
| 152 | Cape Coral | Florida | 154,305 | 105.7 | 1,459.8 |
| 153 | Peoria | Arizona | 154,065 | 174.4 | 883.4 |
| 154 | Sioux Falls | South Dakota | 153,888 | 73.0 | 2,108.1 |
| 155 | Springfield | Massachusetts | 153,060 | 31.9 | 4,798.1 |
| 156 | Elk Grove | California | 153,015 | 42.2 | 3,625.9 |
| 157 | Rockford | Illinois | 152,871 | 61.1 | 2,502.0 |
| 158 | Palmdale | California | 152,750 | 106.0 | 1,441.0 |
| 159 | Corona | California | 152,374 | 38.8 | 3,927.2 |
| 160 | Salinas | California | 150,441 | 23.2 | 6,484.5 |
| 161 | Pomona | California | 149,058 | 23.0 | 6,480.8 |
| 162 | Pasadena | Texas | 149,043 | 42.8 | 3,482.3 |
| 163 | Joliet | Illinois | 147,433 | 62.1 | 2,374.1 |
| 164 | Paterson | New Jersey | 146,199 | 8.4 | 17,404.6 |
| 165 | Kansas City | Kansas | 145,786 | 124.8 | 1,168.2 |
| 166 | Torrance | California | 145,438 | 20.5 | 7,094.5 |
| 167 | Syracuse | New York | 145,170 | 25.0 | 5,806.8 |
| 168 | Bridgeport | Connecticut | 144,229 | 16.0 | 9,014.3 |
| 169 | Hayward | California | 144,186 | 45.3 | 3,182.9 |
| 170 | Fort Collins | Colorado | 143,986 | 54.3 | 2,651.7 |
| 171 | Escondido | California | 143,911 | 36.8 | 3,910.6 |
| 172 | Lakewood | Colorado | 142,980 | 42.9 | 3,332.9 |
| 173 | Naperville | Illinois | 141,853 | 38.8 | 3,656.0 |
| 174 | Dayton | Ohio | 141,527 | 55.7 | 2,540.9 |
| 175 | Hollywood | Florida | 140,768 | 27.4 | 5,137.5 |
| 176 | Sunnyvale | California | 140,081 | 22.0 | 6,367.3 |
| 177 | Alexandria [e] | Virginia | 139,966 | 15.0 | 9,331.1 |
| 178 | Mesquite | Texas | 139,824 | 46.0 | 3,039.7 |
| 179 | Hampton [e] | Virginia | 137,436 | 51.4 | 2,673.9 |
| 180 | Pasadena | California | 137,122 | 23.0 | 5,961.8 |
| 181 | Orange | California | 136,416 | 24.8 | 5,500.6 |
| 182 | Savannah | Georgia | 136,286 | 103.2 | 1,320.6 |
| 183 | Cary | North Carolina | 135,234 | 54.3 | 2,490.5 |
| 184 | Fullerton | California | 135,161 | 22.4 | 6,034.0 |
| 185 | Warren | Michigan | 134,056 | 34.4 | 3,897.0 |
| 186 | Clarksville | Tennessee | 132,929 | 97.6 | 1,362.0 |
| 187 | McKinney | Texas | 131,117 | 62.2 | 2,108.0 |
| 188 | McAllen | Texas | 129,877 | 48.3 | 2,689.0 |
| 189 | New Haven | Connecticut | 129,779 | 18.7 | 6,940.1 |
| 190 | Sterling Heights | Michigan | 129,699 | 36.5 | 3,553.4 |
| 191 | West Valley City | Utah | 129,480 | 35.6 | 3,637.1 |
| 192 | Columbia | South Carolina | 129,272 | 132.2 | 977.9 |
| 193 | Killeen | Texas | 127,921 | 53.6 | 2,386.6 |
| 194 | Topeka | Kansas | 127,473 | 60.2 | 2,117.5 |
| 195 | Thousand Oaks | California | 126,683 | 55.0 | 2,303.3 |
| 196 | Cedar Rapids | Iowa | 126,326 | 70.8 | 1,784.3 |
| 197 | Olathe | Kansas | 125,872 | 59.7 | 2,108.4 |
| 198 | Elizabeth | New Jersey | 124,969 | 12.3 | 10,160.1 |
| 199 | Waco | Texas | 124,805 | 89.0 | 1,402.3 |
| 200 | Hartford | Connecticut | 124,775 | 17.4 | 7,171.0 |
| 201 | Visalia | California | 124,442 | 36.2 | 3,437.6 |
| 202 | Gainesville | Florida | 124,354 | 61.3 | 2,028.6 |
| 203 | Simi Valley | California | 124,237 | 41.5 | 2,993.7 |
| 204 | Stamford | Connecticut | 122,643 | 37.6 | 3,261.8 |
| 205 | Bellevue | Washington | 122,363 | 32.0 | 3,823.8 |
| 206 | Concord | California | 122,067 | 30.5 | 4,002.2 |
| 207 | Miramar | Florida | 122,041 | 29.5 | 4,137.0 |
| 208 | Coral Springs | Florida | 121,096 | 23.8 | 5,088.1 |
| 209 | Lafayette | Louisiana | 120,623 | 49.2 | 2,451.7 |
| 210 | Charleston | South Carolina | 120,083 | 109.0 | 1,101.7 |
| 211 | Carrollton | Texas | 119,097 | 36.3 | 3,280.9 |
| 212 | Roseville | California | 118,788 | 36.2 | 3,281.4 |
| 213 | Thornton | Colorado | 118,772 | 34.8 | 3,413.0 |
| 214 | Beaumont | Texas | 118,296 | 82.8 | 1,428.7 |
| 215 | Allentown | Pennsylvania | 118,032 | 17.5 | 6,744.7 |
| 216 | Surprise | Arizona | 117,517 | 105.7 | 1,111.8 |
| 217 | Evansville | Indiana | 117,429 | 44.2 | 2,656.8 |
| 218 | Abilene | Texas | 117,063 | 106.8 | 1,096.1 |
| 219 | Frisco | Texas | 116,989 | 61.8 | 1,893.0 |
| 220 | Independence | Missouri | 116,830 | 77.6 | 1,505.5 |
| 221 | Santa Clara | California | 116,468 | 18.4 | 6,329.8 |
| 222 | Springfield | Illinois | 116,250 | 59.5 | 1,953.8 |
| 223 | Vallejo | California | 115,942 | 30.7 | 3,776.6 |
| 224 | Victorville | California | 115,903 | 73.2 | 1,583.4 |
| 225 | Athens [f] | Georgia | 115,452 | 116.4 | 991.9 |
| 226 | Peoria | Illinois | 115,007 | 48.0 | 2,396.0 |
| 227 | Lansing | Michigan | 114,297 | 36.0 | 3,174.9 |
| 228 | Ann Arbor | Michigan | 113,934 | 27.8 | 4,098.3 |
| 229 | El Monte | California | 113,475 | 9.6 | 11,820.3 |
| 230 | Denton | Texas | 113,383 | 88.0 | 1,288.4 |
| 231 | Berkeley | California | 112,580 | 10.5 | 10,721.9 |
| 232 | Provo | Utah | 112,488 | 41.7 | 2,697.6 |
| 233 | Downey | California | 111,772 | 12.4 | 9,013.9 |
| 234 | Midland | Texas | 111,147 | 72.1 | 1,541.6 |
| 235 | Norman | Oklahoma | 110,925 | 178.8 | 620.4 |
| 236 | Waterbury | Connecticut | 110,366 | 28.5 | 3,872.5 |
| 237 | Costa Mesa | California | 109,960 | 15.7 | 7,003.8 |
| 238 | Inglewood | California | 109,673 | 9.1 | 12,052.0 |
| 239 | Manchester | New Hampshire | 109,565 | 33.1 | 3,310.1 |
| 240 | Murfreesboro | Tennessee | 108,755 | 55.3 | 1,966.6 |
| 241 | Columbia | Missouri | 108,500 | 63.1 | 1,719.5 |
| 242 | Elgin | Illinois | 108,188 | 37.2 | 2,908.3 |
| 243 | Clearwater | Florida | 107,685 | 25.6 | 4,206.4 |
| 244 | Miami Gardens | Florida | 107,167 | 18.2 | 5,888.3 |
| 245 | Rochester | Minnesota | 106,769 | 54.6 | 1,955.5 |
| 246 | Pueblo | Colorado | 106,595 | 53.6 | 1,988.7 |
| 247 | Lowell | Massachusetts | 106,519 | 13.6 | 7,832.3 |
| 248 | Wilmington | North Carolina | 106,476 | 51.5 | 2,067.5 |
| 249= | Arvada | Colorado | 106,433 | 35.1 | 3,032.3 |
| 249= | San Buenaventura (Ventura) | California | 106,433 | 21.7 | 4,904.7 |
| 251 | Westminster | Colorado | 106,114 | 31.6 | 3,358.0 |
| 252 | West Covina | California | 106,098 | 16.0 | 6,631.1 |
| 253 | Gresham | Oregon | 105,594 | 23.2 | 4,551.5 |
| 254= | Fargo | North Dakota | 105,549 | 48.8 | 2,162.9 |
| 254= | Norwalk | California | 105,549 | 9.7 | 10,881.3 |
| 256 | Carlsbad | California | 105,328 | 37.7 | 2,793.8 |
| 257 | Fairfield | California | 105,321 | 37.4 | 2,816.1 |
| 258 | Cambridge | Massachusetts | 105,162 | 6.4 | 16,431.6 |
| 259 | Wichita Falls | Texas | 104,553 | 72.1 | 1,450.1 |
| 260 | High Point | North Carolina | 104,371 | 53.8 | 1,940.0 |
| 261 | Billings | Montana | 104,170 | 43.4 | 2,400.2 |
| 262 | Green Bay | Wisconsin | 104,057 | 45.5 | 2,287.0 |
| 263 | West Jordan | Utah | 103,712 | 32.5 | 3,191.1 |
| 264 | Richmond | California | 103,701 | 30.1 | 3,445.2 |
| 265 | Murrieta | California | 103,466 | 33.6 | 3,079.3 |
| 266 | Burbank | California | 103,340 | 17.3 | 5,973.4 |
| 267 | Palm Bay | Florida | 103,190 | 65.7 | 1,570.6 |
| 268 | Everett | Washington | 103,019 | 33.4 | 3,084.4 |
| 269 | Flint | Michigan | 102,434 | 33.4 | 3,066.9 |
| 270 | Antioch | California | 102,372 | 28.3 | 3,617.4 |
| 271 | Erie | Pennsylvania | 101,786 | 19.1 | 5,329.1 |
| 272 | South Bend | Indiana | 101,168 | 41.5 | 2,437.8 |
| 273 | Daly City | California | 101,123 | 7.7 | 13,132.9 |
| 274 | Centennial | Colorado | 100,377 | 28.7 | 3,497.5 |
| 275 | Temecula | California | 100,097 | 30.2 | 3,314.5 |
Gallery
-
1 - New York, New York
-
2 - Los Angeles, California
-
3 - Chicago, Illinois
-
4 - Houston, Texas
-
5 - Philadelphia, Pennsylvania
-
6 - Phoenix, Arizona
-
7 - San Antonio, Texas
-
8 – San Diego, California
-
9 – Dallas, Texas
-
10 – San Jose, California
-
11 – Jacksonville, Florida
-
12 – Indianapolis, Indiana
-
13 – San Francisco, California
-
14 – Austin, Texas
-
15 – Columbus, Ohio
-
16 – Fort Worth, Texas
-
17 – Charlotte, North Carolina
-
18 – Detroit, Michigan
-
20 – Memphis, Tennessee
-
21 – Baltimore, Maryland
-
22 – Boston, Massachusetts
-
23 – Seattle, Washington
-
24 – Washington, D.C.
-
25 – Nashville, Tennessee
-
26 – Denver, Colorado
-
27 – Louisville, Kentucky
-
28 – Milwaukee, Wisconsin
-
29 – Portland, Oregon
-
30 – Las Vegas, Nevada
-
31 – Oklahoma City, Oklahoma
-
32 – Albuquerque, New Mexico
-
33 - Tucson, Arizona
-
34 – Fresno, California
-
35 – Sacramento, California
-
36 – Long Beach, California
-
37 – Kansas City, Missouri
-
38 – Mesa, Arizona
-
39 – Virginia Beach, Virginia
-
40 – Atlanta, Georgia
-
41 – Colorado Springs, Colorado
-
42 – Omaha, Nebraska
-
43 – Raleigh, North Carolina
-
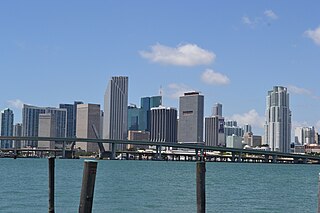
44 – Miami, Florida
-
45 – Cleveland, Ohio
-
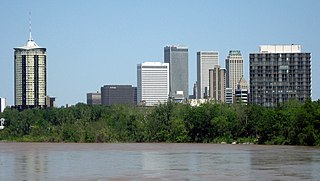
46 – Tulsa, Oklahoma
-
47 – Oakland, California
-
48 – Minneapolis, Minnesota
-
49 - Wichita, Kansas
-
50 – Arlington, Texas
Puerto Rico
The following table lists the incorporated municipalities (municipios) of Puerto Rico with a population greater than 100,000 according to the 2010 United States Census,[2] and the rankings they would have if included in the above table.

| Rank | City | Population (2009) |
|---|---|---|
| 46 | San Juan | 395,326 |
| 103 | Bayamón | 208,116 |
| 134 | Carolina | 176,762 |
| 144 | Ponce | 166,327 |
| 176 | Caguas | 142,893 |
See also
- Largest cities in the United States by population by decade
- List of cities proper by population (most populous cities in the World)
- List of lists of settlements in the United States
- List of United States cities by area
- List of United States cities by population density
- List of United States urban areas
- List of U.S. states and territories by population
- Table of United States Combined Statistical Areas (CSA)
- Table of United States Core Based Statistical Areas (CBSA)
- Table of United States Metropolitan Statistical Areas (MSA)
- Table of United States Micropolitan Statistical Areas (μSA)
Notes
- ^ Towns in New England, while incorporated on a level similar to cities in other states, are considered minor civil divisions by the Census Bureau and are not included in its list of incorporated places. A detailed discussion on this subject can be found at New England town#Census treatment of the New England town system.
- ^ a b Hawaii has no incorporated municipalities other than the City and County of Honolulu, which actually includes the entire island of Oahu. In accordance with Hawaiian law, the U.S. Census Bureau defines the state's "cities" and "towns" as census-designated places (CDPs). The Census Bureau defines Honolulu CDP as the portion of the City and County that is coextensive with the Judicial District of Honolulu. Honolulu CDP is what is generally thought of as the "city" of Honolulu, and its population is used here and in other population comparisons. If the entire population of the City and County were included, Honolulu would place 10th on the list above with a 2010 estimated population of 953,207.[3]
- ^ a b Arlington CDP, Virginia, is coextensive with Arlington County. Virginia law forbids the creation of cities in counties with over 1,000 people per square mile, which Arlington County exceeds. Thus, the entire county is considered by the Census Bureau as one CDP. While not incorporated as a municipality, Arlington is included in the Census Bureau's annual list of incorporated places and is retained in the above list.
- ^ a b
- ^ a b c d Cities in Virginia, except for Arlington, are all independent cities that are not a part of any particular county.
- ^ a b c d e Indianapolis, Indiana; Louisville, Kentucky; Nashville, Tennessee; Augusta, Georgia; and Athens, Georgia are consolidated city–counties. The population given is for the entire city, excluding other incorporated places lying within the county limits. (See Indianapolis (balance), Indiana; Louisville – Jefferson County (balance), Kentucky; and Nashville-Davidson (balance), Tennessee). As of 2009, the consolidated populations of these city-counties including other incorporated places were, respectively: 890,879;[4] 721,594;[5] 635,710;[6] 199,768;[7] and 116,342.[7]
- ^ Jacksonville, Florida is a consolidated city-county with Duval County. The population given is for the city excluding other incorporated places within Duval County. As of 2010 the consolidated population including other incorporated populations was 864,263.
Distributions
For cities with populations of 100,000 or more the following distributions hold. Smaller incorporated places are not included.[citation needed]
The mean density is 4,128.21 inhabitants per square mile (1,593.91/km2).[citation needed]
The median is 3,160.85 inhabitants per square mile (1,220.41/km2).[citation needed]
| Population | Number of municipal governments[8] |
|---|---|
| 1,000,000+ | 9 |
| 300,000–1,000,000 | 51 |
| 200,000–299,999 | 46 |
| 100,000–199,999 | 169 |
| Total | 275 |
U.S. Census Bureau statistical areas
Template:US Census Labeled Map
References
- ^ "American FactFinder". U.S. Census Bureau.
- ^ "U.S. Census Bureau Delivers Puerto Rico's 2010 Census Population Totals". 2010 Census Population. U.S. Census Bureau, Population Division. 2011-03-24. Retrieved 2011-03-24.
- ^ "Profile of General Population and Housing Characteristics: 2010". United States Census Bureau, Population Division. Retrieved 2011-07-28.
- ^ "Table 1. Annual Estimates of the Resident Population for Counties of Indiana: April 1, 2000 to July 1, 2009 (CO-EST2009-01-18)" (CSV). U.S. Census Bureau, Population Division. March 2010. Retrieved 2010-12-30.
- ^ "Table 1. Annual Estimates of the Resident Population for Counties of Kentucky: April 1, 2000 to July 1, 2009 (CO-EST2009-01-21)" (CSV). U.S. Census Bureau, Population Division. March 2010. Retrieved 2010-12-30.
- ^ "Table 1. Annual Estimates of the Resident Population for Counties of Tennessee: April 1, 2000 to July 1, 2009 (CO-EST2009-01-47)" (CSV). U.S. Census Bureau, Population Division. March 2010. Retrieved 2010-12-30.
- ^ a b "Table 1. Annual Estimates of the Resident Population for Counties of Georgia: April 1, 2000 to July 1, 2009 (CO-EST2009-01-13)" (CSV). U.S. Census Bureau, Population Division. March 2010. Retrieved 2010-12-30.
- ^ "Census of Governments" (PDF). Government Organization. U.S. Census Bureau. December 2002. Retrieved 30 December 2010.
External links
- "Biggest US Cities By Population". biggestuscities.com. 11 December 2010.
- "Population Estimates: Incorporated Places and Minor Civil Divisions, by State (2000 to 2009)". U.S. Census Bureau, Population Division. 2010.
- "U.S. Census Bureau Gazetteer (2010)". U.S. Census Bureau.


