
Talk:Western African Ebola virus epidemic: Difference between revisions
| Line 815: | Line 815: | ||
*'''Maybe we're looking at it wrong'''. I thought about this some more...if the graphs showed the number of people sick at any given time, it would be a useful picture of the progress of the epidemic. But, it doesn't. It shows the cumulative number of cases/death. And frankly, the cumulative number at a given point in time just really isn't that meaningful to help understand the epidemic. So, I change my vote to '''Remove all''' [[User:ZeLonewolf|ZeLonewolf]] ([[User talk:ZeLonewolf|talk]]) 01:50, 31 October 2014 (UTC) |
*'''Maybe we're looking at it wrong'''. I thought about this some more...if the graphs showed the number of people sick at any given time, it would be a useful picture of the progress of the epidemic. But, it doesn't. It shows the cumulative number of cases/death. And frankly, the cumulative number at a given point in time just really isn't that meaningful to help understand the epidemic. So, I change my vote to '''Remove all''' [[User:ZeLonewolf|ZeLonewolf]] ([[User talk:ZeLonewolf|talk]]) 01:50, 31 October 2014 (UTC) |
||
*'''Remove'''. I am more skilled than most in interpreting graphs yet I still find these to be worthless. Why? Because the raw data is worthless. WHO is relying on the governments of the affected countries to provide the raw. Unfortunately those governments at present are not capable of providing accurate nor precise data. The last |
*'''Remove'''. I am more skilled than most in interpreting graphs yet I still find these to be worthless. Why? Because the raw data is worthless. WHO is relying on the governments of the affected countries to provide the raw data. Unfortunately those governments at present are not capable of providing accurate nor precise data. The last I checked both WHO and US CDC stated they actually "may" be as much as three times higher. Meaning that the actual multiplier could be different and in fact may not be a constant. |
||
It used to be said that are three types of lies: lies; damn lies; and statistics. The data at the moment are so unreliable as not |
It used to be said that are three types of lies: lies; damn lies; and statistics. The data at the moment are so unreliable as to not be usable for any definitive purpose. If we must provide some information let's limit to the currently reported values. |
||
And preferable semi-protect it so that people who can't, don't, won't or haven't read the talk page will leave it alone.[[User:Jaerik|Jaerik]] ([[User talk:Jaerik|talk]]) 04:56, 31 October 2014 (UTC) |
And preferable semi-protect it so that people who can't, don't, won't or haven't read the talk page will leave it alone.[[User:Jaerik|Jaerik]] ([[User talk:Jaerik|talk]]) 04:56, 31 October 2014 (UTC) |
||
Revision as of 05:05, 31 October 2014
 | If you came here because someone asked you to, or you read a message on another website, please note that this is not a majority vote, but instead a discussion among Wikipedia contributors. Wikipedia has policies and guidelines regarding the encyclopedia's content, and consensus (agreement) is gauged based on the merits of the arguments, not by counting votes.
However, you are invited to participate and your opinion is welcome. Remember to assume good faith on the part of others and to sign your posts on this page by adding ~~~~ at the end. Note: Comments may be tagged as follows: suspected single-purpose accounts:{{subst:spa|username}}; suspected canvassed users: {{subst:canvassed|username}}; accounts blocked for sockpuppetry: {{subst:csm|username}} or {{subst:csp|username}}. |
| Western African Ebola virus epidemic was nominated as a good article, but it did not meet the good article criteria at the time (August 26, 2014). There are suggestions on the review page for improving the article. If you can improve it, please do; it may then be renominated. |
| This is the talk page for discussing improvements to the Western African Ebola virus epidemic article. This is not a forum for general discussion of the article's subject. |
Article policies
|
| Find medical sources: Source guidelines · PubMed · Cochrane · DOAJ · Gale · OpenMD · ScienceDirect · Springer · Trip · Wiley · TWL |
| Archives: 1, 2, 3, 4, 5, 6, 7, 8, 9, 10, 11, 12Auto-archiving period: 10 days |
| This article is of interest to the following WikiProjects: | |||||||||||||||||||||||||||||||||||||||||||||||||
| |||||||||||||||||||||||||||||||||||||||||||||||||


| This is the talk page for discussing improvements to the Western African Ebola virus epidemic article. This is not a forum for general discussion of the article's subject. |
Article policies
|
| Find medical sources: Source guidelines · PubMed · Cochrane · DOAJ · Gale · OpenMD · ScienceDirect · Springer · Trip · Wiley · TWL |
| Archives: 1, 2, 3, 4, 5, 6, 7, 8, 9, 10, 11, 12Auto-archiving period: 10 days |
| A news item involving Western African Ebola virus epidemic was featured on Wikipedia's Main Page in the In the news section on 31 March 2014. |
| A news item involving Western African Ebola virus epidemic was featured on Wikipedia's Main Page in the In the news section on 29 June 2014. |
| This page is not a forum for general discussion about politics of Ebola containment. Any such comments may be removed or refactored. Please limit discussion to improvement of this article. You may wish to ask factual questions about politics of Ebola containment at the Reference desk. |
RfC
|
Should the French name Médecins Sans Frontières be used or should the English translation Doctors without Borders be used in the article?
12:55, 12 October 2014 (UTC)
Please indicate French or English here:
- The short answer is, of course, English.—John Cline (talk) 12:55, 12 October 2014 (UTC)
- French---Ozzie10aaaa (talk) 13:16, 12 October 2014 (UTC)
- French -- The Anome (talk) 16:49, 12 October 2014 (UTC)
- Both (see discussion) Robertpedley (talk) 17:02, 12 October 2014 (UTC)
- French --Redrose64 (talk) 17:07, 12 October 2014 (UTC)
- Both Both are used by the organization without indicating an absolute preference for any single language. Noting also the corporate name in the US is "MSF USA" which should also be indicated. Collect (talk) 17:28, 12 October 2014 (UTC)
- I can see no reason to list the national names for each country, unless there is a specific reason for doing do. All the best: Rich Farmbrough, 16:21, 15 October 2014 (UTC).
- I can see no reason to list the national names for each country, unless there is a specific reason for doing do. All the best: Rich Farmbrough, 16:21, 15 October 2014 (UTC).
- French -- Qwfp (talk) 18:10, 12 October 2014 (UTC)
- Both. Collect makes a good point. Since the organization uses both French and English without preference for either, the article can easily do the same, as it has been doing. And as Saxmund noted in the discussion in the thread above, it's common in the UK to say MSF. SW3 5DL (talk) 18:25, 12 October 2014 (UTC)
- Emphasis on the French, and use MSF as the abbreviation later in the article. [Example: "Médecins Sans Frontières (Doctors Without Borders) has provided assistance...] I have seen hundreds of communications from this organization, and the French name is always used, while even in English-language communications Doctors Without Borders is seen significantly less frequently. It may have equal footing in the US, but this is not US Wikipedia. "Doctors Without Borders" is not seen nearly as often in English-speaking countries outside the US. Risker (talk) 22:40, 12 October 2014 (UTC)
- French. Let's be clear on the problem: the French name is used throughout most of the world, except by the U.S. media, who seems to feel that their primary job is to dumb Americans down by eliminating the use of foreign words and phrases. If we started following in the footsteps of the U.S. media, this entire site would be doomed. Viriditas (talk) 22:41, 12 October 2014 (UTC)
- English. Let's be clear here: Doctors Without Borders translates their name into local languages. It does so on its own website. Per WP:EN, we should as well. It is the common name in English, and it is the name of the organization - just as we call the Russian armed forces such, even though they have a name in Russian. If you look at their website, on the English versions of their page, they refer to themselves either as Doctors Without Borders, or as the MSF. They do note their name in French, and that shows up on their website too, but the reality is that they don't refer to themselves inline by their full name on their English webpages, and their most common name in the English speaking world is MSF or Doctors Without Borders. But we should be having this discussion over there, not here, as others have noted. Titanium Dragon (talk) 03:38, 13 October 2014 (UTC)
- That's not actually correct; the American branch is named MSF/DWB-USA, the Canadian branch is MSF Canada, and indeed in Canada from coast to coast it's referred to as MSF or Médecins Sans Frontières. The same is true in the UK and Australia. Doctors Without Borders is not the name used in the majority of English-speaking countries. Nonetheless, to the heart of the matter: DWB would be appropriate if all of the volunteers on a specific mission came from a single country where that was the name by which the organization was known; however, they are in fact coming from multiple countries for this specific outbreak, so the generic/international name is the appropriate one, not the name by which MSF is known in the US. Risker (talk) 04:33, 13 October 2014 (UTC)
- French. Considering that in many circumstances French is still a lingua franca. Except for monolinguists (i.e. North Americans living between Canada and Mexico.Jaerik (talk) 03:53, 13 October 2014 (UTC)
- How is that relevant to the English Wiki? By that metric, all the Wikis should use the English name for everything, given that it is the primary lingua franca of the world, especially in a lot of technical fields. Titanium Dragon (talk) 04:11, 13 October 2014 (UTC)
- Both but mostly MSF, with parenthetical mention of DWB in major sections. Per Risker above, that's the umbrella name internationally; "Doctors Without Borders" the name for MSF in the US. (True, most Anglophone North Americans live in monolingual areas where the name "DWB" will be preferred in the media. But most other Anglophones don't tend to be (nearly) as monolingual, so using mainly DWB would constitute regional bias IMO). --Middle 8 (contribs • COI) 06:01, 13 October 2014 (UTC)
- French only. "Médecins Sans Frontières" is the main term used by the organization, even in the UK and some other English-speaking countries. Axl ¤ [Talk] 11:44, 13 October 2014 (UTC)
- French. "Médecins Sans Frontières" is the original name of the organisation, and the one it is most frequently referred to by in the UK (and as the article uses British English, I think that is quite a good pointer). From what I see on this page, the English name is only used as the primary name in the US. This is an international article about an international event so to defer to a usage prevalent in only one country seems wrong. Although the name is used on the website it clearly appears to be secondary, and when the organisation is abbreviated it is usually MSF, ie an abbreviation of the main French name. Having said that, I would be happy to see the English name in parentheses the first time the phrase is used in the article. Saxmund (talk) 18:48, 13 October 2014 (UTC)
- french --Dernier Siècle (talk) 12:45, 14 October 2014 (UTC)
- Both, per reasoning of Collect.--RightCowLeftCoast (talk) 04:52, 15 October 2014 (UTC)
- "French" (MSF) - which, we should note, is the English name in most of the English-speaking world! Glossing as DWB on first or second use is definitely sensible, though. Andrew Gray (talk) 18:45, 15 October 2014 (UTC)
- French it is not difficult to understand. Moreover from what I can see the local media uses either the French or an Angliciɀed version (Medicine sans Frontiers). All the best: Rich Farmbrough, 22:27, 15 October 2014 (UTC).
- French My experience of seeing the organisation mentioned in the media is that they mostly referred to as Medecins Sans Frontieres. A quick check on the BBC website confirms this (6,360 uses of MSF and 1,780 of DWB, most of which seem to be noting the translation of MSF rather than using it as the main name). However, this debate is rather pointless - the article should simply reflect whatever the main article is called - having a subdiscussion here is not really appropriate. Number 57 14:30, 16 October 2014 (UTC)
- What is here confusingly called "French". But I'm no more speaking that language when I call Médecins Sans Frontières by the name it's best known by in most of the English speaking world than I'm speaking German when I say "Volkswagen". (And that one has had an alternative name used in one English speaking country.) Timrollpickering (talk) 09:53, 17 October 2014 (UTC)
- I think that the French title should be used throughout seeing as most of the world uses the french version. Perhaps one should include the english translation in brackets after the first use of it, ie Médecins Sans Frontières (Doctors without Borders). Schuy B. (talk) 00:07, 21 October 2014 (UTC)
- French, per above editors that believe it is preferable. The article currently has the French version with the English version in brackets in the lead as Schuy suggests, which I find to be the best choice. Gandydancer (talk) 16:08, 21 October 2014 (UTC)
- French. That's its name, that is how it is known throughout the world. I am English, but until today I had never encountered an English version of its name. Maproom (talk) 07:13, 25 October 2014 (UTC)
- Anglicised as Medecins Sans Frontieres as used at least by the BBC, I was aware of the English translation but I dont recall it being used in British media. MilborneOne (talk) 16:36, 29 October 2014 (UTC)
- French, or Anglicized French, followed at the first mention by the English in brackets. Johnbod (talk) 02:26, 30 October 2014 (UTC)
Discussion here:
Médecins Sans Frontières seems to be best, it is how they originally are recognized--Ozzie10aaaa (talk) 13:35, 12 October 2014 (UTC)
- That's a good point, but they also call themselves Doctors without Borders in English speaking countries, because they are without borders. So they don't insist on the French name. They want to be inclusive. SW3 5DL (talk) 16:51, 12 October 2014 (UTC)
- I opposed a blanket change, but I would be happy with a compromise. I propose "Doctors without Borders / Medecins sans Frontieres (MSF)" for the first occurrence and then "MSF" thereafter. Robertpedley (talk) 17:05, 12 October 2014 (UTC)
Per the RfC rules publicizing an RfC, I posted at the Village pump and the RS and NPOV noticeboards. I haven't picked editors at random from the Feedback Service list because those three places should be enough whilst waiting on the Bot. SW3 5DL (talk) 17:20, 12 October 2014 (UTC)
Improper venue? Why does there need to be a separate discussion about this just for this article? The organization already has an article of their own with a name that presumably follows WP:COMMONNAME and not only have there been multiple discussions about the common name in English sources there already, but there's a parallel RM going on right now. Regards, Orange Suede Sofa (talk) 17:45, 12 October 2014 (UTC)
A Google Image search strongly suggests MSF are predominantly or exclusively using 'Medecins Sans Frontieres' on the ground during the current Ebola outbreak in West Africa, even though English is the official language of two of the most heavily affected countries (Liberia, Sierra Leone). Qwfp (talk) 18:10, 12 October 2014 (UTC)
- FWIW, the other countries mainly at risk are Francophone. The use of French markings is therefore pretty meaningless in discussions here. As the organization appears to give equal weight to both names, and to "MSF" as an acronym, then so ought we. Collect (talk) 20:49, 12 October 2014 (UTC)
- I also agree that this may be the wrong venue for this discussion; MSF is discussed on hundreds of Wikipedia pages and even has its own article (while DWB is a redirect). It is not a good idea to have a "local consensus" considerably out of step from the rest of the project. Risker (talk) 22:40, 12 October 2014 (UTC)
- I agree; this discussion probably belongs over there. Titanium Dragon (talk) 03:38, 13 October 2014 (UTC)
- Titanium Dragon, Risker is right, but did you provide a link here to your RfC on the MSF article? I didn't see any link here. If I had, I wouldn't have bothered to start this RfC. But looking at the one you began over on the MSF, it appears keeping the French name is the community choice. SW3 5DL (talk) 03:51, 13 October 2014 (UTC)
- Well, I started it in the wrong place, which didn't help anyway. I should probably close it and reopen it properly, as it doesn't belong in speedy. Titanium Dragon (talk) 04:13, 13 October 2014 (UTC)
For those who presume to claim that the group is not known as "Doctors without Borders" in the UK, I present Health specialists work in an isolation ward for ebola patients at a Doctors Without Borders facility in southern Guinea. Photograph: AFP/Getty Images from [1] The Guardian, etc. The English term is,indeed, used in England, although in an acronymic society "MSF" is frequently found. Cheers. Collect (talk) 12:24, 15 October 2014 (UTC)
- That's very unusual; note that the Guardian style guide itself uses Médecins sans Frontières without even mentioning another name. I suspect this is an effect of an article written by external correspondents! Outside of that link, I would confidently have said I'd never seen it referred to by that name here (including on material it produces, which it sends me every now and again). Andrew Gray (talk) 18:54, 15 October 2014 (UTC)
Move request on the page itself
I started a move request on that page itself for the main article; that is probably the proper venue for this. Titanium Dragon (talk) 04:21, 13 October 2014 (UTC)
- Indeed. This RfC should be closed. In fact, whoever started it should be trouted. Do we really need an RfC for every little decision on this article. This Ebola stuff has been the biggest whackery since Bradley Manning vanished off the face of the Earth. - Floydian τ ¢ 15:42, 17 October 2014 (UTC)
Daily growth
In the big table, I assumed the new "% Daily growth" field was growth in the number of deaths not cases, because the field is next to the "Deaths" field and not by the "Cases" field; also because the heading is black, which matches the "Deaths" and not the red "Cases" field heading. However, a calculator shows it's a daily percentage of cases. So I suggest moving the field and making the header red. Art LaPella (talk) 02:41, 16 October 2014 (UTC)
- I think we should slowly start moving away from this table. These numbers are not accurate, they're just what the governments are posting. Liberia is collapsing and Sierra Leone is not far behind. Even the WHO said there was major under-reporting in these countries. I think we should remove the % Daily Growth, only because this is only a show of the numbers in the report and how they change. This is NOT an accurate portrayal of how the virus is growing. Realistically, these numbers should be increasing. There is NOT a decline in cases OR deaths in West Africa, just a decline in reporting. AmericanXplorer13 (talk) 03:18, 16 October 2014 (UTC)
- Which is why I liked the previous section heading "... reported cases and deaths". The table heading should also say "reported", and I don't know what pages of statistics are accomplishing compared to other things that were spun off into subarticles. But if we keep the Daily Growth column, please fix the heading. Art LaPella (talk) 03:32, 16 October 2014 (UTC)
- Do we have reliable sources to back up the claim that there are lots more cases in Liberia, and that the rate of infection is growing? People seem to base these claims primarily on articles coming out a few weeks ago.John Pack Lambert (talk) 04:42, 16 October 2014 (UTC)
- This report is indeed a few weeks old. Are you implying that everyone dying in Liberia lately makes sure they get counted, even if they can't get into a clinic, just because reporting difficulties aren't reported weekly? Art LaPella (talk) 05:07, 16 October 2014 (UTC)
- There is underreporting in Liberia [2] and some of it may be intentional [3]. I mostly agree with AmericanXplorer that the table should be moved away from, or at least make sure the wording associated with it is deliberate (as Art suggests). If the epidemic unfortunately goes at the rate that the WHO expects [4], the gap between what's true and what's reported could become pretty large. Snd0 (talk) 06:28, 16 October 2014 (UTC)
- The Daily Growth column is likely to be more accurate than the underlying declared statistics, in that even if the underlying figures are underestimates, the growth is likely to be more similar to that of the real (unquantifiable) stats. That's just the nature of statistics - it deals with approximations all the time, so I see no reason, on that basis, to discount the Daily Growth column.
- That said, Daily Growth could give an unduly optimistic picture of the situation to those less familiar with the effect of the compound growth that has been evidenced by the epidemic so far. Dare I suggest that, to the layman in the street, a daily growth of 1.4% could feel more like an annual growth of 1.4 x 365 = ~500% annual growth, rather than the >15000% annual growth that it actually represents. (Just as an aside, a daily growth of 2%, when compounded, would amount to an annual growth of >130000%!). Nevertheless, I accept that citing an inferred annual growth could be viewed as unduly pessimistic and alarmist - "true" though it might be. Personally, I believe that more people and governments need to be seriously "alarmed" by the epidemic's potential, but that's my POV and therefore not appropriate for the wiki. Kirbett (talk) 17:52, 16 October 2014 (UTC)
- Yes and no. If the statistics represent only those who the clinics have room for (and I don't know to what extent that is true), then it isn't an approximation like the approximate population of countries. It would be more like estimating the population of France by counting people in Paris. That is, it would be a better representation of growth in the number of beds provided, bearing no relation to how many people may be dying outside, waiting to get in. Art LaPella (talk) 18:52, 16 October 2014 (UTC)
- Daily growth would give useful data, if under reporting factor stays more or less stable over time. If however there is a bottleneck somewhere in reporting, then all that is reported is capacity to report new cases, without any relation to how many cases there really are. Its quite likely the latter is the case.194.126.122.67 (talk) 09:14, 21 October 2014 (UTC)
- I second moving away from Daily Growth for a different reason. I've been reading a lot trying to learn more about base regeneration rate sometimes written as Ro or R(t). There is recent data in published paper (through a few weeks ago) estimating it for the three major countries. The R(t) fluctuates over time and seemed to be actually declining. http://www.eurosurveillance.org/images/dynamic/EE/V19N36/Nishiura_fig2.jpg It is not a straight a/b calculation you have to use eigenvalues of matrices or other statistical methods and it is changing significantly over time. So I think unless we find at least two reliable sources that conclude that Daily Growth has significant meaning in an ongoing epidemic I think we have drifted slightly in to WP:OR territory and should shy away. R(t) may be better but I have not been able to find a clear explanation of the true meaning and implication so far. That being said, I really like this table I find it very valuable and sobering information at a glance.Greenbe (talk) 23:39, 16 October 2014 (UTC)
- Suggest we align the growth rate not on daily but on time line dates i.e 1.4% should therefore read 7.3% , giving a better picture. Title should read growth rate and not daily and in red referring to cases..just my opinion.. gives you a better picture IMO greetings Brian BrianGroen (talk) 05:21, 17 October 2014 (UTC)
- Please clarify what you mean by "time line dates". 7.3% refers to the growth over the last 5 days of the table. If you're referring to the intervals between different rows of the table, then these vary widely. Any stats based on these non-uniform intervals would be incapable of being interpreted without simultaneously referencing the intervals themselves, row by row. Kirbett (talk) 10:20, 17 October 2014 (UTC)
- I think the growth rates could be normalized to weeks synchronized to the WHO definition of week number of the epidemic. This would smooth out the fluctuations in the %. However that would require me to pull it into Excel and run a normalizing regression if the report dates don't align to weeks - isn't that WP:OR? Regeneration rate is the only way to know if it is growing - that is the number of new infection each case generates, and the rate varies weekly. Deaths could be growing rapidly while regeneration is declining below 1. Greenbe (talk) 01:44, 18 October 2014 (UTC)
- I wouldn't have thought it was WP:OR. To any statistician, wouldn't a regression calculation of this form just be WP:CALC? Kirbett (talk) 18:23, 18 October 2014 (UTC)
- I don't know. What I am thinking is a little more complicated than a simple calc, because it seems the reported dates don't align with epidemic weeks exactly (a few days off here and there). So you would have to figure out the compound daily growth from report to report then normalize it back to weekly smoothed average and you would have to make some decision about the smoothing window over several weeks. Anyway just an idea if anyone wants to take a crack at it to see if it reduces noise and makes a clearer trend (whether increasing or decreasing).Greenbe (talk) 22:34, 20 October 2014 (UTC)
- I wouldn't have thought it was WP:OR. To any statistician, wouldn't a regression calculation of this form just be WP:CALC? Kirbett (talk) 18:23, 18 October 2014 (UTC)
- I think the growth rates could be normalized to weeks synchronized to the WHO definition of week number of the epidemic. This would smooth out the fluctuations in the %. However that would require me to pull it into Excel and run a normalizing regression if the report dates don't align to weeks - isn't that WP:OR? Regeneration rate is the only way to know if it is growing - that is the number of new infection each case generates, and the rate varies weekly. Deaths could be growing rapidly while regeneration is declining below 1. Greenbe (talk) 01:44, 18 October 2014 (UTC)
- Please clarify what you mean by "time line dates". 7.3% refers to the growth over the last 5 days of the table. If you're referring to the intervals between different rows of the table, then these vary widely. Any stats based on these non-uniform intervals would be incapable of being interpreted without simultaneously referencing the intervals themselves, row by row. Kirbett (talk) 10:20, 17 October 2014 (UTC)
- Suggest we align the growth rate not on daily but on time line dates i.e 1.4% should therefore read 7.3% , giving a better picture. Title should read growth rate and not daily and in red referring to cases..just my opinion.. gives you a better picture IMO greetings Brian BrianGroen (talk) 05:21, 17 October 2014 (UTC)
- My 2cents - The Daily Growth numbers are interesting and informative. I was calculating them by hand until they were added to the table. They should be kept. None of us (unless you are actually in West Africa) knows anything beyond what is being reported. Perhaps there is some under-reporting, but is it better or worse than the previous under-reporting? Further, since this disease has a ~70% fatality rate, the under-reporting has some bounds: if, for example, there were actually, 50k infected, we'd be seeing mass quantities of corpses that would be difficult to hide. Some under-reporting, yes. Delayed reporting that makes the measured stats noisier than reality, absolutely. Still, sans conspiracy theories, the reported data likely tracks the real ground truth within some bounded percentile factor. And in any case, it's the best that can be offered. — Preceding unsigned comment added by Ddopson (talk • contribs) 03:44, 19 October 2014 (UTC)
- Mine as well, i have a doctor friend in the area of Liberia and it is bad, .. Just the other day Liberia requested 160 000 body bags(must be a reason for that ; was in a news report will try to find it..The under reporting may be way higher than 2.5. In SL patient are being treated at home (most die) and are not included in most stats... BrianGroen (talk) 05:36, 19 October 2014 (UTC)
- Did you mean 160,000 hazmat suits? Art LaPella (talk) 21:45, 19 October 2014 (UTC)
- Hi Art Art LaPella their was another news item , but i think the reporters switch the two around somehow.. cant find it now but it was 160 000 body bags and 5000 hazmat suits.. Reportes yikes...This one sounds more correct.. BrianGroen (talk) 05:43, 20 October 2014 (UTC)
- Re the true case rate, I ran across a statement made by MSF where they figured that the reported cases are only 20% of the true number of cases/deaths. I have looked for the report I read, but I have lost it. It does figure that it has become worse than the WHO's old report of 2.5 that was made before the epidemic seems to have run totally out of control. Gandydancer (talk) 11:32, 21 October 2014 (UTC)
- Re. the reported cases being only 20% of the true numbers: This transcript of an interview with Dr. Joanne Liu, President of MSF, quotes her as saying: "...but it’s difficult to get a reality check about what is the magnitude of the epidemic when we just look at some of the cold figures or think 'Oh, 4,700 people infected, about half of them died - well, compared to other context it is not that bad' - but the reality is that this is only the tip of the iceberg. First of all, we know that the figures underestimate it, we have only 20% visibility of the number of cases...". Here is that interview on YouTube. The interview was on 22 Sept. So, if the true total number of cases really was 5 times higher than the reported number - and the total number is doubling every 3 weeks - then, by 03 Nov, the actual number of cases would stand at 94,000 (4,700 x 5 x 2 x 2). Does anyone really believe that the true number of cases will be anywhere near that on 03 Nov? Back in September, I suspect that the health and medical agencies were stating worst case scenarios in order to provoke western nations into action. Stanley Oliver (talk) 22:01, 28 October 2014 (UTC)
- OK, maybe she exaggerated. Maybe she didn't. 94,000 right now would be an undercount ratio of 8. In the absence of good data, is 2.5 in August, 5 in September, and 8 in October as good a guess as any? Art LaPella (talk) 22:47, 28 October 2014 (UTC)
- Re. the reported cases being only 20% of the true numbers: This transcript of an interview with Dr. Joanne Liu, President of MSF, quotes her as saying: "...but it’s difficult to get a reality check about what is the magnitude of the epidemic when we just look at some of the cold figures or think 'Oh, 4,700 people infected, about half of them died - well, compared to other context it is not that bad' - but the reality is that this is only the tip of the iceberg. First of all, we know that the figures underestimate it, we have only 20% visibility of the number of cases...". Here is that interview on YouTube. The interview was on 22 Sept. So, if the true total number of cases really was 5 times higher than the reported number - and the total number is doubling every 3 weeks - then, by 03 Nov, the actual number of cases would stand at 94,000 (4,700 x 5 x 2 x 2). Does anyone really believe that the true number of cases will be anywhere near that on 03 Nov? Back in September, I suspect that the health and medical agencies were stating worst case scenarios in order to provoke western nations into action. Stanley Oliver (talk) 22:01, 28 October 2014 (UTC)
- Re the true case rate, I ran across a statement made by MSF where they figured that the reported cases are only 20% of the true number of cases/deaths. I have looked for the report I read, but I have lost it. It does figure that it has become worse than the WHO's old report of 2.5 that was made before the epidemic seems to have run totally out of control. Gandydancer (talk) 11:32, 21 October 2014 (UTC)
- Hi Art Art LaPella their was another news item , but i think the reporters switch the two around somehow.. cant find it now but it was 160 000 body bags and 5000 hazmat suits.. Reportes yikes...This one sounds more correct.. BrianGroen (talk) 05:43, 20 October 2014 (UTC)
- Did you mean 160,000 hazmat suits? Art LaPella (talk) 21:45, 19 October 2014 (UTC)
- Mine as well, i have a doctor friend in the area of Liberia and it is bad, .. Just the other day Liberia requested 160 000 body bags(must be a reason for that ; was in a news report will try to find it..The under reporting may be way higher than 2.5. In SL patient are being treated at home (most die) and are not included in most stats... BrianGroen (talk) 05:36, 19 October 2014 (UTC)
- I think this table should definitely be kept. It is usually more up to date than the CDC page or the WHO page. Otherwise, I have to go to the individual health ministries myself. One note: I don't think the % daily growth is calculated correctly. My intuition is that the number is the daily compounded growth for the period of days between the two rows. I am not sure what it is now, but it isn't that.Weanhall (talk) 20:44, 28 October 2014 (UTC)
- Agree, calculation problem. More specifically: The only way to get the current rate to come out to 4.1% is to calculate 12,008-9,936=2,072; 2,072/9,936=0.2085; 0.2085/5 days=0.0417; truncating instead of rounding gives 4.1%. Compounding would require about 3.7%. The linear calculation matches the figures at the top of the table, but then October 5 comes out 1.8% not 1.7%, and then September 21 and everything older comes out higher than the given percentage; perhaps they were calculated with compounding. Art LaPella (talk) 21:34, 28 October 2014 (UTC)
Maybe can there be a column for 'new cases per day' instead of percentage?174.29.76.246 (talk) 04:14, 30 October 2014 (UTC)
why are Doctors Thomas Frieden and Anthony Stephen Fauci not mentioned anywhere in this article?
they have been very deeply involved in this 2014 crisis and situation, and both testified in the United States Congressional hearing on the Ebola crisis (on October 16th 2014). Why is there zero mention of these two doctors, Dr Frieden and Dr Fauci, in this article? Arguably there should be, at least something. Given their heavy involvement in this matter. Regards. Gabby Merger (talk) 19:46, 16 October 2014 (UTC)
Hi Gabby Merger agree will see what i can do tomorrow... Night time buy me..greetings Brian. BrianGroen (talk) 20:17, 16 October 2014 (UTC)
- For now, Frieden is already mentioned at Ebola virus outbreak in the United States. Art LaPella (talk) 20:34, 16 October 2014 (UTC)
- That's fine, Art, but Frieden should be mentioned somewhere in this article too. And Dr Fauci also, who is not even in the "United States" article. Fauci has been in interviews galore regarding this, is a well-established immunologist etc, and testified in the Congressional hearing today regarding this. Regards. Gabby Merger (talk) 21:19, 16 October 2014 (UTC)
In my opinion, they should not. The article, as of now, is about the West African outbreak. Yours is an American perspective.
- Given that the US political silly-season is upon us, I would just as soon not see Frieden (or other Obama-appointed bureaucrats & critics assorted) mentioned, as it would attract a certain species of editor to the article like flies to manure. (So, agreed, albeit for different reasons.)--Froglich (talk) 18:23, 23 October 2014 (UTC)
Zezen (talk) 21:57, 16 October 2014 (UTC)
- The problem with your position, Zezen, is that it forgets that the "American perspective" STEMS from the West African situation, since the spread of the disease ORIGINATED from West Africa to begin with. Plus the fact that this is a GLOBAL WORLD...and with speedy travel and communications, etc, every nation is in some way inter-connected. The "American perspective" is not from some isolated thing out of nowhere. But from the outbreak in West Africa, in the first place. Duncan came from West Africa, somehow got to America, and infected a few others in America. It's all related. Regards. Gabby Merger (talk) 04:13, 17 October 2014 (UTC)
- We have plenty of articles about various aspects of Ebola. This specific article is about the epidemic in three West African countries, Gabby Merger, which involves roughly 10,000 cases. Those two physicians certainly deserve to be mentioned in our coverage of the (as yet) very small Texas outbreak, but how, precisely, are they significant to the story of the main West African epidemic? Should we also mention the leading public health physicians in the several other countries in Europe and elsewhere, that have a handful of Ebola cases, in this article about West Africa? If so, why? Cullen328 Let's discuss it 04:49, 17 October 2014 (UTC)
- Support sorry personal opinions of "American perspective" aside, these two doctors were the main reason we have a massive influx of US help in Africa, and defiantly deserve a mention..BrianGroen (talk) 05:01, 17 October 2014 (UTC)
- I strongly agree with Gabby and Brian. Gandydancer (talk) 06:48, 17 October 2014 (UTC)
- I agree that mention of Drs. Fauci and Frieden is appropriate here, but mention should be confined to the specifics about their efforts in West Africa. Any info on them wrt the U.S. outbreak belongs on that article.
- Will get on it, let me just do research on their African input. Any USA info i will add there...BrianGroen (talk) 19:38, 17 October 2014 (UTC)
- 1) Americanization. 2) Plenty of other guys working hard in Uk, France, Geneva etc to mobilise support. 3) This page is obout the epidemic, not the doctors, not the political lobbyists, not the drug companies. Fauci & Freeden, if they are worth their salt, would agree. Robertpedley (talk) 20:11, 18 October 2014 (UTC)
- Sorry, Robert. They should at least have PASSING mention somewhere in this article. America and the UN are the MAIN entities helping out in West Africa. More than France or Switzerland. The UK is the only other country that comes close. So Brits should be mentioned here too. England, America, and the United Nations. It's a global thing, and there's heavy involvement. Regards. Gabby Merger (talk) 23:56, 18 October 2014 (UTC)
- !
This discussion got archived, but I dont think it is over. Gabby has now added 2 extened paragraphs about Fauci & Frieden nto the page, well out of proportion to the general content in this article. Opinions were
- Pro - Gabby, Wikidgood, Gandy, Brian
- Against - Robert, Art, Cullen, Zezen
It looks like a draw to me, so I shall revert the edit due to lack of consensus. I would not have objected to a sentence or two but the current content is way too long. Does anyone know how to et up a dispute resoultion process? Robertpedley (talk) 09:44, 22 October 2014 (UTC)
- I pointed out where Frieden was already mentioned. I don't consider that an oppose. Art LaPella (talk) 13:52, 22 October 2014 (UTC)
- Please strike what I may have said - too late at night or too early in the morning? IMO that info is better put in the US article than this one. Note also, that I opened a new thread re this info and only one editor replied. After 24 hrs I took that to mean agreement and deleted the detailed info. Gandydancer (talk) 14:03, 22 October 2014 (UTC)
- Sorry, Gandydancer I'm on holiday, missed your other thread. Not sure if Art is in favor or abstaining, but I think the score now is
- Pro - Gabby Merger, Wikidgood, Art LaPella, BrianGroen
- Against - Robert, Gandydancer, Cullen328, Zezen
- Still no consensus - and no comment here from Gabby - so I shall remove it again. Robertpedley (talk) 17:49, 22 October 2014 (UTC)
- Sorry, Gandydancer I'm on holiday, missed your other thread. Not sure if Art is in favor or abstaining, but I think the score now is
- And Ozzie agrees on removal as well. Robert you have been reverted, I will go back to the previous version. The US article is in very good shape and well-able to cover this sort of information. Gandydancer (talk) 18:23, 22 October 2014 (UTC)
- It's NOT a "draw". There's more that support than oppose. Because Art, by his own words above, said that he was NOT "opposed", just because he said that "Frieden" was somewhere. So it's more like
- :*Pro - Gabby, Wikidgood, Gandy, Brian, Art
- :*Against - Robert, Cullen, Zezen, Gandydancer
- Also, to the point about "too long", that's fine, so Wikipedia policy and recommendation is to TRIM OR MODIFY, and to not necessarily wholesale remove. So even with that, the total deletion was arguably not really warranted. But overall, in this section and thread, more editors support than oppose. Regards. Gabby Merger (talk) 19:44, 22 October 2014 (UTC)
- I did mean "abstain", as I habitually don't take sides in this kind of Wikipolitics. Art LaPella (talk) 20:04, 22 October 2014 (UTC)
- Also, to the point about "too long", that's fine, so Wikipedia policy and recommendation is to TRIM OR MODIFY, and to not necessarily wholesale remove. So even with that, the total deletion was arguably not really warranted. But overall, in this section and thread, more editors support than oppose. Regards. Gabby Merger (talk) 19:44, 22 October 2014 (UTC)
- Fair enough. So I'll modify what's going on with this (sighs and double facepalm, since this should NOT warrant all this what-to-do...and I can't believe that it is...since the Frieden and Fauci stuff could have been TRIMMED instead of totally removed, etc)....
- :*Pro - Gabby, Wikidgood, Gandy, Brian
- :*Against - Robert, Cullen, Zezen, Gandydancer
- :*Abstain - Art
- The point is that if there was overall support or at the very least a strong draw, etc, tie should go to runner, as in baseball, and the Fauci and Frieden stuff should stay (albeit in maybe modified or trimmed form). Regards. Gabby Merger (talk) 21:10, 22 October 2014 (UTC)
I just read the above exchanges. I don't understand how this got to be an either-or situation -- either remove everything Gabby Merger wrote or leave it all in. I think a brief mention of Dr. Fauci, Dr. Frieden, or both would be appropriate if it fits in with the rest of the content of the article and has a connection with the epidemic in West Africa. I just looked at the two paragraphs in question. The information about Dr. Frieden seems more specific to the United States; it is about what happened at the Dallas hospital so seems more appropriate for the other article. The information about Dr. Fauci is more pertinent since it deals with screening of people wishing to travel to the U.S. from West African countries. Let's face it, the epidemic has spread, even if only slightly, outside of West Africa, so to argue that, if information is not specifically about West Africa it doesn't belong in the article, is wrong. I can also understand the other point of view: if top experts in other developed nations are not mentioned, the article could be seen as being American-centered. The relative amount of support being supplied by each country should not be the only criteria. Relevance is more important. Would anyone go along with including some information about Dr. Fauci? I'll copy the paragraph here so you can look at it:
- Dr. Anthony Fauci, director of the National Institute of Allergy and Infectious Diseases, said "discussion is underway right now" and "all options are being looked at." Dr Fauci told CNN that clear-cut screening is being implemented on the exit end, referring to the Ebola-affected countries' practice of screening outbound passengers before they leave. The current U.S. discussion, he said, centers on "what kind of screening you do on the entry end. That's something that's on the table now." On 16 October 2014, at a United States Congressional hearing regarding the Ebola virus crisis, Dr Fauci warned that drug companies were still some distance from producing sufficient quantities for widespread trials.
If you look at this paragraph, overall it is not a very cohesive paragraph. You'll see that the first sentence is a bit vague and general; perhaps that could be left out. The second part is about screening, which I think is relevant, and there may be more up-to-date information about that. The third part is about the availability of drug treatments; that seems relevant, but perhaps belongs in another section. So, in sum, a little information, the most relevant, about Dr. Fauci, placed in the right place in the article, seems appropriate to me. CorinneSD (talk) 00:59, 23 October 2014 (UTC)
- I have been through this article many times as the disease has progressed from a few hundred cases to thousands of cases. As more important information emerges, information of lesser importance obviously needs to be cut or the article would grow to an unacceptable length. I have come to the point where I have cut the names of everyone except Margaret Chan of the WHO and the names of presidents of their individual countries when I come across them in a review. I see no reason to include Dr. Fauci's or Dr. Frieden names. I don't think it's needed and I also don't think it's right to appear to suggest that one country's head of this or that health department is more notable than that of another. As for the info on screening, we have a good US article that is well-kept and up-to-date, thus there is no need for that info in this article which, IMO, would also seem to suggest that the US was special and we needed to discuss its travel restrictions while not including that info in the other country articles that have splits. That is not to say that IMO it could not be included under "Travel restrictions and quarantines", but that would take a fair amount of work/time to get it done right - besides the concern about the length of the present article. I did use the Dr. Fauci source and add info to the Treatments section. While IMO it was not needed, I think that it improves the section even though (IMO) it only says the obvious. I want to make something very clear: I do NOT like to delete the work of others - I hate it. It is not any fun at all to suggest that I know better than another editor what this article needs and what it doesn't need. Sometimes rather than delete I go through the ref and see if I can improve what I may find fault with, but there is not always time for that. In this case I felt that the info was either not appropriate for this article or already covered. I'm sure that there is plenty of room to improve this article, but on the other hand there is not plenty of room to fit it all in. Gandydancer (talk) 12:18, 23 October 2014 (UTC)
- First of all, Gandydancer, America IS ahead (at least in certain ways) in taking the lead on this matter. Whether you happen to like that fact or not is irrelevant. It happens to be (in many ways) a fact. But even if it wasn't, what is so wrong in giving at least brief or trimmed mention to Frieden and Fauci in this article, since they definitely were involved in all this? The whole thing is CONNECTED, since it originated in West Africa. And America is definitely heavily involved. Arguably (in a way) more than other countries. Against, whether Gandydancer personally likes that fact or not, is immaterial. It is what it is. And again, even if that wasn't so, they are still definitely heavily involved...and it stems from the West Africa situation. It didn't have to be all or nothing, like you kept uptightly doing. (To be frank.) You could have modified, changed it, or trimmed it. Instead of wholesale removing it. WP suggestion is really to NOT do what you did. But to modify, alter, or touch up, or trim. Good day. Gabby Merger (talk) 23:16, 23 October 2014 (UTC)
- Gabby, I think the other editors have carefully considered your suggestions and they have either given respectful alternatives, or given good reasons for not accepting them. Please remember that Wikipedia works on a principle of consensus WP:Consensus. Robertpedley (talk) 21:16, 24 October 2014 (UTC)
- Robert, there IS NO CONSENSUS "against" having those names in the article somewhere to any degree. It's a DRAW. Count the numbers. It's even and equal. So what do you mean by "consensus" exactly? There's no majority against with this. It's even...a draw. So you don't need to lecture me. Learn to count. There's no "consensus" with this matter. Thanks. Gabby Merger (talk) 23:46, 24 October 2014 (UTC)
- Comment: I oppose inclusion of about 95% of the trivial cruft in this article (to include names of lesser-notables, and the nitty-gritty of who got sick when/where/why)....for the simple reason that over the course of the next two years (which is my OR guess as to how long this plague is going to run, at minimum) they're all going to be eventually junked anyway as a greater volume of bigger-ticket items crowd them out. In the end, the page will be similar to the 1918 flu pandemic article.--Froglich (talk) 10:09, 25 October 2014 (UTC)
- Comment: I agree with User:Froglich User:Gandydancer User:CorinneSD and other and oppose inclusion of the Nurses union story, Dr. Fauci and other peoples names other than other than a handful of the initial case patient names as has been included for all countries. CDC does have a large role (maybe outsized role?) along with various organizations in many countries in the initial discovery of Ebola, isolating several of the virus species, and ongoing containment efforts. Yet IMO day-to-day pronouncements are not relevant unless they are crucial to understanding the situation in areas where >99.9% of the cases occur. All such day-to-day and US controversy is exceptionally well covered in the US article.Greenbe (talk) 17:44, 25 October 2014 (UTC)
- Gabby Merger, are you now persuaded by the arguments of User:Gandydancer, User:Froglich, and User:Greenbe? Let's preserve a sense of collegiality. Don't feel ganged-up upon; you're part of the group. What do you think? CorinneSD (talk) 19:21, 25 October 2014 (UTC)
- ??? "Ganged up on"? That would be the case if I was the only one who had this position. But I'm clearly not. I was making the point that it seemed fitting that at least SOME mention of Frieden etc should be somewhere in this main article, because of their heavy involvement in the overall matter. I'm not persuaded otherwise, because it's simply a fact. Stop assuming. This has gotten ridiculous. And you notice that I have not put anything back onto the article in days and days now, because I don't really care much anymore. It's NOT worth all this hassle. I kind of moved on already in that sense. I just find it silly that there's this what-to-do goof-tarddery over something so minor, and so obvious. Frieden and Fauci should have at least passing brief mention, in this article, period. For the reasons I stated above, which please re-read. Gabby Merger (talk) 21:13, 25 October 2014 (UTC)
- Gabby, People aren't exhibiting 'gooftarddery.' You were telling people to learn to count bc if they could add they would see your opinion was in the majority, but you incorrectly included Gandy in the Pro column, and even if he were (which he wasnt), you were not ahead; so even at that point the majority was against you. I agree with others like Greenbe, so now the count is 8 to 3 against your opinion.JustinReilly (talk) 22:16, 25 October 2014 (UTC)
- Yeah, the Gandy inclusion was a mistake. That's true. But I did not say recently (if you read all my comments carefully) that there was recently "more" on my side. I said clearly in my last few remarks the last few days that it was a DRAW. But ALSO, even if it's not, the point stands (which I'm NOT even pushing anymore as far as actual edits, for a while now), that arguably some mention should be made of Frieden and Fauci in this article, where the USA is mentioned. It seems a bit incomplete in a way that they aren't. But of course I respect consensus. Even when it's wrong. Cheers. Gabby Merger (talk) 22:31, 25 October 2014 (UTC)
Incubation period defined further and changed
I have been reading news about 95% of cases incubate within 21 days and 98% within 42 days. I think this is vital information and I am going to try and carefully incorporate it into the page. However, exactly how is a question. For example. When there is a sentence that PERSON X will be quarantined for 21 days. Do we followup with a sentence that states this catches 95% of cases? http://currents.plos.org/outbreaks/article/on-the-quarantine-period-for-ebola-virus/ http://www.forbes.com/sites/jonfortenbury/2014/10/15/21-days-not-a-long-enough-quarantine-for-ebola-according-to-new-study/ Pbmaise (talk) 03:25, 17 October 2014 (UTC)
- That's a single study representing the conclusions of that researcher. I don't see that this study represents the consensus of published sources. If lots of medical sources start reporting that a 21 day quarantine is inadequate, we can reconsider. Cullen328 Let's discuss it 05:14, 17 October 2014 (UTC)
Dear Pbmaise you already stated a discussion for this topic on Ebola virus disease, it helps us, if you inform us in that case, so that we do not discuss it twice. The information is also not new, the readers new about this when they completely read all references given for the first two sentences of this article. In the moment it is reference 6 of this article. You find it in [1], see for instance page 1487 and 1489. With kind regards, Malanoqa (talk) 06:32, 17 October 2014 (UTC)
References
- ^ WHO Ebola Response Team (23 September 2014). "Ebola Virus Disease in West Africa — The First 9 Months of the Epidemic and Forward Projections". New England Journal of Medicine. Retrieved 23 September 2014.
- Dear Pbmaise I looked at both talk pages. I read and searched all 3 articles, Haas (PLOS), Forbes, and NEJM. I could not find the text "98%" or "42" at all in any of them. Is there another ref for that I missed? Haas suggests 31 days but says it needs to be checked against cost/benefit. NEJM (WHO research team) says "approximately 95%" had symptom onset with 21 days of exposure, but later concludes "The measured duration of the incubation period, and its variation, imply that the advice to follow case contacts for 21 days is appropriate." Note Haas is reviewing available data and models from several older outbreaks, but WHO is using data collected during the 2014 outbreak up to mid September. NEJM is clearly a good source (respected peer reviewed journal), Haas is just one Civil/Environmental engineering professor. I don't know it seems slim another primary ref would be good (not just press citing these articles). Greenbe (talk) 02:11, 21 October 2014 (UTC)
- WHO said in a recent report that 21 days was the maximum time to symptoms. In the next sentence, it said that 95% have symptoms by day 21 and 98% by day 42. So I guess they are nominally adopting both positions; but really it's just more incredible sloppiness from WHO so I guess they should just be ignored because once again they are not a reliable source, although they are a "Wikipedia Reliable Source."JustinReilly (talk) 22:25, 25 October 2014 (UTC)
- Dear JustinReilly "WHO said in a recent report" can you please provide the link? I would like to read it. I kind of vaguely remember seeing this a while back but cannot find the actual ref. My only direct WHO reference is embedded in the NEJM paper, which was written by a WHO team. But the text "42" is not in NEJM based on my search. I totally assume WP:AGF and you have seen this text somewhere but please provide a pointer if you can. This thread is spread on two talk pages I did my best to gather up all links. I am not saying we should discard WHO as a reliable source. 42 days would have big implications if it bears out to be accurate.Greenbe (talk) 01:58, 28 October 2014 (UTC)
- Greenbe, I couldn't find the 98% number in the WHO NEJM article either. Here is the WHO report I was referencing. See section called "Incubation Period."
- http://www.who.int/mediacentre/news/ebola/14-october-2014/en/JustinReilly (talk) 02:53, 28 October 2014 (UTC)
- One possibility is that the WHO aren't blithering idiots, but are simply misunderstood. From an epidemiologist's point of view, if people develop symptoms within 21 days 95% of the time, that's the incubation period (this may or may not reflect the biological incubation - stay with me...). If person X has an exposure to Ebola and develops symptoms 30 days later, does that mean the actual biological incubation period is 40 days, or is it possible that person X and Y were both exposed at day 0, and only person Y got infected (with symptoms by day 15) and transmitted to person X (maybe there was even a person Z, and all 3 had an incubation of 10 days). Epidemiologic data cannot tell these apart, generally, because not every person in the population is sampled (and humans don't volunteer for inoculation studies). These incubation periods (e.g. 98% by 42 days) are used to determine when a country like Nigeria is Ebola-free (i.e. when 42 days had elapsed since the last case, they were confident that every known case's contacts had had a chance to manifest infection with 21 days, and even if they missed one or two, their contacts are also past the incubation period) and may not represent what would happen in a controlled experiment. -- Scray (talk) 03:27, 28 October 2014 (UTC)
- JustinReilly Thanks for the link. Interesting reading. I was only ever aware of "42" in context of a country being declared Ebola free eg. Nigeria. I had assumed it was just double the maximum 21 day incubation, in case someone either recovers or dies without being diagnosed you have double the maximum and 3-4 times the mean. And indeed this very reference supports my theory stating "42 .... is twice the maximum incubation period". But then goes on to up-end the 21 days by saying "98% have an incubation period that falls within the 1 to 42 day interval." and 95% 21 days. What is interesting is these exact numbers appear in NEJM but the conclusion drawn in same paper is that there is no need to monitor beyond 21 days. What I don't know is whether the 95% probability stems from the lack of confidence or accuracy in the raw epidemiological data, or is a clinical/biological fact. They don't say. Nigeria was very effective in quashing it in Lagos (20 million people) after the highly infectious index case by being very aggressive in monitoring a large number of contacts (more aggressive than the US as far as I read) ... but only up to 21 days. My understanding from reading some of these epidemiology studies going back to 1976 is that the mean is around 8-10 days depending on outbreak, and that actually if you are symptom free for 2 weeks past last contact you most likely will not get it but the third week is for insurance. I have not read of any proven confirmed case with symptom onset longer than 21 days past last contact. They studied this in great detail in the initial outbreaks back to 1976 including a nurse that had a needle stick so they knew exactly when she was infected. My impression was the raw data is case-by-case and they delete or otherwise lower weightings on unknown outcomes. IMO any implication in WP that you could possibly incubate longer than 21 days has to be well supported (in data and conclusion by several sources) since it would definitely cause new consternation.Greenbe (talk) 22:33, 28 October 2014 (UTC)
RfC: Is Senegal still relevant in table or can i drop it
Should the Senegal total s still remain in Timeline table or can i clear this section since the outbreak is declared over. Just add a general note omn top. I think keeping it for one case is not worth it. Comments will be appreciated. I can use this space for confirmed cases instead. BrianGroen (talk) 06:02, 18 October 2014 (UTC)
- Do we need an RfC for this? Just ask the question and there should be plenty of response here. - Floydian τ ¢ 07:24, 18 October 2014 (UTC)
- Hi Floydian thought rfc better way so i can get consensus to add lab confirmed cases to table. greetings Brian BrianGroen (talk) 10:05, 18 October 2014 (UTC)
Remove both Senegal and Nigeria -- put the data somewhere else, but not in this article. Both of these countries have stable situations. Shii (tock) 15:56, 18 October 2014 (UTC)
drop it (Senegal); though it might be useful as a reference --Ozzie10aaaa (talk) 17:00, 18 October 2014 (UTC)
The table is currently titled "Casualties", which implies all Ebola-related deaths will be tallied there. Either Senegal should stay (and be marked as "Outbreak ended" or something, and other countries can go there if their outbreaks end), or the table should be renamed "Active outbreaks". Xqxf (talk) 17:14, 18 October 2014 (UTC)
The article is about the whole outbreak in West Africa in 2014, and is as much about the history of the outbreak as it is about its current status. The tables show how the total number of cases and deaths associated with the outbreak have progressed over time. This information will be relevant to the article even when the outbreak is over. The Senegal statistics, small though they may be, will remain part of that history. If the Senegal entry were removed now, there would be no reason to retain any of the other columns in the table either once the outbreak was over. But doing so would remove a significant part of the historical record. For the time being, I believe the Senegal (and other quiesced) columns should be retained, perhaps in another table and/or perhaps just in the Archived section as and when that is extended. Kirbett (talk) 21:37, 18 October 2014 (UTC)
- Keep Senegal possibly revisit later. It's data, so deleting it doesn't seem right. Later, if Senegal/US/Spain terminate but many other countries pop up, then we might make an other countries column. In a way, Nigeria and Senegal are reassuring columns because the disease was controlled/stopped in parts of W. Africa. Adding confirmed cases to the table is a separate issue that needs more thought. I considered doing it a couple months back when I was trying to sort out inconsistent numbers, but didn't because it was more detail with little impact. The table sort of corrected for it later when the number of cases declined (not so true now because the numbers are larger and mask declines, but note Sengal dropped from 3 cases to 1 case). The question is how significant is the confirmed case distinction? I don't know. Glrx (talk) 17:02, 19 October 2014 (UTC)
I went and done it. Shii (tock) 22:28, 23 October 2014 (UTC)
Projections of future cases
In the second paragraph of the section Ebola virus epidemic in West Africa#Projections of future cases is the following sentence:
- "According to a research paper released in early September, in the hypothetical worst-case scenario, if a BRN of over 1.0 continues for the remainder of the year we would expect to observe a total of 77,181 to 277,124 additional cases within 2014."
This is the second in a list of estimates of future cases of ebola virus that counter the estimate offered by the WHO. This is the only one that does not specify who made or published the study. It is not clear whether this study was made and/or published by the person/group in the previous statement or by a different person/group. It's a bit ambiguous in this regard. It would improve clarity and consistency if the researcher or research group were mentioned. CorinneSD (talk) 17:17, 18 October 2014 (UTC)
- Yes, it would. I see a PubMed study is used for the source. Most of us are not able to read the PubMed sources because one must either pay or have a free subscription. In my experience I generally just accept that the info is accurate when it seems reasonable. In this case I would not be concerned, however I believe that Brian has access and perhaps could help here. Gandydancer (talk) 17:50, 18 October 2014 (UTC)
Hi Gandydancer, CorinneSD i have added a diferent paper with the same source info for every one to read.. free from ECDC ..greetings Brian BrianGroen (talk) 18:45, 18 October 2014 (UTC)
- Thanks, Brian. I continue to have the same concern as I expressed above, that the name of the person or group of researchers who conducted and/or published the study is not mentioned. Thus, it is slightly unclear as to whether this person or group is the same person/group mentioned in the previous sentence. One has to read the reference in order to discover that, and it's the only item in the list for which one has to do that. I think the name of the researcher, group of researchers, or research center needs to be named after "According to a research paper released in early September". What would you suggest?
- Also, I glanced at the reference. Is there really a research center called "Eropian Centre..."? CorinneSD (talk) 21:36, 18 October 2014 (UTC)
- @Gandydancer:, @BrianGroen: Could someone please look at the reference note for reference
#244, which starts, "Nishiura, Chowell"? I see Eropian Centre. I just wonder if that is correct. CorinneSD (talk) 16:51, 19 October 2014 (UTC)
- @Gandydancer:, @BrianGroen: Could someone please look at the reference note for reference
- I don't get anything for that, but it was published in Eurosurveillance BTW, yes - when we use a single scientific study it should say "one (or a) study" and include the date (month/year). The name of the researchers/institution is not necessarily needed unless it is significant for some reason. Gandydancer (talk) 01:24, 19 October 2014 (UTC)
- Hi CorinneSD,Gandydancer the ECDC do exist and the authors are the same for the first paper published. Eurosurveillance is a spin off site for their main site and is listed right at the top of the article. I added it to the external links but some one deleted it.. ECDC also list breakout numbers from Africa and developments. I added the authors name to link. Greetings Brian BrianGroen (talk) 04:59, 19 October 2014 (UTC)
- I don't get anything for that, but it was published in Eurosurveillance BTW, yes - when we use a single scientific study it should say "one (or a) study" and include the date (month/year). The name of the researchers/institution is not necessarily needed unless it is significant for some reason. Gandydancer (talk) 01:24, 19 October 2014 (UTC)
Link to ECDC ebola page [5] BrianGroen (talk) 05:51, 19 October 2014 (UTC)
- Note that BRN (aka Ro) varies over time, often denoted Rt or R(t). I've seen conflicting data from recent weeks in 2014 outbreak. Eurosurveillance seemed to show Rt declining close to 1 in the longer running sub-outbreaks, NEJM seems to show Rt in a range of 1.7-2. Clearly if they are right the large number of cases seems likely. http://www.nejm.org/doi/full/10.1056/NEJMoa1411100?query=featured_home#t=article Greenbe (talk) 02:34, 21 October 2014 (UTC)
- Greenbe - I'd guess that Ro also varies geographiclly - outbreaks in well prepared areas trend to <1, in poorly prepared areas >1. Outbreaks which are extinguished (Dallas, Nigeria) eventually come down to zero. The problem with this outbreak is that the statistical measures are all unreliable. Robertpedley (talk) 21:02, 21 October 2014 (UTC)
- Agreed it will vary with many factors, geography, virus strain, reaction (Nigeria was very aggressive in contact monitoring). My understanding is you don't need to get to 0, just <1 for it to be extinguished. If it stays >1 it becomes endemic. I don't know that the conclusion to draw is that the statics are unreliable. They have a large amount of data this time around and they have ways of averaging out the uncertainty in the source data. Also, the 1.7-2 is in the range of past outbreaks which were studied in detail long after they had ended (long term seems to be 1-2 range). My point is that R(t) appears to be a time-window calculation so it depends on the window you choose. Naturally you will get a higher answer for a longer window in a declining situation. What we all want to know is the instantaneous rate today "R(today)" but we don't have that answer because we don't know how the countermeasures have changed since they operate in the future by definition.Greenbe (talk) 22:57, 28 October 2014 (UTC)
Nigeria section
On 9 October the European Centre for Disease Prevention and Control (ECDC) acknowledged Nigeria 's positive role in controlling the effort to contain the Ebola outbreak in this country. "We wish to thank the Federal Ministry of Health, Abuja, Nigeria, and the staff of the Ebola Emergency Centre who coordinated the management of cases, containment of outbreaks and treatment protocols in Nigeria." Nigeria's quick responses in isolation all cases within three days were of particular importance in controlling and limiting the outbreak according to the ECDC.
[cite web|url=http://www.eurosurveillance.org/ViewArticle.aspx?ArticleId=20920%7Ctitle=TRANSMISSION DYNAMICS AND CONTROL OF EBOLA VIRUS DISEASE OUTBREAK IN NIGERIA, JULY TO SEPTEMBER 2014 |publisher=European Centre for Disease Prevention and Control|date=9 October 2014|accessdate=18 October 2014]
I think this is worth a mention as the swift reaction of Nigeria halted the spread with great care.. THE European CDC credits them for that... thoughts.. BrianGroen (talk) 05:08, 19 October 2014 (UTC)
- Agreed. The Nigerian response was absolutely astounding: a country with only a fraction of the resources found in the West, dealing with an outbreak in a densely populated urban area with significant poverty, reacted with what should now become a textbook example of how to contain an outbreak and stop it from becoming an epidemic. Perhaps the Nigerian public health planners (and their advisers such as the Special Adviser on Public Health for the Lagos stage government Yewande Adeshina) should now be invited by the CDC to help them in the U.S. -- The Anome (talk) 12:03, 19 October 2014 (UTC)
Hey, guys. As of today, Nigeria has been declared Ebola-free, could someone note that? — Preceding unsigned comment added by 73.34.74.251 (talk) 12:39, 20 October 2014 (UTC)
- done Art LaPella (talk) 14:27, 20 October 2014 (UTC)
Let's not get too exited with these temporal, ephemeral pieces of good news -- this outbreak is far from over, and if the disease enters Mali and especially the Ivory Coast (likely at this point), Nigeria will soon be dealing with it again, and this time on a scale it cannot begin to address.--Froglich (talk) 18:12, 23 October 2014 (UTC)
Bold-Revert-Discuss cycle regarding the exceptional character of the epidemic
So having noticed that one of the notable characteristics of this outbreak/epidemic cycle was not mentioned in the article, I put in a line to the effect that the current epidemic was notably not in a geographic zone in which previous outbreaks outbreaks had occured. This is of course a paramount and notable feature and its lack of mention was a normal oversight as people hustled to put quality information up onto mainspage. And I would add that overall a remarkable job has been done. I have had a number of edits go through on this and related pages and there has been some in depth discussion related to issues of framing, nomenclature and stigmatization.
Here I am seeking some feedback on this edit cycle. I am pleased to see that the point about the epidemic being notably in a new geographic zone has survived at least had survived and as far as I know is still in mainspace, as well it should be. But I think that there needs to be some kind of adjective so that lay readers who are not following epidemic history understand that this is not a bland unimportant fact.
There was a partial revert which is actually somewhat amusing. This edit left my main point unmolested, to wit, that the epidemic is widespread and in unprecedented areas etc. But the editor took out the phrase used to alert readers to the heightened importance of that factoid. Admittedly there are better was to state it, and I will go ahead and try something else, per WP:BRD, and this section serves the"D" function if anyway cares to make suggestions.
Please note that there are RS's who have characterized the epidemic as alarming, disturbing, unprecedented and so forth. So it is not "editorializing" on my part to so assert. It might have been more appropriate to put a "Citation needed" tag after the word I chose, which is that this is "disturbing" in that these areas had heretofore not been considered to be at risk of Ebola. But it is obviously not just a dull factoid of no importance. The fact that some factor, be it fruit bat flight patterns, air travel, monkey meat marketing or "the swamp gas/space aliebs/flouridated water" - something different has happened to activate pathogenic EBV in these areas. This is prima facie alarming, disturbing and unprecedented as tons of WP:RS attest.
So while I understand the intent of the reverter and of course WP:AGF, I will have to proceed per WP:BRD to have the mainspace reflect the RS. Let's not pretend that the proliferation of Ebola disease is somehow NOT unprecedented, alarming and disturbing. It is not our job to sensationalize but neitheris it our job to take a vital concern of our times and render it as a dessicated topic like programming assembly language, therules of civil procedure, or air conditioning repair. The Ebola epidemic is an epic drama of heroism and sacrifice and the fate of nations lies in the balance. It is not "editorializing" to present Wikipedia content in a neutral, truthful and reliable manner reflecting the humanitarian concern at the heart of the Ebola response. Wikidgood (talk) 22:52, 19 October 2014 (UTC)
- I have not been adding content to the article as others have, but I can speak to the choice of words. The guideline is at WP:EDITORIALIZING, which I will copy here:
- "The use of adverbs such as notably and interestingly, and phrases such as it should be noted, to highlight something as particularly significant or certain without attributing that opinion should usually be avoided to maintain an impartial tone. Words such as fundamentally, essentially, and basically can indicate particular interpretative viewpoints, and thus should also be attributed in controversial cases. Care should be used with actually, which implies a fact is contrary to expectations; make sure this is verifiable and not just assumed. Clearly, obviously, naturally, and of course all presume too much about the reader's knowledge and perspective and are often excess verbiage. Wikipedia should not take a view as to whether an event was fortunate or not.
- More subtly, editorializing can produce implications not supported by the sources. Words such as but, however, and although may imply a relationship between two statements where none exists, perhaps inappropriately undermining the first or giving undue precedence to the credibility of the second."
- I have placed in bold face type what I think is the pertinent sentence. One can substitute "disturbing" for "fortunate" in that sentence. I think words that convey emotion such as "disturbing" and "appalling" are not appropriate. However, words such as "unprecedented", "unusual", "highly unusual", and "unexpected" might be appropriate because it is possible to support these with facts. The best course, I think, would be to quote or paraphrase an expert or the WHO here. I agree with your point that this unusual aspect of this outbreak should be mentioned. I'm sure things have been said about the very thing you wish to highlight. CorinneSD (talk) 23:32, 19 October 2014 (UTC)
- Calling something "disturbing" is a value judgment which should not be made in Wikipedia's editorial voice. This is another case of the "Hitler was evil" rule -- yes, we know Hitler was evil, but it's not our job to make that observation directly, and you won't find it in that article: we just report the facts that lead to that conclusion. The same applies to this epidemic: we should report the facts about it, of which there are many that are indeed really disturbing, and let the reader form their own judgment.
- On the other hand, we can certainly quote other significant sources describing it as such per WP:NPOV, and as CorinneSD says above, words like "highly unusual" or "unprecedented" would be fine to say in Wikipedia's editorial voice, because they can be backed up with factual references, -- Impsswoon (talk) 13:26, 20 October 2014 (UTC)
- I reviewed the lead and I think all the text in there is fine. But I would vote to reorder the second paragraph first to emphasize the severity of the outbreak, which is the most important thing about it to a new reader. Specifically take "is the most severe outbreak of Ebola since the discovery ...." from the 2nd paragraph and precede and insert as second sentence 1st paragraph as "It is the most..." and continue with the rest of the 2nd para and make 1st paragraph second. I wouldn't change anything else but to me that way it flows better. Greenbe (talk) 02:47, 21 October 2014 (UTC)
- OK, I did a trial lead change using Greenbe's suggestion and I really think it's a great improvement. What do others think? I did leave out the "by September the number exceeded all previous..." since we already said it's the worst, we don't need to repeat that fact. Gandydancer (talk) 12:20, 21 October 2014 (UTC)
- (1) Just a quick questions regarding this clause: "since the identification of ebolaviruses in 1976". Were several ebolaviruses discovered in 1976, or was one ebolavirus discovered in 1976 and others after that? Normally, one thing is discovered for the first time -- ie., the ebola virus -- with the discovery of specific strains following that discovery. What is the case here? Just thought the singular/general "the ebola virus" would sound better, but if that's not correct, we'll just leave it as it is now. CorinneSD (talk) 21:08, 21 October 2014 (UTC)
- Answer: 2 species (members) of the genus Ebolavirus caused the 1976 outbreaks. The Sudan specie in south Sudan, the Zaire specie in DRC (which was called Zaire at that time). It was two separate outbreaks barely a month or two apart in 1976, and about 1000km apart. The details of the separate species was only known later. If you read older literature on this it is very confusing because the taxonomy naming was changed in the last 10 years, and the names of the places after which everything was named also changed, and it took many years to figure out the details, and the word specie and strain are mixed up since it was all codified much later. Zaire species is the one responsible for this outbreak, and for most of the more deadly outbreaks. My understanding is there are sub-strains of Zaire in 2014, which do not get their own taxonomy, and that the two sub-strains caused two separate outbreaks in 2014. Late news is there is a new outbreak in DRC in August, also Zaire, and unknown which sub-strain until genetic mapping is done.Greenbe (talk) 18:30, 25 October 2014 (UTC)
- (2) I made a few small changes to the wording. Hope everyone approves. I have a question about this sentence in the lead:
- "Cases of secondary infections of medical workers in the United States and Spain have occurred, neither of which has yet spread to the general population."
- Since the title of the article is "Ebola virus epidemic in West Africa", I wonder whether this sentence is appropriate for the lead. If it is important, then I wonder whether a few words could be added to the sentence to show the connection to West Africa. The way it is, the sentence gives no clue as to how they got a disease from a West African epidemic. Or perhaps it is felt that if a reader wants to know more, the reader can read on. CorinneSD (talk) 21:40, 21 October 2014 (UTC)
Corinne, re question #1 about viruses: Re the use of "the", see below:
- According to the rules for taxon naming established by the International Committee on Taxonomy of Viruses (ICTV), the name of the genus Ebolavirus is always to be capitalized, italicized, never abbreviated, and to be preceded by the word "genus". The names of its members (ebolaviruses) are to be written in lower case, are not italicized, and used without articles.
To go on:
- The genus Ebolavirus is a virological taxon included in the family Filoviridae, order Mononegavirales.[Attention: This template ({{cite doi}}) is deprecated. To cite the publication identified by doi:10.1007/s00705-010-0814-x, please use {{cite journal}} (if it was published in a bona fide academic journal, otherwise {{cite report}} with
|doi=10.1007/s00705-010-0814-xinstead.</ref> The members of this genus are called ebolaviruses.] The five known virus species are named for the region where each was originally identified: Bundibugyo ebolavirus, Reston ebolavirus, Sudan ebolavirus, Taï Forest ebolavirus (originally Côte d'Ivoire ebolavirus), and Ebola virus, formerly called Zaire ebolavirus. Both the Ebola virus and the Sudan ebolavirus were discovered in 1976 in separate outbreaks in Zaire (as it was then called) and in Sudan.
As for the wording in the lead, I'm not very good at wording and struggle to no end when I make my own edits. But I would have used different wording, and it would not contain "has not yet spread to the general population". (I believe that both the Spain and US outbreaks should be called "outbreaks" as part of the ongoing epidemic that began in Africa.) Gandydancer (talk) 02:48, 23 October 2014 (UTC)
- Thank you Gandydancer +1 like to the structure of the new lead I think it reads much better. IMO it should stay as is and we can make minor tweaks as new info develops. Speaking of which, I think you need to add a short mention of the new DRC outbreak in the lead paragraph 2. http://www.cdc.gov/vhf/ebola/outbreaks/drc/2014-august.html which is a long distance from the other outbreaks.Greenbe (talk) 18:40, 25 October 2014 (UTC)
- Greenbe, I think the lead is pretty good too but it does oddly jump into saying we have "Cases of secondary infections of medical workers in the United States..." without ever actually mentioning the US index case (and now we have a second person that caught the disease while in Africa)... I've tried to figure out a simple and short way to put it and have not been able to figure anything out... CorinneSD do you have any ideas? Re the DRC, it was in the lead while there was so much concern that it might be related but one no longer hears anything about it. I did't take it out but tend to agree with whoever did. You could bring it up for discussion if you feel strongly about it. Gandydancer (talk)
- Greenbe I think it looks fine the way you did the DRC. I did change Mali back... Gandydancer (talk) 02:53, 28 October 2014 (UTC)
Norway
Here is the section on Ebola virus epidemic in West Africa#Norway:
- "On 6 October, MSF announced that one of their workers, a Norwegian national, had become infected in Sierra Leone. Special facilities at Oslo University Hospital are being prepared for any Ebola cases.
- On 7 October the Norwegian woman arrived in Norway and is being treated in the Ullevål University Hospital by a team of 23 specially trained nurses and two doctors. She is currently in stable condition and has shown signs of improvement. The Public Health Agency of Canada sent ZMab, a precursor of ZMapp used for testing in laboratory animals, to Norway, and it may be used to assist in her treatment.
- On 20 October, MSF and Ullevål University Hospital announced that the woman had been successfully treated and was discharged. Her identity was also released."
Considering the information that was just added in the third paragraph, I think the other paragraphs may need updating, specifically:
- First paragraph: Even though it's a different hospital, don't you think the special facilities at Oslo University Hospital have already been set up? Perhaps "are being prepared" can be changed to "have been prepared".
- Thanks Corinne. I rewrote the section. Gandydancer (talk) 18:13, 20 October 2014 (UTC)
- Corinne, thanks for copy editing my rewrite and you certainly need never think that I might be offended. My writing is passable but far from really great. We've all worked very hard on the article, and want to be proud of it. IMO you and Art are the ones who have turned a good article into a great article, and I am very grateful. Gandydancer (talk) 13:01, 21 October 2014 (UTC)
- HE he i think CorinneSD pulls her hair out when she see my bad English here...BrianGroen (talk) 17:43, 21 October 2014 (UTC)
guinea numbers
cases DECREASED from 14th to 17th? — Preceding unsigned comment added by 162.119.232.104 (talk) 20:14, 21 October 2014 (UTC)
- It's probably best to view the WHO data as an estimate. It's most likely somewhere between what they report and 2x that. | How many Ebola cases are there really? Snd0 (talk) 01:11, 22 October 2014 (UTC)
Numbers due sometimes fluctuated especially interim reports..BrianGroen (talk) 06:23, 22 October 2014 (UTC)
- Thanks, I have removed 14th now. Numbers were obviously way off (at least inconsistent with the 12th and the 17th)Voorlandt (talk) 20:19, 22 October 2014 (UTC)
- Hi Voorlandt thanks for removing, was to off for me as well.. Besides Liberia only had one days figures.. BrianGroen (talk) 08:08, 23 October 2014 (UTC)
- Thanks, I have removed 14th now. Numbers were obviously way off (at least inconsistent with the 12th and the 17th)Voorlandt (talk) 20:19, 22 October 2014 (UTC)
New PPe guidelines
The CDC have released the new guidelines.. it is a big change but i will attempt to get to it (will add it to EBV main page...More relevant)..Just need to summarize it all.. Also new travel guidelines...only 5 US airports allowed to receive west Africa flights..Will add that here BrianGroen (talk) 06:49, 22 October 2014 (UTC)
- I question the addition of US travel restrictions since we are not currently reporting the travel restrictions of other countries - though I could have missed it... Gandydancer (talk) 18:35, 22 October 2014 (UTC)
Hi gandy Gandydancerdecided to add it there on us page...GreetingsBrianGroen (talk) 11:33, 23 October 2014 (UTC)
- OK, good. Gandydancer (talk) 16:47, 23 October 2014 (UTC)
- Travel restictions are a nuisance, there are 196 countries in the world and I expect every one of them has some kind of restriction by now. Covered (very briefly) in the "Responses" page.Robertpedley (talk) 20:15, 23 October 2014 (UTC)
Archiving
This article is set to archive every four days. That seems too quick to me. Thoughts? Gandydancer (talk) 14:21, 22 October 2014 (UTC)
once a week,maybe better?--Ozzie10aaaa (talk) 16:32, 22 October 2014 (UTC)
- I've slowed the archiving pace.--Froglich (talk) 20:52, 23 October 2014 (UTC)
Article structure once things die down?
We might be a long way off from this, but what changes do you guys anticipate we'll need to make to the page once the outbreak either dies down or becomes a series of events that go beyond the scope of this particular page? MrHassanSan (talk) 03:41, 23 October 2014 (UTC)
- HI MrHassanSan we'll cross that bridge if /when we get there... best call..(on the armed horses) greetings BrianGroen (talk) 11:35, 23 October 2014 (UTC)
- I concur, one does not know which way this could go--Ozzie10aaaa (talk) 15:49, 23 October 2014 (UTC)
- It is hard to know, neigh impossible to know... Gandydancer (talk) 16:42, 23 October 2014 (UTC)
New numbers
Hi all , just a small note.. on the time line and lead there are added section details. If anyone update numbers please shift the "section begin" and "section end" up as well. It cross reference with the EBV page and automatically update that page.. save time and editing that way.. And as special thank you to all helping on this great article.. greetingsBrianGroen (talk) 11:46, 23 October 2014 (UTC)
Just noting the numbers for the map graphic deaths is over 5000 for oct 24 yet the 29th october deaths is less than 5000 — Preceding unsigned comment added by 14.202.101.6 (talk) 03:19, 30 October 2014 (UTC)
Confirmed case in Mali
http://www.bbc.com/news/world-africa-29750723 looks like another country must be added 84.52.48.213 (talk) 21:47, 23 October 2014 (UTC)
It should be listed as an index case, as there has not yet been any transmission within Mali. — Preceding unsigned comment added by 129.59.122.15 (talk) 00:16, 24 October 2014 (UTC)
- It seems Mali has been added already. Supersaiyen312 (talk) 03:51, 24 October 2014 (UTC)
cases table, division
is it wise to split the cases table in two, whatsmore splitting them into major and minor ?--Ozzie10aaaa (talk) 22:22, 23 October 2014 (UTC)
- Move it entirely to the sub-article created for this purpose. ZeLonewolf (talk) 02:12, 24 October 2014 (UTC)
I think the split was wise; there is a huge gulf between the worst country which had local transmission (Nigeria) and the three countries where the epidemic is more or less uncontrolled. Titanium Dragon (talk) 21:41, 24 October 2014 (UTC)
NYC doctor tests positive for ebola
http://www.nytimes.com/2014/10/24/nyregion/craig-spencer-is-tested-for-ebola-virus-at-bellevue-hospital-in-new-york-city.html — Preceding unsigned comment added by Rsskill (talk • contribs) 00:43, 24 October 2014 (UTC)
Nigeria + Senegal clear as of "29 October 2014"?
- Following a 42-day waiting period, both countries were declared disease-free as of 29 October 2014.
Surely this date is wrong? Evercat (talk) 12:40, 24 October 2014 (UTC)
Reminder: only WHO (or other govt.) tallies for totals
Recently an editor has been attempting to include, as a source, a Liberia "sitereport" dated the 19th but submitted as from the 22nd. Request other editors get in habit of, every so often, hovering their mouse arrow over the "cases/deaths" refs under the upper-right image to ensure that only WHO or other government sources are listed.--Froglich (talk) 19:42, 24 October 2014 (UTC)
- Latest available data from government health ministries:
- Sierra Leone: 3896/1281 [6] as of 22 Oct
- Liberia: 4744/2737 [7] as of 20 Oct
- Individual government reports come out in advance of WHO reports, presumably due to aggregation. There is no reason not to update the numbers as they come available from WP:RS sources. ZeLonewolf (talk) 13:47, 25 October 2014 (UTC)
- I was referring to the BIG total.--Froglich (talk) 17:04, 25 October 2014 (UTC)
- There is a very good reason not to update the numbers as they come in from different sources: it's not statistically valid to do so. Ideally, the numbers used in the article should use a consistent source, or if more than one source is used, the model used to produce the combined number should be consistent across the whole table and published in the article somehow. The most recent number published in the article is a good example of this: it appears that there's been a huge jump in case numbers between 19-24 October (>2000, to ~12008), but the WHO situation report for 25 Oct says that the total case number is 10114, which would be more in line with expectations given the current status. The discrepency comes from the inconsistent use of different sources for the numbers. This is important, because even if the WHO numbers are an under-report, it's a consistent error and so the trends will be easier to spot Jonth (talk) 11:35, 28 October 2014 (UTC)
Treatment section
A very large map called "Ebola virus disease in West Africa" has been placed in the treatment section. I can't see how it has anything to do with treatment. Could this be moved, please? Gandydancer (talk) 10:56, 25 October 2014 (UTC)
- Someone (Brian?) made the map smaller - this does help. Gandydancer (talk) 15:21, 25 October 2014 (UTC)
Another vaccine
I didn't see any mention of the Johnson and Johnson experimental vaccine in the article[8]. I couldn't find a technical name of the vaccine. Rmhermen (talk) 19:57, 25 October 2014 (UTC)
at the risk of sounding generic,,,J&J vaccine ??[9]--Ozzie10aaaa (talk) 22:47, 25 October 2014 (UTC)
- Yes please add it! Robertpedley (talk) 22:35, 29 October 2014 (UTC)
Map key colour consistency
Is it possible to have consistency in the map key colours?Akinsope (talk) 20:30, 25 October 2014 (UTC)
The colour scheme in the main map at the top is unclear. However there is a much better key in the global map further down the page.
Would it be possible to use the key structure from the global map i.e. the one showing the following: 1) Widespread transmission, 2) Local transmission, 3) initial cases - deaths, 4) initial cases no deaths, 5) medical evacs death, 6) medical evacs no deaths, 6) Ebola free. For the purpose of the map key in the first map perhaps certain key categories could be omitted if they are not applicable to the countries indicated.
A lot of people are referring to this page around the world and are not really reading further down the page to see the current factual status. This is impacting people's lives as the media spreads misinformation.
A clearer key on the first map people see or even a better presented map could make a huge difference.
Akinsope (talk) 20:29, 25 October 2014 (UTC)
- Perhaps, keep it simple: one color for countries active cases, and another color for countries that have contained the outbreak. In any case, if we're going to use color, please for sanity's sake can we have a legend? ZeLonewolf (talk) 21:09, 26 October 2014 (UTC)
Latest Liberian Numbers
Are the latest Liberian numbers thought to be accurate by WHO, or do they think that Liberia's health care system has collapsed to the point where they simply were unable to record any additional cases? I'm pretty suspicious given the history of Liberian numbers having issues in their reports, but I don't want to add a note to the number without a source for it. Titanium Dragon (talk) 05:42, 26 October 2014 (UTC)
- As the pace of the disease destroys infrastructure in these countries, the tally numbers will go from tardy to unreliable to absolutely hopeless, and there's very little we can do about it.--Froglich (talk) 08:07, 26 October 2014 (UTC)
- IMO the entire obsession with numbers and statistics in this article is a clear example of cargo cult science. These numbers bear little resemblance to reality, and this is even strongly emphasized by the organization that publishes them. The way they are presented, up to the last digit, suggests to the reader a degree of accuracy that is completely unfounded. If at all, these numbers tell you something about the capability and willingness of local authorities to report new cases -- apparently it is declining. --rtc (talk) 10:11, 26 October 2014 (UTC)
yet, numbers are all we have to go by--Ozzie10aaaa (talk) 11:04, 26 October 2014 (UTC)
... and having no numbers at all, would leave us all totally in the dark. I see no choice but to rely on a proliferation of disclaimers and the intelligence of the readers to appreciate the points that you make. Inferring what these numbers actually tell us would unfortunately be either WP:OR or WP:POV Kirbett (talk) 16:48, 26 October 2014 (UTC)
- I like the new disclaimers, and I still want one more: restore the word "reported" to the header at Ebola virus epidemic in West Africa#Timeline of cases and deaths. Art LaPella (talk) 18:00, 26 October 2014 (UTC)
- I don't think there is any OR in what I say; this interpretation is made by the WHO itself and it is already included as a disclaimer in the various pictures displaying the data in the Timeline of cases and deaths section. What is really OR is calculating a "% Daily growth" measure, suggesting to the reader that such an interpretation of the data would bear any validity. Inferring growth rates from the data is exactly what one cannot do. I tend to have the same opinion on the said pictures themselves. In the same way, they are making it seem as if the data had any validity and they are giving the wrong message that the disease is slowly beginning to "burn out". The pictures, as a "finished product" made from the numbers, make it too easy to dismiss the caveats and disclaimers and to assume the raw data reflects reality, which it does not. The actual growth rates are higher and estimated to be in fact not decreasing at all. Plus, the data contains anomalies that obviously cannot be right, such as numbers not adding up, or the latest liberian numbers being unchanged, as mentioned above. We shouldn't use this data to calculate any measure and probably not to draw pictures either. It is useful only for experts with advanced specialist knowledge in stochastic models for further processing and as a very raw input, and those experts have the tools ready to display the data themselves anyway. --rtc (talk) 21:15, 26 October 2014 (UTC)
- So what would you suggest? Remove the data and tables completely? I can't seen how having no access to the data would better inform us. And the lead para to the data and tables does say "The WHO has stated the reported numbers "vastly underestimate the magnitude of the outbreak"" Kirbett (talk) 02:27, 27 October 2014 (UTC)
the "daily growth %" might be better left off the table, it could mislead--Ozzie10aaaa (talk) 21:23, 26 October 2014 (UTC)
@Rtc: @Kirbett: @Art LaPella: @Ozzie10aaaa: I had previously added the ≥ marks to the Liberian numbers when WHO called them out as being especially unreliable, but they haven't been including remarks on the individual data recording capacity of the various countries in their more recent reports. If this is an ongoing problem, or something which has been noted in a RS, maybe we should add that mark to all the table for the three most infected countries? Or possibly relabel the table to make sure that it is clear that this is a very bottom-run estimate of the number of cases? I dunno, I hate to junk up the table excessively but it seems like there should be an obvious disclaimer that these numbers are very questionable so people don't just blindly rely on them. Titanium Dragon (talk) 02:51, 27 October 2014 (UTC)
- The charts and growth rate calcs are correct representations of the trends inherent in the raw data. These charts and calcs are not of themselves misleading - it is the underlying data that is - and there is a very clear bold disclaimer at the head of the table to that effect. I sense that the suggestion to remove the charts and calcs is an attempt to hide the trends that do exist within the data, unreliable though they might be, by making that data more impenetrable and obscure to the less numerate readership. The assumption being made is that, without the calcs and graphical aids, the average readership will be incapable of making any non-trivial sense of the numbers (for why else remove the charts/calcs?). Is this not bordering on censorship? Is it not better to show the trends AND educate the readership further to the probable reasons for those trends, rather than trying to leave them in ignorance? If we cannot state and highlight those reasons because we do not have adequately sourced material to support those reasons, then neither do we have adequate reasons for removing/hiding the charts/calcs.
- That said, concerning the most recent (unchanged) Liberian entries, I would prefer to see these listed as "n/a", and the "daily growth" as "n/a" also for as long as it is based on unavailable Liberian data. And the "daily growth" heading might be better as "reported daily growth". Kirbett (talk) 13:26, 27 October 2014 (UTC)
- Removing the charts is not an illegitimate idea, given that we know that the data is nearly worthless in those countries - WHO estimates that the numbers by be off by a factor of two or more, and we know that the reporting of the data is haphazard at best in many cases. If WHO is to be believed, these numbers aren't even good to a single significant digit. Titanium Dragon (talk) 05:32, 28 October 2014 (UTC)
- Not only that, but the factors of uncertainty vary over time and hence the dynamics of the stochastic process suggested by the raw numbers are wrong as well. For example, the WHO states that recent decline in numbers are most likely not real. The pictures strongly suggest the disease is slowly beginning to "burn out". What other useful information do they convey? I have a hard time seeing any. They merely deceive the reader. The pictures may be "correct representations of the trends inherent in the raw data", as brought forward by User:Kirbett but that's not what readers expect and understand. They want to know the real trends, not illusory trends caused by increasing errors in the data, interesting at most to experts in stochastics who can do their own plots easily. --rtc (talk) 10:08, 28 October 2014 (UTC)
- Removing the charts is not an illegitimate idea, given that we know that the data is nearly worthless in those countries - WHO estimates that the numbers by be off by a factor of two or more, and we know that the reporting of the data is haphazard at best in many cases. If WHO is to be believed, these numbers aren't even good to a single significant digit. Titanium Dragon (talk) 05:32, 28 October 2014 (UTC)
- The latest Liberian stats (24/Oct) seem to have caught up slightly. Hopefully, that's enough to dispel any premature perceptions that the disease might be beginning to burn out. As far as useful information is concerned, I can only speak for myself, but three months ago the graphs confirmed my back-of-the-envelope calculations that the disease was/is really growing (at least) exponentially. The straight line log graph took my breath away, and the first question I asked myself was "what's the slope of that graph"? (hence why I like "daily growth rate"). As far as the under-reporting is concerned, the general public (not just the epidemiologists) need to know that this under-reporting is happening, so that they can make their own best guesses at "the real trends" as you would put it, and my belief is that that's best achieved by providing them with more information, not less. It's the wiki's responsibility to provide the information, along with all the disclaimers it feels necessary. But we can't and shouldn't take away from the readership their responsibility to digest that information correctly and draw their own conclusions. If, in the process, we can educate the general readership into understanding that it's not wise to read too much into just one or two rows of a table of statistics, then so much the better. Kirbett (talk) 15:06, 28 October 2014 (UTC)
- I didn't say the table needs to be deleted. What is arguably violating WP:NOR and quite deceptive are the data plots and calculated measures like "% Daily growth" (which is not even making it clear whether cases or deaths), suggesting interpretations to the general public that are obviously invalid. In the latest Liberian stats we see a slight decrease (!) of deaths. That's so obviously wrong that I'm very surprised about your conclusion that premature perceptions are now dispelled. Whether the numbers are "caughing up slightly" or not, they are hopelessly out of kilter and at this point in fact have become quite useless. Soon, the raw data will be wrong by at least an order of magnitude. --rtc (talk) 15:42, 28 October 2014 (UTC)
- The latest Liberian stats (24/Oct) seem to have caught up slightly. Hopefully, that's enough to dispel any premature perceptions that the disease might be beginning to burn out. As far as useful information is concerned, I can only speak for myself, but three months ago the graphs confirmed my back-of-the-envelope calculations that the disease was/is really growing (at least) exponentially. The straight line log graph took my breath away, and the first question I asked myself was "what's the slope of that graph"? (hence why I like "daily growth rate"). As far as the under-reporting is concerned, the general public (not just the epidemiologists) need to know that this under-reporting is happening, so that they can make their own best guesses at "the real trends" as you would put it, and my belief is that that's best achieved by providing them with more information, not less. It's the wiki's responsibility to provide the information, along with all the disclaimers it feels necessary. But we can't and shouldn't take away from the readership their responsibility to digest that information correctly and draw their own conclusions. If, in the process, we can educate the general readership into understanding that it's not wise to read too much into just one or two rows of a table of statistics, then so much the better. Kirbett (talk) 15:06, 28 October 2014 (UTC)
- Presenting information in a more digestible way (such as charts) is most definitely not WP:OR. The wiki is full of summaries and precis, and charts are simply the most convenient way of summarising and precising tables of data. And I contend that "daily growth" counts as WP:CALC. I agree the column header is ambiguous and should be corrected.
- The latest Liberian stats appear to reflect a change in procedures between their Oct 21st SitRep and their Oct 22nd SitRep. The editor hasn't reflected these numbers onto the charts yet, yet curiously you are campaigning for the numbers to be retained but for the charts to be removed. It is most definitely premature to draw any conclusions from these stats until the next WHO report which I would hope would shed some light on the change in Liberian reporting procedures. Since the table focuses on WHO-reported numbers, perhaps the ">=2704" entry should be replaced by "n/a" until that time.
- And I still don't understand how you think that removing the charts would somehow make the general public better aware of the "hopelessly-out-of-kilter" raw data and generally better informed of the scale of the epidemic. To me, a picture speaks a thousand words, and a chart with a line shooting off the top of it (even though the top may be out by an order of magnitude) says a heck of a lot more than a thousand bland words of text and data. Kirbett (talk) 17:18, 28 October 2014 (UTC)
- Again, the trends suggested by the data don't tell the truth. This is stressed by the source. Thus, plotting the data or calculating a "daily growth" is not a "meaningful reflection of the sources" as per WP:CALC. The data plots are deceptive and are suggesting decreasing growth when in fact they are merely showing underreporting to be increasing according to the source. Heck, the captions are clearly saying "Cases" and "deaths", which in fact the plots clearly don't show. Some plots contain a disclaimer box but readable only when you click on them. Please tell me what you think is a legitimate use of these plots? You say a picture speaks a thousand words, that's certainly true, but that does not mean the thousand words it speaks are the truth. --rtc (talk) 17:38, 28 October 2014 (UTC)
- And I still don't understand how you think that removing the charts would somehow make the general public better aware of the "hopelessly-out-of-kilter" raw data and generally better informed of the scale of the epidemic. To me, a picture speaks a thousand words, and a chart with a line shooting off the top of it (even though the top may be out by an order of magnitude) says a heck of a lot more than a thousand bland words of text and data. Kirbett (talk) 17:18, 28 October 2014 (UTC)
- 1) Please read the very first para of Timeline_of_cases_and_deaths
- 2) WP:CALC says "a meaningful reflection of the source", which in this case is the cited raw data, NOT the undetermined real data
- 3) There is no intent to deceive. You obviously understand what is going on with the statistics. The editors have tried hard to make sure other readers also achieve that understanding
- 4) I suggest you do indeed click on the disclaimer boxes to read them. It is, in fact, hard to read the other parts of those charts (legend, subtitles, scale etc), without actually clicking on them. Kirbett (talk) 18:42, 28 October 2014 (UTC)
- Let's be realistic!
- 1) Many readers will ignore that paragraph, but go right down to the plots because, as you said correctly, a picture speaks a thousand words, so why read a thousand words when you can simply look at the picture.
- 2) the captions are written as if it were the real data and that's clearly what people expect.
- 3) Intent does not matter; the deception does. Unintended or accidental deception is no less of a problem than intended deception. And requiring the average reader to understand things when I do seems like an unreasonably high standard. For example, I read some papers on probability, stochatics and time series in finance while doing some edits in Merton's portfolio problem. I don't think that such background knowledge can be expected from the average reader.
- 4) Hardly anyone will click on them. Given the captions talking about cases and deaths, there is a very clear, straight-forward way in which readers will not click on the plots and misunderstand them. It's like handing a glass of acid with a label saying "water" to some ordinary person and then being surprised when he drinks it... While it was intended for a complex chemical experiment that the guest has no clue about, but would perhaps have known about had he carefully read the microscopic disclaimer above the big word "water" on the label saying "and by the way, it's very likely not actually water, rather it seems to be acid"? --rtc (talk) 19:07, 28 October 2014 (UTC)
- Perhaps you would both be happy with keeping the graphs and changing the captions (other than caption number 4 out of 8, which would seem to be explicit enough for anyone). Art LaPella (talk) 19:30, 28 October 2014 (UTC)
Need to Condense
I realize that this is very much a work in progress, with raw data flooding in daily, but the epidemic isn't projected to slow down any time in the near future; the page is already quite long, even with some of the data having pages of their own. I'm wondering when and how to go about condensing this page, or what can be put where. Thoughts? Scoottz (talk) 01:08, 27 October 2014 (UTC)
- You are right and thanks for the feedback. Which sections do you feel are the most/least important? I'll give a few of my thoughts:
- The "Experimental treatments" section - Could we cut this back to a short introductory para with a direct to the main disease article where they are all listed? Gandydancer (talk) 03:34, 27 October 2014 (UTC)
- The Guinea, Sierra Leone, and the Liberia sections now all have their own articles. Could we retain the overall coverage "Outbreak" section with directs to the individual country articles at this point (as has been planned but waiting for the articles to be improved)? Gandydancer (talk) 03:40, 27 October 2014 (UTC)
- The DRC also has its own article. I'd suggest we get rid of the map/count diagram and reduce the information further. Gandydancer (talk) 03:55, 27 October 2014 (UTC)
- A lot of stuff should be transferred to the secondary pages, if it isn't there already.
- I trimmed "Travel Restrictions & Quarantines" about 6 weeks ago by consensus. The new material here is US related so it should move to that page. Most of this has been added by Hello32020 who's putting a lot of effort into it - sorry, mate!
- "Experimental treatments" - Gandydancer - could lose the biochemical stuff (some of which is incorrect), but I think it is helpful to keep reporting on progress of the various vaccines etc through clinical trials in West Africa & elsewhere so that the reader can get an idea of how each is progressing and how useful they are likely to be.
- Suspected cases - strike completely. There are dozens, every day, in various parts of the world.
- Contained Spread - both Sengal & Nigeria can now be trimmed back. Did either of them get their own page?
- Nigeria redirects to West Africa, and Senegal was not created.. Nigeria could use it's own page, however Senegal with a single "Imported" case did not have a local infection at all, should stay, in full, in the main article (unless future infections occur)..Gremlinsa (talk) 09:21, 29 October 2014 (UTC)
- Medevacs - contains superfluous detail about airplanes etc, could be cut back.
- Projections - each new projection supersedes the previous one, so we only need report the latest
- I should get some free time for some of this in a day or two. Robertpedley (talk) 23:37, 27 October 2014 (UTC)
- Not really a problem, I've just been transferring updates from the U.S. page. If it's too much, feel free to condense. Hello32020 (talk) 23:40, 27 October 2014 (UTC)
- Robertpedley Yes, I agree on TR&Q. While I thought that the US stuff was excessive I thought to just look the other way for a few days since the US reactions were so beyond anything I could have ever even dreamed of (such as the tent outside of the hospital for a nurse with no symptoms what-so-ever...etc....). (She's from Maine BTW - so am I ;) ) Re the Treatment (drugs etc>) section - do what you want as I know you know more than I do in that section. (BTW, did you note the ZMapp recent edits?) Re Nigeria, no there is not a split and I'd suggest we not add one due to the history of the difficulty of upkeep. I'd hate to see much more if any cut since it seems good to keep a good historical record. Senegal, I know I've been cutting all along and it was my feeling that I'd cut back as much as I was happy with last time. I did cut way back on Spain since there is a split article. I agree on cutbacks on Medevacs. Yes projections is long...but on the other hand, oh boy does it ever make an interesting read to see the progress....no? Gandydancer (talk) 01:24, 28 October 2014 (UTC)
- Not really a problem, I've just been transferring updates from the U.S. page. If it's too much, feel free to condense. Hello32020 (talk) 23:40, 27 October 2014 (UTC)
- Hi Siuenti - Medevacs are small in number relevant to the main outbreak. We considered striking them completely a few weeks ago - but they attract headlines. The medevacs in Europe have been managed using military transport places temporarily adapted with biocontainment kits (... yes, the military have this equipment ready in case of biological warfare).
- One section of the US Ebola facility in Liberia be dedicated to high quality care for medical workers - I think the objective is to remove the need for medevac completely, although this has not been stated as an explicit policy. Robertpedley (talk) 21:26, 29 October 2014 (UTC)
- It's true that Britain and Spain evacuated their own people but there are also reports like "[German Defense Minister] has admitted in the past weeks that neither the German military nor any other EU countries have aircraft suited to the task. Only the United States has access to two specially equipped planes, belonging to the Georgia-based company Phoenix Air, which have also been used to transport Ebola patients to Germany." [10] If the aim is to condense the main article, perhaps medevacs could be split off? Siuenti (talk) 12:39, 30 October 2014 (UTC)
And we made the news
To All here, rthis credits all the editors on a job well done...Wikipedia Is Emerging as Trusted Internet Source for Information on Ebola [11] BrianGroen (talk) 05:47, 27 October 2014 (UTC)
Should we back-bench the WHO as a RS?
Despite what I just said a few days ago, I think that in light of the following corruption, we should explore authoritative alternative sources to the WHO for casualty statistics, among other things. Additionally, this "Nero fiddled while Rome burned" behavior probably warrants mention (if it's not already in this, or another, article already).--Froglich (talk) 06:15, 27 October 2014 (UTC)
- Well, A) tobacco kills more people than Ebola does, by several orders of magnitude, and B) by the sounds of it, it was them trying to get people to give them more money. It takes money to make money, as they say, and they can't just slide money around freely in many cases - most likely, the money was already apportioned out for the event. Plus, you know, people love to complain.
- Calling it a "crisis" is a bit silly; it is typical media nonsense. And WHO ultimately gets their numbers from various other national organizations. A lot of people are fundamentally pretty ignorant about how organizations function; most organizations have budgets and other things and plan out stuff like this months in advance, and, as I noted, most likely it was an attempt to get more money for themselves for the cause of tobacco related deaths. People lose perspective on stuff; Ebola has killed fewer people - ever - than the US has die every year of the flu. It isn't that it isn't important, but... Titanium Dragon (talk) 06:26, 27 October 2014 (UTC)
- This is an exponentially expanding epidemic with 70% (or greater) lethality for which no vaccine exists; there is absolutely no comparison to low CFR diseases such as the flu (for which vaccines do exist), let alone non-contagious habit-forming substances such as tobacco. And "It takes money to make money" is an axiom applicable to capital-investment, not bureaucratic corruption. In any event, the currently-used numbers suck anyway (even the WHO now says so).
- -- Does MSF or anyone else on-site regularly publish estimates?--Froglich (talk) 06:43, 27 October 2014 (UTC)
- I've seen quite a few folks making a similar comparison of Ebola with the deaths caused by Malaria - ignoring the exponential growth Ebola poses. And then I saw this quote "The “collapse” of healthcare systems in West Africa because of the Ebola outbreak could lead to thousands more people dying from malaria and other diseases, a leading expert has said, with the additional death toll from malaria and other diseases likely to exceed that of the outbreak itself..."[12] How then to assess casualty statistics ascribable to Ebola? Kirbett (talk) 14:08, 27 October 2014 (UTC)
- Said "experts" don't know how to do math. The CFR of Ebola is 70% or higher. The CFR of malaria is 0.03%. To kill a million people with malaria, 333 million of them have to be infected. For Ebola to kill a million people, it need only infect 1.4 million. Given an exponential doubling time of three weeks and a current extrapolated actual estimate of cases of 25,000 (i.e., 2.5 x latest WHO), there are 50,000 cases in 21 more days, 100k in 42 days (Dec 9), 200k on New Year's Day, 800k mid February and 1.6 million by early-March. And that's assuming the actual doubling time remains only three weeks instead of reducing (since said doubling times represent the averaging of rapid blow-ups with "caught-it-in-time" medical smothers -- however medical logistics are a finite commodity whose efforts dwindle to an infinitesimal once an outbreak passes, well, about the current level of infection). Suffice to say that an out-of-control Ebola outbreak is a depopulationist's wet-dream.--Froglich (talk) 07:29, 28 October 2014 (UTC)
- I've seen quite a few folks making a similar comparison of Ebola with the deaths caused by Malaria - ignoring the exponential growth Ebola poses. And then I saw this quote "The “collapse” of healthcare systems in West Africa because of the Ebola outbreak could lead to thousands more people dying from malaria and other diseases, a leading expert has said, with the additional death toll from malaria and other diseases likely to exceed that of the outbreak itself..."[12] How then to assess casualty statistics ascribable to Ebola? Kirbett (talk) 14:08, 27 October 2014 (UTC)
- Its not a matter of WHO being RS or not. Good data on this epidemic just doesnt excist. Its not getting properly collected. Affected countries gobble something together and forward it to WHO. WHO sums it up, adds a note that the numbers are not exactly adding up and hey presto - sitrep. Cant find better source for data that doesnt excist.217.71.47.78 (talk) 21:16, 27 October 2014 (UTC)
- @217.71.47.78: is correct in his view; there simply aren't better sources available for the data. WHO is collecting data as best they can, and there's no sign that they're unreliable in this instance. We know that the data is unreliable, but the source itself is reliable and is reporting that the data is unreliable, but it is the only data they've got. Titanium Dragon (talk) 23:31, 27 October 2014 (UTC)
- IMO I agree with Titanium Dragon that for a combination of "only data we have" and no evidence to indicate they are have often been a materially wrong source in the past we need to stick with WHO (and CDC for that matter). If we later find another conflicting source we should discuss how to present it at that time. All points above well taken. The one thing we can and should do IMO is to try our best to add perspective. It's not malaria, typhoid or even measles as a killer, but it alarms people because they know how to protect themselves against those. Fact is unless you walk into the room of a known Ebola patient, statistically you are best off to spend your time worrying about lightning next time you see a cloud. Greenbe (talk) 02:22, 28 October 2014 (UTC)
- I couldn't confirm the lightning statistic; you may have used different assumptions. 24,000 or 6,000 deaths worldwide per year from lightning. Using the higher figure, about 65 per day. Our table shows about that many Ebola deaths per day for the last few weeks. It also says the real figure is 3 times higher. And even that figure doesn't count people dying at home, to my knowledge, leaving me wondering if their professional pride allows them to give up and say "We don't know how many". And that's for the last few weeks, not the future. Maybe the epidemic is leveling off, maybe it will grow another order of magnitude or two, and just maybe an exponentially growing apocalypse is coming (yeah I know, they say you have to touch someone to get it, but several infections have happened under unexplained circumstances, and politics dictates keeping people happy for now.) Art LaPella (talk) 03:06, 28 October 2014 (UTC)
Time-frame for article rename
Given that all heavily involved countries now have their own pages, with this article now acting as an umbrella over the rest, it's time to consider renaming again after several weeks. (And especially so with the disease poised to spill eastward through the unstable if not war-torn infrastructure-poor regions of the Sahel, thereby taking it out of western Africa.) Suggest 2014 Ebola epidemic for a title. This should serve for a long time, and perhaps permanently (if the disease remains largely confined to the one continent). I realize the outbreak began in very late 2013, but the massive upswing didn't occur until this summer. I submit November 1 as a potential change date, as that will give us the better part of a week to weigh options.--Froglich (talk) 10:42, 27 October 2014 (UTC)
- oppose - I suggest that this topic be closed. There is no reason to go through yet another long, time-sucking discussion about the title. It is fine. Gandydancer (talk) 11:17, 27 October 2014 (UTC)
- The article has sections for Spain and the United States; it has a world map -- "West Africa" is no longer a sufficient title descriptive. As the outbreak continues to expand, the current title will degrade from mildly inapplicable to badly unrepresentative.--Froglich (talk) 11:48, 27 October 2014 (UTC)
- agree i think its time for a title change--Ozzie10aaaa (talk) 11:29, 27 October 2014 (UTC)
- strong oppose - We have discussed this multiple times, and we are going to stick with what the WHO told me until they change the name of the epidemic.AmericanXplorer13 (talk) 16:18, 27 October 2014 (UTC)
- I emailed my WHO contact about whether we should keep the name "Ebola virus epidemic in West Africa". This is what she said:
| “ | Alex, Yes. West Africa remains the hotspot of intense virus transmission. WHO has declared outbreaks in Senegal and Nigeria over. Mali will likely have more cases but counts as part of West Africa. Onward transmission in US and Spain is very low transmission. Hope this helps. | ” |
AmericanXplorer13 (talk) 16:55, 27 October 2014 (UTC)
- Be that as it may, Wikipedia is not obligated to honor WHO naming conventions, particularly when, as noted above, the page has already segued into an umbrella article linking all the various national pages. Going forward, the article will eventually have a date associated with it anyway, e.g., the 1918 flu pandemic, etc.--Froglich (talk) 22:04, 27 October 2014 (UTC)
- I was referring to the dating in title names of historical disease outbreaks, not the word pandemic (though that may come to pass as well at some point).--Froglich (talk) 12:01, 28 October 2014 (UTC)
- If you can find a source that refers to this as a pandemic that meets the criteria for a WP:RS better than the WHO, then sure.--Taylornate (talk) 22:30, 27 October 2014 (UTC)
- Be that as it may, Wikipedia is not obligated to honor WHO naming conventions, particularly when, as noted above, the page has already segued into an umbrella article linking all the various national pages. Going forward, the article will eventually have a date associated with it anyway, e.g., the 1918 flu pandemic, etc.--Froglich (talk) 22:04, 27 October 2014 (UTC)
- Oppose - The ebola epidemic is called such by WHO. It isn't an epidemic anywhere outside of West Africa. Ergo, the correct name for it is what the article is called today. We may eventually add a date to the epidemic article, or it may end up with some generally recognized name in the future, ALA Black Death. It isn't our place to speculate on what the name will end up per WP:CRYSTAL; we're reporting on what the name is right now. WHO calls it such, people refer to the epidemic as being in West Africa, and it is in West Africa, so I'm not really sure why we would change the name. I don't see any WP:COMMONNAME issues with the present article name, and the article name doesn't have NPOV issues, so there's no reason to change it. Titanium Dragon (talk) 23:35, 27 October 2014 (UTC)
- For with mod - I liked using 2014 to distinguish from the past. But it's still >99% West Africa. I am for 2014 Ebola epidemic in West Africa. This will serve us until January (I sincerely hope).Greenbe (talk) 02:45, 28 October 2014 (UTC)
- Oppose -- as said above, it's only epidemic in West Africa -- the very limited cases in other countries outside West Africa do not even remotely constitute an epidemic. This is not Plague Inc., and we should think very carefully before exaggerating the scope of this serious situation. -- The Anome (talk) 22:38, 28 October 2014 (UTC)
- I'd like to think we could get by with only two more renames (assuming that at some point Ebola hops continents): one rename as it expands out of western Africa ("2014 Ebola epidemic" being IMO ideal, as it's also applicable to the present situation as well), and then epidemic->pandemic later if necessary.--Froglich (talk) 00:30, 29 October 2014 (UTC)
- I'd hope that the public health initiatives to contain this succeed, and we don't have to rename the article at all. -- Impsswoon (talk) 10:49, 29 October 2014 (UTC)
- Froglich also hopes that containing the epidemic succeeds. He said a grim title would be ideal, not the disease. Neither optimism nor Froglich's pessimism is incompatible with good intentions. Art LaPella (talk) 14:12, 29 October 2014 (UTC)
- I'd hope that the public health initiatives to contain this succeed, and we don't have to rename the article at all. -- Impsswoon (talk) 10:49, 29 October 2014 (UTC)
- I'd like to think we could get by with only two more renames (assuming that at some point Ebola hops continents): one rename as it expands out of western Africa ("2014 Ebola epidemic" being IMO ideal, as it's also applicable to the present situation as well), and then epidemic->pandemic later if necessary.--Froglich (talk) 00:30, 29 October 2014 (UTC)
Case fatality rate
I altered the CFR figure from "70.8%" to "approximately 70%": Gandydancer altered it back on the basis that "approximately 70.8%" is not what the source says. But the actual words used by the source are "70.8% (95% confidence interval [CI], 69 to 73)" (see http://www.ncbi.nlm.nih.gov/pubmed/25244186). "70.8%" is not a good way to represent this figure: it gives a false sense of precision by omitting the confidence interval and suggesting a precision to within a 0.1% interval, instead of the much wider interval the source suggests. I suggest that we either say "approximately 70%", or use the entire quoted words -- "between 69 and 73" won't cut it by itself, because that's not actually how CIs work. -- The Anome (talk) 19:26, 27 October 2014 (UTC)
- Agreed; "70.8" represents a False precision fallacy. (There are alarming indications that CFR might, in fact, be considerably higher than 70% due to reticence in various regions for listing Ebola as a cause of death.)--Froglich (talk) 22:16, 27 October 2014 (UTC)
- What does 95% confidence interval [CI], 69 to 73" mean? Gandydancer (talk) 23:12, 27 October 2014 (UTC)
- @Gandydancer: A confidence interval is a measure of statistical confidence; basically, when you say there is a 95% confidence interval, there is a 95% chance that the true value of the thing that you are measuring is within that range. So there is a 95% chance that the true case fatality rate is between 69% and 73%, according to the data set used; we don't know the exact value more precisely than that. So 19 times out of 20, the true value of the CFR is between those two numbers; 1 out of 20 times, it would be outside of those bounds. Titanium Dragon (talk) 23:37, 27 October 2014 (UTC)
- Reasonable, but it diminishes readability. As an aside, the 70.8% stat was obtained in treatment centres, it's not representative of the CFR for people who can't get to them. Robertpedley (talk) 23:17, 27 October 2014 (UTC)
- I've just noticed that the same stat is quoted 3 times in total differently as 70% or 70.8% or 71%. Robertpedley (talk) 23:42, 27 October 2014 (UTC)
- If this idea were extended to the rest of the data in the article, we'd have to put either "approximately" or "(95CI: XX to XX)" all over. The # of cases, beds, physicians, incubation period, transmission rate, etc. That's correct for a paper, and is more precise, but not so fun to read or edit. But as Robert pointed out, it should be the same throughout. Snd0 (talk) 23:44, 27 October 2014 (UTC)
- Considering that 70.8 should be rounded to "about 71" and that is what the CDC uses, I'm going to change it to "about 71". Gandydancer (talk) 00:53, 28 October 2014 (UTC)
- I found the last 70.8 and changed it to "about 71". All three references match now.... consistency is our friend.Greenbe (talk) 02:54, 28 October 2014 (UTC)
- I think they should all go to 70% -- given how horrible the statistics gathering has been of late, it's arguable that even the *first* digit (the 7) is an actually unknown quanta, and that being the case, the next digit (the 1) is pure fantasy. So, to avoid false precision, "approximately 70%" is preferably to 71% (even though, in this case, it's likely to be more correct as I think CFR out in the boonies is probably over 80%).--Froglich (talk) 07:45, 28 October 2014 (UTC)
- @Froglich: We really have no idea what the CFR is like outside of the hospitals. It is interesting to note that Nigeria had a CFR of only 40%. The US has had 8 people who have completed their run with Ebola, of whom only 1 has died; of the 9 victims in Europe, only 3 have died. That is a significantly lower CFR than what we're seeing in the three hardest-hit countries, so it may be that the CFR in those countries is already taking into account the fact that many of the patients are not getting adequate medical care. How many of the patients in that data set went untreated in medical facilities? The CFR could be either an over or under-estimate; it could be an underestimate because of all the untreated people out in the boonies, or an overestimate because it only counts people who actually get reported to the authorities, who are most likely to be the most sick - someone who gets sick and recovers on their own is less likely to be counted. Only if you were to count everyone who got sick would you really get a good estimate of the CFR, and that's fairly unlikely under the circumstances. Titanium Dragon (talk) 09:38, 28 October 2014 (UTC)
- Great post Titanium Dragon and I agree. Now if we could only get a good RS to say this... Gandydancer (talk) 19:13, 28 October 2014 (UTC)
- @Froglich: We really have no idea what the CFR is like outside of the hospitals. It is interesting to note that Nigeria had a CFR of only 40%. The US has had 8 people who have completed their run with Ebola, of whom only 1 has died; of the 9 victims in Europe, only 3 have died. That is a significantly lower CFR than what we're seeing in the three hardest-hit countries, so it may be that the CFR in those countries is already taking into account the fact that many of the patients are not getting adequate medical care. How many of the patients in that data set went untreated in medical facilities? The CFR could be either an over or under-estimate; it could be an underestimate because of all the untreated people out in the boonies, or an overestimate because it only counts people who actually get reported to the authorities, who are most likely to be the most sick - someone who gets sick and recovers on their own is less likely to be counted. Only if you were to count everyone who got sick would you really get a good estimate of the CFR, and that's fairly unlikely under the circumstances. Titanium Dragon (talk) 09:38, 28 October 2014 (UTC)
- I think they should all go to 70% -- given how horrible the statistics gathering has been of late, it's arguable that even the *first* digit (the 7) is an actually unknown quanta, and that being the case, the next digit (the 1) is pure fantasy. So, to avoid false precision, "approximately 70%" is preferably to 71% (even though, in this case, it's likely to be more correct as I think CFR out in the boonies is probably over 80%).--Froglich (talk) 07:45, 28 October 2014 (UTC)
- I found the last 70.8 and changed it to "about 71". All three references match now.... consistency is our friend.Greenbe (talk) 02:54, 28 October 2014 (UTC)
- Considering that 70.8 should be rounded to "about 71" and that is what the CDC uses, I'm going to change it to "about 71". Gandydancer (talk) 00:53, 28 October 2014 (UTC)
- What does 95% confidence interval [CI], 69 to 73" mean? Gandydancer (talk) 23:12, 27 October 2014 (UTC)
The Nigerian and US experiences so far represent too small of samples for valid statistical extrapolation. I would expect CFRs to remain modest when a handful of cases are quickly discovered and dealt with. But when the number of active cases exceeds the capacity of medical infrastructure to cope (or where none exists in the first place, e.g., the two EBOV Congo outbreaks in which cases exceeded 300 had mortality rates of 81% and 88%) -- then CFR goes up and basic reproduction number goes up, and consequently exponential doubling time goes down. In other words, the disease will spread faster and be more lethal. Once panic sets in, doubling time will reduce even further. IMO, Ebola is going to "bomb" over the next few months, and CFR will likely be 80%+ (whether any agency is around, and capable, of counting such massive casualties is another matter).--Froglich (talk) 10:26, 28 October 2014 (UTC)
- I have changed the number back to "about 71%". I have not taken stats but basic math tells me that 71% is closer to 70.8% than 70%. Apparently the CDC agrees as they say, "about 71%" which is more accurate than what a group of Wikipedia editors may feel to be correct. Gandydancer (talk) 16:31, 28 October 2014 (UTC)
- @Froglich: The problem is that we don't actually know if 70% is an underestimate or an overestimate; as I noted, we have things which push in both directions. Some people are keeping their Ebola secret to avoid cremation (which would lower the recorded death rate from Ebola as people kept it a secret) while others are not reporting their Ebola because they recovered from it, possibly not even realizing that they had Ebola in the first place (which would increase the recorded death rate from Ebola because it excludes people who recovered). In the countries where 100% of Ebola cases have been identified, the CFR has varied from 0-40%, but obviously the statistical significance for predicting future cases is low (though note that the CFR in Nigeria actually is 40% by definition, as that is a total count of all cases). Those countries obviously have vastly better data than the most badly struck countries, and thus are picking up all the Ebola patients, even the ones who would have recovered on their own from the disease. As such, we know that Nigerian and American numbers are complete while the numbers in the hardest-struck countries are not. That doesn't necessarily mean that they're better for estimating the CFR, but it is problematic to assume that the CFR is being underestimated when there is potentially a large population of people who get sick and recover and never report having Ebola in the first place. The people who are most likely to be recorded are the ones who seek medical care, who are disproportionately likely to be very ill (hence why they sought treatment) and thus more likely to die than someone who gets ill but doesn't reach the point where hospitalization is required. We're not sampling from a random population, whereas a whole-population sample is always going to give you the "correct" number. We will likely never have a full-population sample from those countries unless we get "lucky" (i.e. a whole village gets Ebola). Titanium Dragon (talk) 22:16, 28 October 2014 (UTC)
- And it's also likely that the CFR is substantially different in the case of patients who are completely without medical care in poverty-stricken rural villages, compared to those receiving care in field hospitals, or still yet those in modern state-of-the-art western facilities receiving 24-hour intensive care and specialist treatments such as zMapp. -- The Anome (talk) 22:32, 28 October 2014 (UTC)
- Absolutely -- as previously noted, past EBOV outbreaks in excess of 300 cases have resulted in CFRs >80%, and were contained only through the fortuitous circumstance of those outbreaks being in remote, low-population regions. The current epidemic is already orders of magnitude beyond the ability of all of the world's medical professionals (if hypothetically transported to west-Africa right now), so I have little reason to assume actual CFR is less than 80%. (But, anyway, I still dislike 71%; we should be saying "over 70%" to avoid false precision.)--Froglich (talk) 22:39, 28 October 2014 (UTC)
- And it's also likely that the CFR is substantially different in the case of patients who are completely without medical care in poverty-stricken rural villages, compared to those receiving care in field hospitals, or still yet those in modern state-of-the-art western facilities receiving 24-hour intensive care and specialist treatments such as zMapp. -- The Anome (talk) 22:32, 28 October 2014 (UTC)
- I like "about 70%" or "around 70%" myself. I don't think it is 80% this time but I guess time will tell. Note the species and strain of the virus may have something to do with CFR but they have never been able to prove that (independent of poverty or remote rural location). One outbreak was 25%. Greenbe (talk) 23:11, 28 October 2014 (UTC)
- That was not an EBOV outbreak. --Froglich (talk) 06:37, 29 October 2014 (UTC)
- Nope that was BDBV. But there are EBOV documented at 45% but small outbreak total cases <50. I looked over the table again and interestingly if you remove all outbreaks <100 cases, EBOV CFR seems to be 70% or above. My point about strain/species is more subtle. For some reason each outbreak comes with its own CFR and there is quite a bit of variance. One obvious source of difference is the species (formerly called strain in a lot of literature since species were classified more recently). But within the current species definition my understanding is there are strains (ie more than one strain of EBOV). But biologically I don't know if they have proved one or the other strain is more deadly. It could just be chance ie the circumstance of the outbreak maybe the next BDBV outbreak will be 90% (and there are BDBV outbreaks with higher rates). All the reports seem to suggest early detection and hydration treatment and age affect the CFR but again no solid proof yet afikGreenbe (talk) 21:39, 29 October 2014 (UTC)
- Hi Greenbe - this is moving into the realms of speculation, but I'm guessing that patients who are already weakened by other factors - TB, malaria, HIV, malnutrition, pregnancy etc will have a worse prognosis. Therefore the CFR will be affected by the demographic of the population or the community where the outbreak occurs. Western medical health workers have a stronger start position, in addition to receiving serum transfusions & experimental drugs.Robertpedley (talk) 22:04, 29 October 2014 (UTC)
- Robertpedley I agree with you, speculation aside. The health status, age and demographic seems to play a part according to reports but I have not seen hard data on that. I would be very curious to see data that tries to figure out the inherent deadliness of a strain/species after trying to control for these other factors. The only other idea I have seen independent of the starting status of a patient is the idea that early detection and maybe aggressive hydration and support for organs like dialysis may improve the odds. None of the serums and experimental drugs have been proven effective yet in humans but I believe there are ongoing empirical studies. That all said, it seems to me that Zaire (EBOV) in general must have an inherent CFR north of 50%, probably 60-70% simply because that was the result over so many outbreaks over time and geography that probably tend to net out some of these other factors. Unknown if early detection and aggressive treatment can get the CFR well under 50%. But this is purely opinion I have not seen any article that addresses the inherent CFR of the virus thoroughly.Greenbe (talk) 16:27, 30 October 2014 (UTC)
- That was not an EBOV outbreak. --Froglich (talk) 06:37, 29 October 2014 (UTC)
The New York Times: Wikipedia Emerges as Trusted Internet Source for Ebola Information
- Cohen, Noam (October 26, 2014). "Wikipedia Emerges as Trusted Internet Source for Ebola Information". The New York Times. Retrieved October 28, 2014.
Might be a useful source for use in this article. — Cirt (talk) 03:08, 28 October 2014 (UTC)
- Oppose -- Including it sans notability constitutes self-promotion. (I could see it eventually being part of Wikipedia's article about itself, but not articles concerning other subjects.)--Froglich (talk) 22:45, 28 October 2014 (UTC)
- I agree with Froglich here. Wikipedia is notably, verifiably awesome, but it doesn't belong in this article. -- The Anome (talk) 22:49, 28 October 2014 (UTC)
- I thought that was intended as a joke ;)
- Can we do smileys here? Robertpedley (talk) 19:20, 30 October 2014 (UTC)
leap to 12,000
was their an unusual contributing factor to the latest "sitrep" which made it leap more than 2000 cases? also the fatalities for Liberia seem to not have changed on the "cases/fatalities" table?--Ozzie10aaaa (talk) 12:33, 28 October 2014 (UTC)
- It looks like there was a significant step change to the Liberian reporting and classification procedures between their Oct 21st SitRep and their Oct 22nd SitRep which provided much higher case counts for most of their counties. At the same time, their fatalities data switched from being cited as "Total death/s in confirmed, probable, suspected cases" to just "Cumulative deaths" taken from individual-level data from Case Investigation forms. Their latest Oct 25th SitRep actually now cites 2106 "cumulative deaths", compared to the >=2704 shown in the wiki table. I don't know if this makes their data more consistent with that from the other countries. Maybe the next WHO report will shed more light on those changes. Kirbett (talk) 16:20, 28 October 2014 (UTC)
- Hi Ozzie10aaaa,Kirbett it looks like a new agency has taken over in liberia to report..but yes it was a huge jump but it did stagnate for a few days.. but apparently hundreds of new cases were counted in the capital region over the previous days. The death rate is questionable .. there is a error of 1000 from previous report so i stuck with the latest WHO report on that .. but that being said it is going to jump by nearly 500 in the next day or two with Sl already reporting 200+ new cases in one/two days. BrianGroen (talk) 20:45, 28 October 2014 (UTC)
The leap isn't real; it is a data artifact. The Liberian numbers have long been considered to be especially under-reported by WHO, and it appears that the new numbers are an attempt at correcting the issue. Titanium Dragon (talk) 22:20, 28 October 2014 (UTC)
- It's certainly an artifact. Histograms with reasonably-sized binning (like Malanoqa's) will be more helpful than line plots to absorb some of this. With Aylward saying that it could jump from 1000/week to 5000-10000/week in the span of two months [13], it seems possible that these corrections will become more frequent, given how far the WHO numbers have already fallen. Snd0 (talk) 23:30, 28 October 2014 (UTC)
- If this is the reason, a note in the article will be necessary. Someone please find a reliable source regarding the increase, please. SYSS Mouse (talk) 01:45, 29 October 2014 (UTC)
- Reduction in Liberia cases is weird, WHO sitrep 29oct figure 2, past 3 weeks - probable cases continue to do their own thing, but weird is that confirmed cases fall to flat zero, especially in the capital area where there are 3 labs that are doing tests all the time. This looks like a serious reporting problem. Actual cases might have or might have not fallen, but if data is clearly bad it cannot be used as a reference.194.126.122.67 (talk) 10:06, 30 October 2014 (UTC)
Graphs need updating
With it nearly November now, the charts not yet including October are becoming quite long-in-the-tooth.--Froglich (talk) 06:40, 29 October 2014 (UTC)23:10, 28 October 2014 (UTC)
- I think the graphs should be removed as the data is no longer accurate. AmericanXplorer13 (talk) 02:09, 29 October 2014 (UTC)
- What charts not including October? The first chart at Ebola virus epidemic in West Africa#Timeline of cases and deaths, for instance, says across the bottom:
- May Jul Sep
- Date, up to Oct/19
- What charts not including October? The first chart at Ebola virus epidemic in West Africa#Timeline of cases and deaths, for instance, says across the bottom:
- Art LaPella (talk) 02:57, 29 October 2014 (UTC)
- Some of the graphs are borderline WP:OR. ZeLonewolf (talk) 03:53, 29 October 2014 (UTC)
- ZeLonewolf, which and why?Malanoqa (talk) 05:44, 29 October 2014 (UTC)
- All of them, see #Latest Liberian Numbers --rtc (talk) 08:47, 29 October 2014 (UTC)
- None of them, see #Latest Liberian Numbers. Some people just don't know how to read them. That doesn't make them WP:OR. The debate at #Latest Liberian Numbers is about the fact that the data is only a biased sample of the real data, being based on reported statistics which are acknowledged to significantly underreport the epidemic, and it is asserted that, being only a sample, the data must therefore be incomplete, inaccurate, useless, and unsuitable for presentation to a general innumerate wiki readership, who would thereby be better informed and more aware of the real scale of the epidemic if all data was removed from the article (except, perhaps, for the minor Ebola outbreaks which are probably totally accurate - maybe). Note that although the debate focuses on the charts, it is actually the raw data (in the tables) that is challenged. Not my point of view, I hasten to add. --Kirbett (talk) 10:24, 29 October 2014 (UTC)
- You are misrepresenting what I said. The charts can only be misunderstood by the general audience. They serve no valid purpose with data being so wrong. The data table itself can be kept, minus the calculated measures like "% daily growth", and a disclaimer can be added. If anyone does research based on this data, we can publish it, but please no homegrown plotting, presented in such a way as to be (perhaps accidentally) deceiving the reader and letting him believe what he sees are (quote) "Cumulative totals of cases and deaths over time", "Average new cases and deaths per day", "Cumulative number of cases by country" etc. --rtc (talk) 13:04, 29 October 2014 (UTC)
- Well, I really don't understand what you expect the general reader to do with large tables of uncharted data. You consider the general reader to be incapable of interpreting the charts correctly and yet to be quite capable of doing something sensible with the raw data. Such as what? Could we not just relabel the charts to say "Cumulative totals of reported cases and deaths over time", "Average new reported cases and deaths per day", "Cumulative reported number of cases by country" etc?
- WP:GRAPHS and WP:HCGWA facilitate the creation of timeline charts for the benefit of the reader, so it's fairly clear that these aren't considered to be WP:OR. That said, there seem to be hundreds of websites producing graphs of the epidemic based on the reported data (just Yahoo search for "ebola graph"), some of which I guess would count as the research you're looking for, according to your definition. Regrettably, the more accessible ones (which I assume are what the general reader would resort to in lieu of the wiki) seem to be the ones most likely to omit disclaimers. Kirbett (talk) 17:06, 29 October 2014 (UTC)
- I don't expect the general reader to do anything with large tables of uncharted data. At least it's not decepting them in the way the questionable charts do. It is not enough to say these are reported cases. The source clearly states that these numbers are wrong. What is so hard to understand about that? --rtc (talk) 11:31, 30 October 2014 (UTC)
- Something that should be considered is that all publications do this, and will continue to do this, even if this article doesn't. Forbes graph based on the raw data [14], NPR [15], The Telegraph [16], BBC [17], and then of course Reddit, Mashable, and other sites that get millions more views. Some of these are simply copy directly from the WHO reports and no disclaimer is given. It's presented and understood to be fact.
- This doesn't mean the graphs should or shouldn't be removed, but most have (or can) see graphs that will be presented as the truth. Snd0 (talk) 17:45, 29 October 2014 (UTC)
- You are misrepresenting what I said. The charts can only be misunderstood by the general audience. They serve no valid purpose with data being so wrong. The data table itself can be kept, minus the calculated measures like "% daily growth", and a disclaimer can be added. If anyone does research based on this data, we can publish it, but please no homegrown plotting, presented in such a way as to be (perhaps accidentally) deceiving the reader and letting him believe what he sees are (quote) "Cumulative totals of cases and deaths over time", "Average new cases and deaths per day", "Cumulative number of cases by country" etc. --rtc (talk) 13:04, 29 October 2014 (UTC)
- I take issue with the new cases per day line graph from a WP:OR standpoint; it's the same issue I and others have with the homebrew % increase per day. The graph is plotting the artifacts of WHO and national government data collection and sampling, NOT the progression of the outbreak. From a readability standpoint, I take issue with the fact that there are 8 graphs and a lengthy table of raw data that all convey the same information. Wikipedia is not a respository for raw data. I understand a few editors are keeping it there as a repository of data for the convenience of graph creation, but it just doesn't belong in the article as it's not encyclopedic.ZeLonewolf (talk) 19:20, 29 October 2014 (UTC)
- ZeLonewolf, which and why?Malanoqa (talk) 05:44, 29 October 2014 (UTC)
- I second that ( especially the daily growth percent)--Ozzie10aaaa (talk) 21:12, 29 October 2014 (UTC)
- The chart you referring to could be drawn as a histogram, with the width and area of each bar corresponding exactly to the time interval and new case count as cited by the WHO report - thus no OR. Such a chart would have exactly the same shape as the one you object to. See also WP:CALC - I understand the definition of basic arithmetic mentioned therein also includes division.
- I know of no disease outbreaks where the statistics have tracked actual cases rather than reported or estimated cases. I know for certain, for example, that flu statistics are strictly wrong, because I have been among the thousands who have not reported the occasions on which we have caught flu. Health agencies can only report the numbers they have been made aware of, or have estimated, and that will always be the case. That doesn't make their data / reports any less valuable.
- How can there be a readability issue, when all but the latest raw data is hidden?
- The table of raw data is not just raw data. Every line of that table has been individually captured, verified, credited, and qualified, and what has resulted is a coming together of information which, as far as I am aware, is and will be of unique value to much of the wiki readership. This epidemic will be studied by thousands of academics and non-academics alike in times to come, and the robust manner in which the data has been collected and preserved on the wiki will prove an invaluable starting point for many of those students. I know of no other source on the internet which collates so much information on this topic in one place, and I think it would be a great loss to see a significant part of that information removed. Kirbett (talk) 21:33, 29 October 2014 (UTC)
- @Kirbett: Per WP:CALC:
- The problem here is not that the data isn't real; the problem is that the calculations are meaningless because the data is known to be inaccurate, and WHO itself has noted repeatedly that the actual case count may be three times as high. WHO has repeatedly noted that some countries have struggled to provide numbers - they specifically called out Liberia on more than one occasion because its medical infrastructure (and government) is on the verge of collapse, and therefore they are unable to really provide the data in question because they lack the resources to collect and track said data.
- The problem with graphing the data is that it implies that these are real changes, when in reality the 2000 case jump in Liberia was not due to Liberia actually having 2000 new cases in that interval, but because of a change in data sourcing - Liberia had failed to update its numbers at all on the previous update, for instance, but the idea that there were 0 new cases in Liberia was just absurd on the face of it.
- That's why the daily growth % was removed; the data does not reflect the daily growth of the disease at all, but the reporting. If someone got sick in some random village, and it was only reported a week later when they died, then the numbers would increase on the latest report even though they got sick with Ebola seven days earlier. Titanium Dragon (talk) 22:31, 29 October 2014 (UTC)
- But the calculations are not meaningless, because they correctly reflect the flaws in the raw data, and, in fact, the charts make those flaws far more visible (and demonstrably thought-provoking) than if the data was only available via the tables. Neither are the flaws in the data meaningless, quite the opposite in fact - you, me, and the WHO all agree on the meaning of those flaws - they represent failings primarily in the Liberian record keeping, a point that is certainly noteworthy. WP:NPOV very much applies here, and I think it's in the spirit of the wiki that, rather than removing any of the material, the effort should be directed at ensuring those flaws are adequately highlighted and explained (and the charts appropriately labelled). After all, the explanation of these flaws is verifiable - SitRep 8Oct2014 et al. Kirbett (talk) 00:43, 30 October 2014 (UTC)
- I second and I am Strongly For keeping the "raw data table". Yes it has all its problems and they are well documented. But it is a fact this is what the best available reports are or were at the time. If WHO/CDC or local authority wishes to restate past data to give a better view of the progression I would welcome that ... but until they do we need to stick with what we have. Nowhere else do you see this data online that I have been able to find and I for one find it very useful.Greenbe (talk) 21:54, 29 October 2014 (UTC)
- That's a straw man argument. Nobody is claiming the raw data from the table should be removed. --rtc (talk) 11:31, 30 October 2014 (UTC)
- What about my argument is a "straw man?" I am reacting specifically to " Wikipedia is not a respository for raw data" ... "but it just doesn't belong in the article as it's not encyclopedic.ZeLonewolf (talk) 19:20, 29 October 2014 (UTC)" ZeLonewolf please clarify if you are calling for the raw data table to be removed. In any event, I am strongly for keeping it and I would like others who agree to chime in.Greenbe (talk) 15:48, 30 October 2014 (UTC)
- That's a straw man argument. Nobody is claiming the raw data from the table should be removed. --rtc (talk) 11:31, 30 October 2014 (UTC)
- I second and I am Strongly For keeping the "raw data table". Yes it has all its problems and they are well documented. But it is a fact this is what the best available reports are or were at the time. If WHO/CDC or local authority wishes to restate past data to give a better view of the progression I would welcome that ... but until they do we need to stick with what we have. Nowhere else do you see this data online that I have been able to find and I for one find it very useful.Greenbe (talk) 21:54, 29 October 2014 (UTC)
At least, we could get rid of the last row of graphs (with the percentage of the population affected). These graphs are more or less useless. First of all, we don't have any data on whether the victims belong to a certain population. What if the US sends 1000 soldiers to Liberia and all of them get sick? Liberia will report 1000 new cases, but they certainly do not belong to the population of Liberia. Secondly, even if we disregard that issue, why do we need a graph to show that? Why not just write one sentence and say: "At the end of the epidemic, five percent of the Liberian population ...". I don't see the added value of having a graph for this purpose. -- 75.155.52.78 (talk) 03:32, 30 October 2014 (UTC)
- Your point of view. Useless to you doesn't mean useless to everybody else. When I saw the numbers, I, like the chart creator and many others, I suspect, tried to put them in context, asking do the difference in the numbers just reflect different population sizes, or is the disease, as reported, actually penetrating deeper into the different populations? Initially, I answered that question myself by cross-referencing to the population stats elsewhere on the wiki. The charts answer those specific questions. And even though the Liberian numbers were/are being under-reported, the charts still suggest a much deeper penetration of the epidemic into Liberia than into the other countries. Of particular interest, is the way in which the Liberian penetration figures have overtaken the Guinea and, to a lesser extent, the Sierra Leone ones. It's not for the wiki to speculate on the why, but I suspect the figures will inspire more than a few dissertations from present and future epidemiologists. And it's too early to write a sentence starting "At the end of the epidemic ...." Kirbett (talk) 12:00, 30 October 2014 (UTC)
I think the dates in the charts should be in ISO 8601 format rather than in the DD.MM.YY format used in Germany, Russia, etc. — Preceding unsigned comment added by 151.190.40.1 (talk) 15:18, 30 October 2014 (UTC)
latest WHO numbers
http://www.who.int/csr/disease/ebola/en/ Situation report - 29 October 2014--Ozzie10aaaa (talk) 23:16, 29 October 2014 (UTC)
Table in infobox?
Would it look better to make the case by country counts in the infobox in a summary table? I tried to do it to see how it would look but I couldn't figure out the formats. e.g.:
| Country | Cases | Deaths |
|---|---|---|
| 6,535 | 2,413 | |
| 5,235 | 1,600 | |
| 1,906 | 997 | |
| 20 | 8 | |
| 4 | 1 | |
| 1 | 1 | |
| 1 | 0 | |
| 1 | 0 | |
| Total | 13,703 | 4,922 |
ZeLonewolf (talk) 02:26, 30 October 2014 (UTC)
- "Reported cases"/"Reported deaths" to emphaisze the uncertainlty. Robertpedley (talk) 19:36, 30 October 2014 (UTC)
World Map is inconsistent
I feel that the world map is presenting data in a misleading way: national and subnational levels are mixed up. While it seems that you want to relate to the geographical distribution in the US by coloring on subnational level, all the other countries are coloured on national levels. So it looks like Svalbard is affected (which is wrong) while Alaska is not affected (which is right). Coloring Mali and Senegal as countries makes the whole of Westafrika look affected (an area, which is bigger than the three core countries together), while in fact there is only a single case in the very western corner in Mali and one single case in the capital of Senegal. I propose to stick to national levels only for all countries (including the US) to show which country is affected. If you want to show a geographical distribution, it is more appropiate to colour all countries at subnational Level. If you are only interested in the US, it might be more appropriate to create a seperate map for the US only in a section covering the US only. Semiliki (talk) 09:40, 30 October 2014 (UTC)
- No. Jimmy Wales added a good reason why it should stay the way it is, too. Also, when I generated the map, I was asked to do state level instead of national level for the US. AmericanXplorer13 (talk) 15:31, 30 October 2014 (UTC)
RfC: Should the charts derived from WHO's reported case/death statistics be removed?
|
Should the charts derived from WHO's reported case/death statistics be removed, on the basis that they are misleading, given that WHO's statistics, in particular for Liberia, are incomplete? -- Kirbett (talk) 13:48, 30 October 2014 (UTC)
There is discussion on this topic in these sections ...
- Talk:Ebola_virus_epidemic_in_West_Africa#Latest_Liberian_Numbers
- Talk:Ebola_virus_epidemic_in_West_Africa#Graphs_need_updating
with some additional background here,
Per the RfC rules, I'll also post on WP:RSN and WP:ORN.
Please keep in mind the question in the RfC summary. The question I am seeking resolution of is whether any charts should be included, even with a proliferation of disclaimers, given that some consider them to be useless, meaningless, or misleading (not my words) being based on unreliable / incomplete data from WHO. If it is resolved that this is not a bar to their inclusion, then I am happy to participate in discussions about which particular charts should be included. -- Kirbett (talk) 22:38, 30 October 2014 (UTC)
- Remove - I think most of them are not WP:OR, as I am seeing various sources that graph the data in more or less the same way, so for those graphs which plot data that have been plotted together in reliable sources, I don't think there's a WP:SYNTH violation. That said, it's pretty bad style to just have a big chunk of graphs in the middle of an article like that. Graphs are best used judiciously to illustrate various points. You definitely shouldn't just have a bunch of random graphs strewn together on top of a huge (and I must say, unnecessarily detailed) data set - half of these graphs even have redundant information on them, showing the linear and then the log plot next to one another. Show one or the other, not both. I have no problem if they are integrated into the article inline where they are relevant. Also, all the graphs are PNGs; if they're to be kept, they should be replaced with vectorized (SVG) versions. 0x0077BE [talk/contrib] 14:37, 30 October 2014 (UTC)
- Remove Most - I agree it's bad style to have all those charts just plopped in the article like that. The cases/per day graph is certainly WP:OR. I say keep at most one graph to show disease progression. I can live with a weekly or monthly histogram or line graph to give a reasonable display of the WHO data. ZeLonewolf (talk) 15:15, 30 October 2014 (UTC)
- Producing a weekly or monthly histogram would require interpolation, possibly incurring WP:OR. A variable bin-width histogram, derived directly from the data, would only require Basic arithmetic as per WP:CALC, but would essentially have the same shape as the cases/per day graph you consider to be WP:OR... -- Kirbett (talk) 15:52, 30 October 2014 (UTC)
- Remove I agree, 1 graph that shows the disease progression is enough--Ozzie10aaaa (talk) 15:29, 30 October 2014 (UTC)
- Keep Most Keep them all except remove the last two country population graphs those don't seem to add much info (since Ebola has a history of sub-region concentration) and they clutter the presentation. I am also for format improvements and other suggestions. I am generally not a fan of wholesale deletion a lot of work went into these graphs. I generally prefer replacement and improvement unless the info is well covered in another WP page. IMO Greenbe (talk) 16:02, 30 October 2014 (UTC)
- I don't know how much work went into these graphs, and it's more or less irrelevant, since the author didn't bother to make them SVGs, so they all need to be replaced by vectorized versions eventually anyway (and thus will all be "deleted", or at the very least taken out of the article and replaced with similar ones). That said, did you notice that two of the graphs are the exact same data, plotted twice, once with a linear axis and once with a logarithmic axis? Do you suggest keeping all four of those graphs? 0x0077BE [talk/contrib] 18:31, 30 October 2014 (UTC)
- Keep tables of data with out these graphs are mostly useless. If graphs were removed and someone wanted to make sense of data they would have to do the same graphs themselves. If graphs are considered misleading then so is the data table they are based on. Data quality problems have been stated clearly enough, but its the best availabe so it has to do. — Preceding unsigned comment added by 89.235.242.231 (talk) 16:08, 30 October 2014 (UTC)
- Keep - WHO is an WP:RS and using numbers from them is fine per WP:CALC. Make footnotes or something about incompleteness if and only if the WHO says they are incomplete. EvergreenFir (talk) Please {{re}} 17:35, 30 October 2014 (UTC)
- WHO is a primary source. Synthesizing data from datasets in primary sources is a form of original research. It's also very, very easy to make misleading graphs from raw numbers. Choice of axis position, choice of graph type, deciding whether to use logarithmic or linear axes - all of these can be used to create different stories using the same exact data, so making a graph is not really a straightforward calculation as required by WP:CALC. 0x0077BE [talk/contrib] 1:11 pm, Today (UTC−5)
- Many articles use WP:CALC to present UN and WHO data. This is nothing new or exceptional. Frankly the graphs should be restricted to the most simple versions using linear scaling and straight counts (no log odds or anything wonky). Currently there are too many graphs, but there's nothing wrong with their source or creation. EvergreenFir (talk) Please {{re}} 18:33, 30 October 2014 (UTC)
- I agree that WP:CALC can be used to justify the creation of graphs, so long as the graphs created are presenting either a standard way of representing the data in the field, or that there's a reliable, secondary source showing data presented in essentially the same way. Logarithmic axes, choice of offsets, choice of chart are all standard ways to present data, so there's no way to say, a priori what is "funky" and what's not. Presenting inherently logarithmic data on a linear axis is just as bad as presenting linear data on a logarithmic axis. Choice of axis scaling isn't identifiably "funky" but can completely change how data are perceived. Consider:
- Many articles use WP:CALC to present UN and WHO data. This is nothing new or exceptional. Frankly the graphs should be restricted to the most simple versions using linear scaling and straight counts (no log odds or anything wonky). Currently there are too many graphs, but there's nothing wrong with their source or creation. EvergreenFir (talk) Please {{re}} 18:33, 30 October 2014 (UTC)
- WHO is a primary source. Synthesizing data from datasets in primary sources is a form of original research. It's also very, very easy to make misleading graphs from raw numbers. Choice of axis position, choice of graph type, deciding whether to use logarithmic or linear axes - all of these can be used to create different stories using the same exact data, so making a graph is not really a straightforward calculation as required by WP:CALC. 0x0077BE [talk/contrib] 1:11 pm, Today (UTC−5)


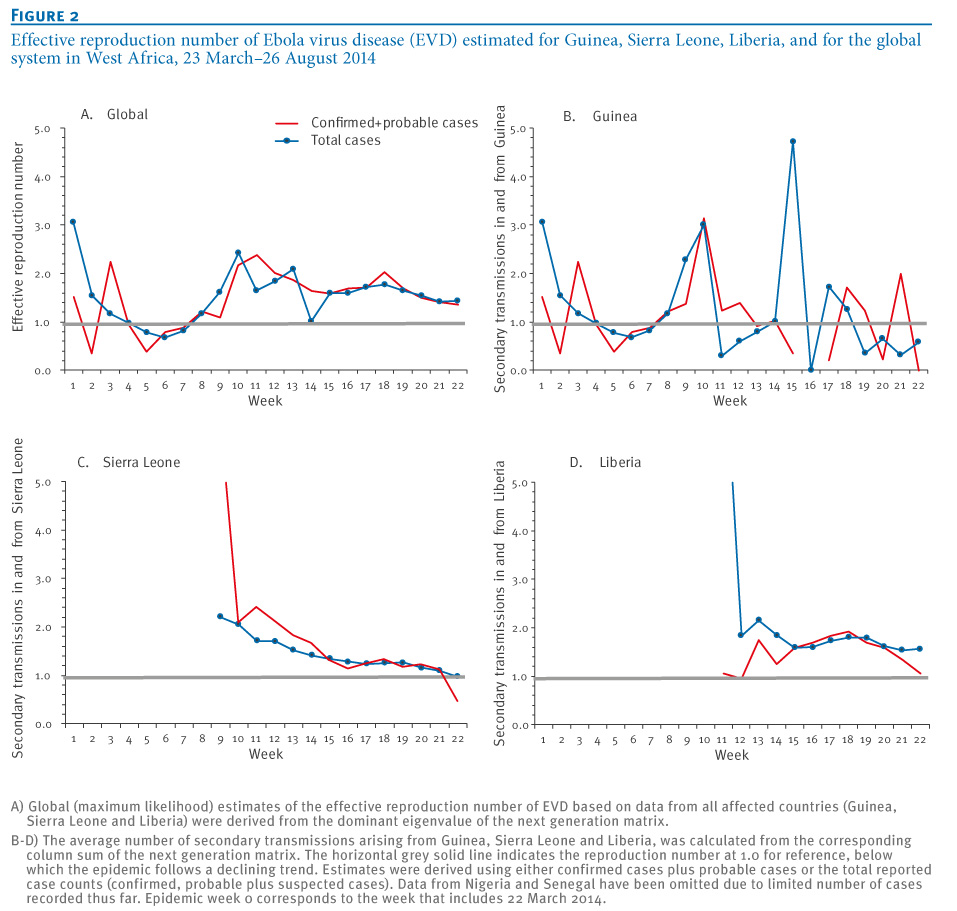
- I represented the same data with three different choices of axes. The first one looks very dramatic, but the second one looks like it has a lot of wasted space. The third one has less wasted space and looks less dramatic, but I could essentially choose to make the slope of the line look like whatever I want it to if I am arbitrarily choosing the axis limits. The point is that without a "industry standard" ways of representing data, there's a lot of mundane choices that don't seem like a big deal that you must make that are not straightforward, which is why graphs can be tricky territory. I'm thinking that what we should do is remove most of the graphs and the data and replace it with text, then illustrate the text with graphs made in the same general style as those presented in reliable secondary sources with the same (or equivalent) data sets or otherwise analogous to industry standard representations. 0x0077BE [talk/contrib] 18:52, 30 October 2014 (UTC)
- The point you're making is mentioned also in Wikipedia:Don't draw misleading graphs#Incorrect_origin_of_the_Y-axis. In this article, though, I don't think any of the graphs have that problem, all having their origin at the appropriate Y=0. -- Kirbett (talk) 20:56, 30 October 2014 (UTC)
- I represented the same data with three different choices of axes. The first one looks very dramatic, but the second one looks like it has a lot of wasted space. The third one has less wasted space and looks less dramatic, but I could essentially choose to make the slope of the line look like whatever I want it to if I am arbitrarily choosing the axis limits. The point is that without a "industry standard" ways of representing data, there's a lot of mundane choices that don't seem like a big deal that you must make that are not straightforward, which is why graphs can be tricky territory. I'm thinking that what we should do is remove most of the graphs and the data and replace it with text, then illustrate the text with graphs made in the same general style as those presented in reliable secondary sources with the same (or equivalent) data sets or otherwise analogous to industry standard representations. 0x0077BE [talk/contrib] 18:52, 30 October 2014 (UTC)
Although the first three comments on this RfC indicate Remove, none of them seem to be against retention of at least one or more of the graphs. Could I ask you to clarify your views please on whether you think the unreliability / incompleteness of the WHO data should disqualify the use of charts in this context? -- Kirbett (talk) 17:03, 30 October 2014 (UTC)
- If reliable, secondary sources are making charts that are not dissimilar to those that are up there, I don't think there's an OR / reliability problem. I highly doubt anyone's showing the linear plot and the log plot, so it may be impermissible WP:SYNTH to be showing whichever one people aren't using (since showing a logarithmic plot of something that is generally displayed on a linear axis can be very misleading, as can the opposite). That said, whether or not they are reliable, a pile of unexplained charts and data is unencyclopedic, so whether we want to remove them because they are bad charts or whether they don't belong there, I don't know that it matters. 0x0077BE [talk/contrib] 17:53, 30 October 2014 (UTC)
- Keep - As stated in the referenced discussions above, I consider it unrealistic to expect the general reader to be able to gauge the epidemiology of the disease just by reference to the tables (even an experienced epidemiologist would find that hard to do). The flaws in the data, reflected in the charts, are themselves noteworthy, being consequences of the disease itself. The charts should be retained, with sufficient explanations, qualifications and disclaimers to aid their comprehension. -- Kirbett (talk) 17:37, 30 October 2014 (UTC)
- KEEP - Graphs make it easier to assimulate the date. I added a graph showing daily compounded growth rate which was removed. I am not adding it back unless the consensus here is to do so as I don't exactly know what the social norm is on wikipedia. However, it is definitely not original research, but WP:CALC. How can we possible understand the progression of the epidemic unless we see how it is progressing. Absolute numbers tell us less than the change in those numbers. I will wait and see how this discussion evolves before I undo the removal. Weanhall (talk) 18:17, 30 October 2014 (UTC)
- First off, there are several reasons I removed your graph, but honestly we're having an RfC on this very topic, so you should probably wait until that's been decided before exacerbating the situation. Second, if you're making charts, make them SVGs. Third, just because something involves a calculation does not mean it's acceptable. I could produce hundreds of different charts showing various differences, derivatives, polynomial fits, etc, and tell my own story about what's happening. That's clear original research. If it's true that the only way to see how this is progressing is to see a chart of the time derivative of the growth, then you should be able to find some reliable secondary sources indicating that, as this is an incredibly well-covered story. Fourth, while graphs are useful, they are not a replacement for text. A huge unmanagable table and a gallery of various graphs with no explanatory text is simply not acceptable encyclopedic style. Graphs should be used to illustrate a point, they are not sufficient for making the entire point. 0x0077BE [talk/contrib] 18:24, 30 October 2014 (UTC)
- Keep - As stated in discussions above (with references provided), many sources either copy graphs directly from WHO reports or make their own based on the WHO data. The graphs are included in those articles (BBC, Telegraph, Guardian, NPR, etc.) because they're helpful for understanding. Even the graph that looks most like OR / noise conveys useful information about the WHO data. So the graphs should stay... maybe not all of them. And maybe a longer description for each is needed. Snd0 (talk) 18:36, 30 October 2014 (UTC)
- Keep I'm not sure how helpful the opinion of a non-involved editor may be but I felt my opinion could be somewhat useful. I come to this article on a regular basis out of interest for the topic, so my thoughts won't be skewed due to the amount of time I have invested in the project. The RfC asks whether the charts should be removed from the page, to answer concisely - absolutely not. Some of them are informative and do help the general reader make sense of the large table of information, but I think that the graph part of the page is congested. Is it necessary to have a log-scale and linear-scale graphs based on the same data? No. To simplify, it might be easier if their was just three or maybe four: 1: cumulative linear scale chart, 2: cases vs. deaths linear scale, 3: reported weekly cases and possibly 4: average cases vs deaths. Keep up the work though people, this article is a prime example of why I love spending time here XyZAn (talk) 18:48, 30 October 2014 (UTC)
- Keep All statistics are subject to uncertainty and error. WHO is the definitive agency tackling this outbreak, their stats are likely more reliable than other sources. Robertpedley (talk) 19:22, 30 October 2014 (UTC)
- Keep.. just a few of them.. drop the linear, Weekly cases & population tables.. In general Infections spread at a logarithmic rate... log tables shows the trending of the infections, Upward swing showing the disease taking hold, and downward swing shows doctors taking hold.. Linear tables dont show this properly... Any table that has interpolated values could be considered OR.. Gremlinsa (talk) 19:30, 30 October 2014 (UTC)
- Remove charts, keep table (with disclaimer). "keep" voters seem not to be aware at all that the WHO itself is warning that its data is unreliable: That the numbers are off by a factor of two to three, and that major trends suggested by the data are most likely opposite to reality. Plotting the data and presenting it as if this were reality is misleading readers. Such plots make sense only to experts who know what they are doing. Presenting the plots with changed description or bold disclaimers is not a convincing idea either, because there is simply no valid use they could have for an ordinary reader. It would be the same as putting a bottle of acid with big warning on a buffet. Despite the big warning, it simply makes no sense to have such a bottle in such a context; at best, everyone will ignore it, but realistically, it will be mistaken for or misunderstood as a drink by the average absent-minded person -- if it weren't a drink, nobody would have put it there, right? Let's wait until the epidemic is over and reliable sources are available, containing professional post mortem analyses by trained experts who know about epidemics and stochastics and can make estimates for the real progression of cases and deaths. --rtc (talk) 21:37, 30 October 2014 (UTC)
- Yes the data is crappy. We all know the data is crappy. Totals are way off and any apparent trends should always be regarded as suspicious. However, that doesn't necessarily imply that simply hiding the data would be better. Hiding what little data we do have is still likely to make people less informed not more. Dragons flight (talk) 21:52, 30 October 2014 (UTC)
- We're not hiding the data. The data is in the table. If someone wants to plot it, he can do so for himself, well knowing he is on his own, and hopefully having read the disclaimers. However, if Wikipedia is officially presenting its own charts, that's something entirely different. People will assume these charts are there for a purpose, to nicely display the trends. They can only be misunderstood. Show 100 people those charts and then ask them what they saw. I can guarantee you, the majority will say "cases and deaths of the ebola epidemic", many will say "I don't know" and nobody will give the right answer "illusory trends caused by an increasing error term" I mean just look at the most recent Liberia data. The total number of deaths is actually decreasing. How can that be? 200+ Liberian Ebola victims rising from the dead? (SCNR) And that while the number of Liberian cases is surging like never before? The data is increasingly getting wild and nonsensical. --rtc (talk) 21:58, 30 October 2014 (UTC)
- Yes the data is crappy. We all know the data is crappy. Totals are way off and any apparent trends should always be regarded as suspicious. However, that doesn't necessarily imply that simply hiding the data would be better. Hiding what little data we do have is still likely to make people less informed not more. Dragons flight (talk) 21:52, 30 October 2014 (UTC)
Exponential data presents particular problems when attempting to illustrate it with a graph. A standard linear graph may not have the resolution to display significant fine detail at the start of the graph, and it can be difficult to differentiate significant slope changes towards the end of the graph. A standard log graph solves both of this problems, and has the advantage of making clear the exponentiality (or otherwise) of the data - a straight line indicates exact exponentiality. The problem with the standard log graph is that many less numerate readers may not be familiar with the construct. The more numerate reader (I wouldn't say expert) would probably prefer the log graph. Which audience should the wiki attempt to satisfy? Or should it attempt to satisfy both by providing both graphs as now? I think, perhaps, this particular point should be discussed in a separate talk section. -- Kirbett (talk) 20:56, 30 October 2014 (UTC)
- Keep two: I would keep File:West Africa Ebola 2014 5 cum case by country lin.png and File:West Africa Ebola 2014 6 cum case by country log.png. Yes, both log and linear, as I think both visualizations help convey different details. With respect to positioning, I'd probably move at least one of these two plots to the Epidemiology section of the text rather than leaving it at the end. The other plots currently at the end are either redundant to these two or are arguably OR. Dragons flight (talk) 21:43, 30 October 2014 (UTC)
- Maybe we're looking at it wrong. I thought about this some more...if the graphs showed the number of people sick at any given time, it would be a useful picture of the progress of the epidemic. But, it doesn't. It shows the cumulative number of cases/death. And frankly, the cumulative number at a given point in time just really isn't that meaningful to help understand the epidemic. So, I change my vote to Remove all ZeLonewolf (talk) 01:50, 31 October 2014 (UTC)
- Remove. I am more skilled than most in interpreting graphs yet I still find these to be worthless. Why? Because the raw data is worthless. WHO is relying on the governments of the affected countries to provide the raw data. Unfortunately those governments at present are not capable of providing accurate nor precise data. The last I checked both WHO and US CDC stated they actually "may" be as much as three times higher. Meaning that the actual multiplier could be different and in fact may not be a constant.
It used to be said that are three types of lies: lies; damn lies; and statistics. The data at the moment are so unreliable as to not be usable for any definitive purpose. If we must provide some information let's limit to the currently reported values.
And preferable semi-protect it so that people who can't, don't, won't or haven't read the talk page will leave it alone.Jaerik (talk) 04:56, 31 October 2014 (UTC)
- Former good article nominees
- B-Class Africa articles
- High-importance Africa articles
- B-Class Guinea articles
- High-importance Guinea articles
- WikiProject Guinea articles
- B-Class Liberia articles
- High-importance Liberia articles
- WikiProject Liberia articles
- B-Class Sierra Leone articles
- High-importance Sierra Leone articles
- WikiProject Sierra Leone articles
- WikiProject Africa articles
- B-Class medicine articles
- Mid-importance medicine articles
- All WikiProject Medicine articles
- B-Class virus articles
- Mid-importance virus articles
- WikiProject Viruses articles
- Wikipedia In the news articles
- Wikipedia requests for comment