
Ohio's 9th congressional district
| Ohio's 9th congressional district | |
|---|---|
 Ohio's 9th congressional district since January 3, 2013 | |
| Representative | |
| Distribution |
|
| Population (2016) | 706,201 |
| Median household income | $43,182[1] |
| Ethnicity |
|
| Cook PVI | D+14[2] |
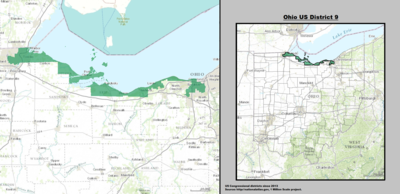
Ohio's 9th congressional district has been represented by Representative Marcy Kaptur (D) since 1983.
This district is in the northern part of the state, bordering Michigan and Ontario, Canada (via Lake Erie), and includes portions of Cuyahoga, Erie, Lorain, Lucas, and Ottawa counties. Due to redistricting by the Republican-controlled state legislature following the 2010 state elections, the 9th district absorbed part of western Cuyahoga County[3] pitting 10th district Democratic incumbent Dennis Kucinich against Kaptur in the 2012 Democratic primary.[4][5][6]
The two portions of the district are only connected via a bridge between Erie and Ottawa counties, as well as Crane Creek State Park. Some Ohio Democrats argued that when the beach floods, the reconfigured 9th is not contiguous.[7]
It was one of several districts challenged in a 2018 lawsuit seeking to overturn Ohio's congressional map as unconstitutional gerrymandering.[8]
List of largest municipalities
All or part of ten cities (whose population is greater than 5,000) are in the district.
The largest municipalities[9] represented in this district include:
- Toledo, population 313,619
- Lorain, population 64,097
- Lakewood, population 52,131
- Sandusky, population 27,844
- Avon Lake, population 22,816
- Oregon, population 19,355
- Sylvania, population 18,971
- Maumee, population 14,286
Election results from presidential races
| Year | Office | Result |
|---|---|---|
| 2000 | President | Al Gore 55% - George W. Bush 41% |
| 2004 | President | John Kerry 58% - George W. Bush 42% |
| 2008 | President | Barack Obama 66.8% - John McCain 31.6% |
| 2012 | President | Barack Obama 67.6% - Mitt Romney 30.9% |
| 2016 | President | Hillary Clinton 58.7% - Donald Trump 36.5% |
List of members representing the district

.jpg)


.JPG)


.jpg)


Election results
The following chart shows historic election results. Bold type indicates victor. Italic type indicates incumbent.
| Year | Democratic | Republican | Other |
|---|---|---|---|
| 1920 | Isaac R. Sherwood: 38,292 | Karl E. Pauli: 47 | |
| 1922 | William W. Chalmers (Incumbent): 42,712 | (none) | |
| 1924 | Isaac R. Sherwood (Incumbent): 48,482 | Millard Price (Prohibition): 2,159 John Kocinski: 747 | |
| 1926 | C. W. Davis: 23,947 | George F. Parrish (TRI): 1,110 Millard Price (Socialist): 1,018 | |
| 1928 | William P. Clarke: 50,601 | Charles V. Stephenson (Workers): 190 | |
| 1930 | Scott Stahl: 36,375 | (none) | |
| 1932 | Wilbur M. White (Incumbent): 54,078 | Silas E. Hurin: 4,200 Clyde E. Kiker: 2,135 Karl Pauli (Socialist): 1,314 Eugene Stoll (Communist): 620 | |
| 1934 | Frank L. Mulholland: 35,732 | Kenneth Eggert (Communist): 684 Karl Pauli (Socialist): 510 | |
| 1936 | Raymond E. Hildebrand: 55,043 | Earl O. Lehman: 3,739 | |
| 1938 | Homer A. Ramey: 55,441 | (none) | |
| 1940 | Wilbur M. White: 71,927 | (none) | |
| 1942 | John F. Hunter (Incumbent): 44,027 | (none) | |
| 1944 | John F. Hunter: 77,693 | (none) | |
| 1946 | Michael DiSalle: 59,057 | (none) | |
| 1948 | Homer A. Ramey (Incumbent): 73,394 | (none) | |
| 1950 | Thomas H. Burke (Incumbent): 45,268 | Homer A. Ramey: 43,301 | |
| 1952 | Thomas H. Burke: 61,047 | Gilmore Flues: 46,989 | |
| 1954 | Irving C. Reynolds: 39,933 | Frazier Reams (Independent, Incumbent): 44,656 | |
| 1956 | Harvey G. Straub: 81,562 | (none) | |
| 1958 | William K. Gernheuser: 63,660 | (none) | |
| 1960 | Howard C. Cook: 82,433 | (none) | |
| 1962 | Martin A. Janis: 64,279 | (none) | |
| 1964 | John O. Celusta: 64,401 | (none) | |
| 1966 | Jane M. Kuebbeler: 53,777 | (none) | |
| 1968 | Ben Marsh: 63,290 | (none) | |
| 1970 | Allen H. Shapiro: 33,947 | (none) | |
| 1972 | Joseph C. Richards: 49,388 | (none) | |
| 1974 | Carty Finkbeiner: 57,892 | (none) | |
| 1976 | Carty Finkbeiner: 73,919 | Edward S. Emery: 1,533 Lynn Galonsky: 1,477 | |
| 1978 | John C. Hoyt: 34,326 | Edward S. Emery: 2,563 Michael James Lewinski: 4,530 | |
| 1980 | Thomas L. Ashley (Incumbent): 68,728 | Edward S. Emery: 4,357 Toby Elizabeth Emmerich: 2,411 | |
| 1982 | Ed Weber (Incumbent): 64,459 | David Muir (Libertarian): 1,217 Susan A. Skinner: 1,785 James J. Somers: 1,594 | |
| 1984 | Frank Venner: 93,210 | Other: 3,714 | |
| 1986 | Mike Shufeldt: 30,643 | (none) | |
| 1988 | Al Hawkins: 36,183 | (none) | |
| 1990 | Jerry D. Lammers: 33,791 | (none) | |
| 1992 | Ken D. Brown: 53,011 | Edward Howard: 11,162 | |
| 1994 | R. Randy Whitman: 38,665 | (none) | |
| 1996 | R. Randy Whitman: 46,040 | Elizabeth A. Slotnick (Natural Law): 4,677 | |
| 1998 | Edward S. Emery: 30,312 | (none) | |
| 2000 | Dwight E. Bryan: 49,446 | Galen Fries (Libertarian): 4,239 Dennis Slotnick (Natural Law): 3,096 | |
| 2002 | Edward S. Emery: 46,481 | (none) | |
| 2004 | Larry A. Kaczala: 93,930 | (none) | |
| 2006 | Brad Leavitt: 55,119 | (none) | |
| 2008 | Brad Leavitt: 73,610 | (none) | |
| 2010 | Rich Iott: 83,423 | (none) | |
| 2012 | Joe Wurzelbacher: 68,666 | Sean Stipe (Libertarian): 11,725 | |
| 2014[10] | Richard May: 50,792 | Cory Hoffman, George A. Skalsky (Both Write-in): 0 |
Accusations of gerrymandering
The current district lines were drawn in 2011, following the redistricting based on the 2000 census.[9] The boundaries of the 9th district have been cited as a signature example of the partisan gerrymandering of the Ohio redistricting.[8] In 2011, Roll Call criticized it as a product of gerrymandering, naming it one of the United States' "Top 5 Ugliest Districts".[7]
Historical district boundaries

See also
References
- ^ https://www.census.gov/mycd/?st=39&cd=09
- ^ "Partisan Voting Index – Districts of the 115th Congress" (PDF). The Cook Political Report. April 7, 2017. Retrieved April 7, 2017.
- ^ "Ohio's 9th congressional district elections, 2012". Ballotpedia. Retrieved February 12, 2012.
- ^ Alex M. Parker (February 9, 2012). "Friendly Fire Coming in House Re-Elections?". U.S. News and World Report.
- ^ Andrea Billups (February 6, 2012). "Kaptur, Kucinich face off in Ohio". The Washington Times.
- ^ Kevin Milliken (January 16, 2012). "Kaptur, Kucinich square off for one congressional seat". La Prensa.
- ^ a b Shira Toeplitz (November 10, 2011). "Top 5 Ugliest Districts: Partisan Gerrymandering 101". Roll Call.
- ^ a b Todd Ruger, "Voters Challenge Ohio Congressional Map as Partisan Gerrymander", Roll Call, May 23, 2018. Retrieved 7 August 2018.
- ^ a b "U.S. Census Bureau, Census 2000" (PDF). Archived from the original (PDF) on 2012-05-06. Retrieved 2009-12-03.
- ^ http://www.sos.state.oh.us/SOS/elections/Research/electResultsMain/2014Results.aspx
- Martis, Kenneth C. (1989). The Historical Atlas of Political Parties in the United States Congress. New York: Macmillan Publishing Company.
{{cite book}}: Cite has empty unknown parameter:|coauthors=(help) - Martis, Kenneth C. (1982). The Historical Atlas of United States Congressional Districts. New York: Macmillan Publishing Company.
{{cite book}}: Cite has empty unknown parameter:|coauthors=(help) - Congressional Biographical Directory of the United States 1774–present