
Madison County, Illinois
Madison County | |
|---|---|
 Madison County Courthouse, Edwardsville | |
 Location within the U.S. state of Illinois | |
 Illinois's location within the U.S. | |
| Coordinates: 38°50′N 89°55′W / 38.83°N 89.91°W | |
| Country | |
| State | |
| Founded | September 14, 1812 |
| Named for | James Madison |
| Seat | Edwardsville |
| Largest city | Granite City |
| Area | |
| • Total | 741 sq mi (1,920 km2) |
| • Land | 716 sq mi (1,850 km2) |
| • Water | 25 sq mi (60 km2) 3.4% |
| Population | |
| • Estimate (2015) | 266,209 |
| • Density | 376/sq mi (145/km2) |
| Time zone | UTC−6 (Central) |
| • Summer (DST) | UTC−5 (CDT) |
| Congressional districts | 12th, 13th, 15th |
| Website | www |
Madison County is a county in the U.S. state of Illinois. According to the 2010 census, it had a population of 269,282.[1] The county seat is Edwardsville,[2] and its largest city is Granite City.
Madison County is part of the Metro-East region of the St. Louis, MO-IL Metropolitan Statistical Area. The pre-Columbian city of Cahokia Mounds a World Heritage Site was located near Collinsville. Edwardsville is home to Southern Illinois University Edwardsville. To the north, Alton is known for its abolitionist and American Civil War-era history. It is also the home of Southern Illinois University Dental School. Godfrey, the village named for Captain Benjamin Godfrey, offers Lewis and Clark Community College formerly the Monticello Female Seminary.
History
Madison County was established on September 14, 1812. It was formed from parts of Randolph and St. Clair counties and named for President James Madison.[3] At the time of its formation, Madison County included all of the modern State of Illinois north of St. Louis, as well as all of Wisconsin, part of Minnesota, and Michigan's Upper Peninsula.
In the late 19th century, Madison County became an industrial region, and in the 20th century was known first for Graniteware, and later for its steel mills, oil refineries, and other heavy industries. The county had a large working population, and the county and surrounding area was a center of strength for the Democratic Party.
Industrial restructuring cost many jobs and reduced the population. The county now is part of semi-rural, sparsely populated east of the St. Louis metropolitan area (nicknamed "Metro East"), as is neighboring St. Clair County.
In 2009, the EPA issued an air pollution report that ranked Madison County as the county with the second-highest cancer risk in the country due to air pollution, second only to Los Angeles County, California.
-
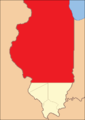 Madison County between its creation in 1812 and 1815, extending north to Lake Superior and the border with Rupert's Land
 -
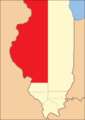 Madison County between 1815 and 1817
 -
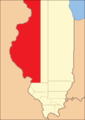 Madison County between 1817 and 1821
 -
 Madison County between 1821 and 1825
 -
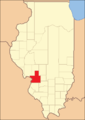 Between 1825 and 1829, Madison included a northern salient that was split off to form part of Macoupin County.
 -
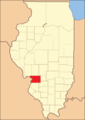 In 1829, Madison returned to its 1821 borders.
 -
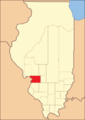
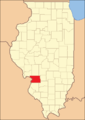 In 1843, a small amount of land was transferred to Bond County, reducing Madison to its current size.


Geography
According to the U.S. Census Bureau, the county has a total area of 741 square miles (1,920 km2), of which 716 square miles (1,850 km2) is land and 25 square miles (65 km2) (3.4%) is water.[4] Madison County is on the Mississippi River, while the other major body of water is Horseshoe Lake.
Climate and weather
| Edwardsville, Illinois | ||||||||||||||||||||||||||||||||||||||||||||||||||||||||||||
|---|---|---|---|---|---|---|---|---|---|---|---|---|---|---|---|---|---|---|---|---|---|---|---|---|---|---|---|---|---|---|---|---|---|---|---|---|---|---|---|---|---|---|---|---|---|---|---|---|---|---|---|---|---|---|---|---|---|---|---|---|
| Climate chart (explanation) | ||||||||||||||||||||||||||||||||||||||||||||||||||||||||||||
| ||||||||||||||||||||||||||||||||||||||||||||||||||||||||||||
| ||||||||||||||||||||||||||||||||||||||||||||||||||||||||||||
In recent years, average temperatures in the county seat of Edwardsville have ranged from a low of 19 °F (−7 °C) in January to a high of 90 °F (32 °C) in July, although a record low of −27 °F (−33 °C) was recorded in January 1977 and a record high of 114 °F (46 °C) was recorded in July 2012. Average monthly precipitation ranged from 1.99 inches (51 mm) in January to 4.24 inches (108 mm) in May.[5] Climate Zone 4A per the International Energy Conservation Code.
Adjacent counties and city
- Bond County - east
- Clinton County - southeast
- Jersey County - northwest
- Macoupin County - north
- Montgomery County - northeast
- St. Charles County, Missouri - northwest
- St. Clair County - south
- St. Louis, Missouri - west
- St. Louis County, Missouri - west
Transportation
Madison County Transit serves the county with 25 bus routes and 85 miles (137 km) of bike trails.
Major highways
Demographics
| Census | Pop. | Note | %± |
|---|---|---|---|
| 1820 | 13,550 | — | |
| 1830 | 6,221 | −54.1% | |
| 1840 | 14,433 | 132.0% | |
| 1850 | 20,441 | 41.6% | |
| 1860 | 31,251 | 52.9% | |
| 1870 | 44,131 | 41.2% | |
| 1880 | 50,126 | 13.6% | |
| 1890 | 51,535 | 2.8% | |
| 1900 | 64,694 | 25.5% | |
| 1910 | 89,847 | 38.9% | |
| 1920 | 106,895 | 19.0% | |
| 1930 | 143,830 | 34.6% | |
| 1940 | 149,349 | 3.8% | |
| 1950 | 182,307 | 22.1% | |
| 1960 | 224,689 | 23.2% | |
| 1970 | 250,934 | 11.7% | |
| 1980 | 247,691 | −1.3% | |
| 1990 | 249,238 | 0.6% | |
| 2000 | 258,941 | 3.9% | |
| 2010 | 269,282 | 4.0% | |
| 2017 (est.) | 265,428 | [6] | −1.4% |
| U.S. Decennial Census[7] 1790-1960[8] 1900-1990[9] 1990-2000[10] 2010-2013[1] | |||
As of the 2010 United States Census, there were 269,282 people, 108,094 households, and 71,756 families residing in the county.[11] The population density was 376.3 inhabitants per square mile (145.3/km2). There were 117,106 housing units at an average density of 163.7 per square mile (63.2/km2).[4] The racial makeup of the county was 88.2% white, 7.9% black or African American, 0.8% Asian, 0.2% American Indian, 0.9% from other races, and 1.8% from two or more races. Those of Hispanic or Latino origin made up 2.7% of the population.[11] In terms of ancestry, 32.7% were German, 14.9% were Irish, 10.5% were English, 7.5% were American, and 5.7% were Italian.[12]
Of the 108,094 households, 31.4% had children under the age of 18 living with them, 49.3% were married couples living together, 12.2% had a female householder with no husband present, 33.6% were non-families, and 26.8% of all households were made up of individuals. The average household size was 2.46 and the average family size was 2.98. The median age was 38.6 years.[11]
The median income for a household in the county was $51,941 and the median income for a family was $64,630. Males had a median income of $50,355 versus $35,543 for females. The per capita income for the county was $26,127. About 9.1% of families and 12.9% of the population were below the poverty line, including 19.3% of those under age 18 and 6.6% of those age 65 or over.[13]
Communities

Cities
- Alton
- Collinsville (partly in St. Clair County)
- Edwardsville
- East St. Louis (partly in St. Clair)
- Fairmont City
- Granite City
- Highland
- Madison
- Troy
- Venice
- Wood River
Villages
Census-designated places
Other unincorporated communities
Townships
Madison County is divided into twenty-four townships:
Politics
Like much of southern Illinois, Madison County was a predominantly Democratic area for much of its history, but in recent elections has been moving towards the Republicans. Mitt Romney narrowly carried the county in the 2012 presidential election, becoming the first Republican presidential nominee to do so since 1984. In 2016, Donald Trump carried the largest share of the vote for any presidential candidate since 1972. The county also supported the Republican candidates for governor in 2010 and 2014.
| Year | Republican | Democratic | Third parties |
|---|---|---|---|
| 2016 | 54.2% 70,490 | 38.9% 50,587 | 7.0% 9,102 |
| 2012 | 49.3% 60,608 | 48.0% 58,922 | 2.7% 3,355 |
| 2008 | 44.4% 57,177 | 53.6% 68,979 | 2.0% 2,534 |
| 2004 | 48.0% 59,384 | 51.3% 63,399 | 0.7% 895 |
| 2000 | 43.9% 48,821 | 53.2% 59,077 | 2.9% 3,206 |
| 1996 | 35.6% 35,758 | 53.3% 53,568 | 11.2% 11,247 |
| 1992 | 28.2% 32,167 | 51.3% 58,484 | 20.6% 23,444 |
| 1988 | 45.0% 44,907 | 54.3% 54,175 | 0.6% 613 |
| 1984 | 53.9% 57,021 | 45.7% 48,352 | 0.3% 340 |
| 1980 | 51.1% 51,160 | 43.8% 43,860 | 5.1% 5,104 |
| 1976 | 43.3% 44,183 | 55.4% 56,457 | 1.3% 1,358 |
| 1972 | 55.9% 55,385 | 43.7% 43,289 | 0.5% 442 |
| 1968 | 39.2% 39,622 | 45.9% 46,384 | 15.0% 15,123 |
| 1964 | 31.6% 30,009 | 68.5% 65,115 | |
| 1960 | 43.9% 42,984 | 56.0% 54,787 | 0.1% 133 |
| 1956 | 45.1% 39,413 | 54.8% 47,897 | 0.1% 88 |
| 1952 | 41.6% 36,206 | 58.3% 50,734 | 0.1% 99 |
| 1948 | 37.8% 25,059 | 61.7% 40,897 | 0.5% 350 |
| 1944 | 41.2% 28,399 | 58.2% 40,114 | 0.5% 359 |
| 1940 | 40.1% 30,445 | 59.0% 44,803 | 0.9% 681 |
| 1936 | 33.6% 22,073 | 64.2% 42,172 | 2.2% 1,441 |
| 1932 | 34.6% 19,774 | 61.5% 35,211 | 3.9% 2,253 |
| 1928 | 53.5% 28,028 | 45.1% 23,658 | 1.4% 720 |
| 1924 | 47.6% 19,926 | 30.7% 12,863 | 21.7% 9,062 |
| 1920 | 57.8% 19,249 | 30.5% 10,149 | 11.7% 3,894 |
| 1916 | 49.8% 17,594 | 46.2% 16,302 | 4.0% 1,421 |
| 1912 | 30.6% 5,462 | 40.0% 7,155 | 29.4% 5,251 |
| 1908 | 51.1% 9,463 | 42.2% 7,812 | 6.6% 1,228 |
| 1904 | 57.1% 9,009 | 34.4% 5,429 | 8.5% 1,333 |
| 1900 | 53.4% 8,106 | 44.5% 6,753 | 2.2% 331 |
| 1896 | 53.3% 7,431 | 45.5% 6,344 | 1.3% 177 |
| 1892 | 45.9% 5,355 | 48.7% 5,680 | 5.4% 634 |
See also
References
- ^ a b "State & County QuickFacts". United States Census Bureau. Archived from the original on July 14, 2011. Retrieved July 7, 2014.
{{cite web}}: Unknown parameter|deadurl=ignored (|url-status=suggested) (help) - ^ "Find a County". National Association of Counties. Archived from the original on 2011-05-31. Retrieved 2011-06-07.
{{cite web}}: Unknown parameter|deadurl=ignored (|url-status=suggested) (help) - ^ Adams, James N. (compiler) (1989), Keller, William E. (ed.), Illinois Place Names, Springfield: Illinois State Historical Society, p. 593, ISBN 0-912226-24-2
- ^ a b "Population, Housing Units, Area, and Density: 2010 - County". United States Census Bureau. Retrieved 2015-07-12.
- ^ a b "Monthly Averages for Edwardsville, Illinois". The Weather Channel. Archived from the original on 2012-10-23. Retrieved 2011-01-27.
{{cite web}}: Unknown parameter|deadurl=ignored (|url-status=suggested) (help) - ^ "Population and Housing Unit Estimates". Archived from the original on May 29, 2017. Retrieved June 9, 2017.
{{cite web}}: Unknown parameter|deadurl=ignored (|url-status=suggested) (help) - ^ "U.S. Decennial Census". United States Census Bureau. Archived from the original on May 12, 2015. Retrieved July 7, 2014.
{{cite web}}: Unknown parameter|deadurl=ignored (|url-status=suggested) (help) - ^ "Historical Census Browser". University of Virginia Library. Archived from the original on August 16, 2012. Retrieved July 7, 2014.
{{cite web}}: Unknown parameter|deadurl=ignored (|url-status=suggested) (help) - ^ "Population of Counties by Decennial Census: 1900 to 1990". United States Census Bureau. Archived from the original on April 24, 2014. Retrieved July 7, 2014.
{{cite web}}: Unknown parameter|deadurl=ignored (|url-status=suggested) (help) - ^ "Census 2000 PHC-T-4. Ranking Tables for Counties: 1990 and 2000" (PDF). United States Census Bureau. Archived from the original (PDF) on December 18, 2014. Retrieved July 7, 2014.
{{cite web}}: Unknown parameter|deadurl=ignored (|url-status=suggested) (help) - ^ a b c "DP-1 Profile of General Population and Housing Characteristics: 2010 Demographic Profile Data". United States Census Bureau. Retrieved 2015-07-12.
- ^ "DP02 SELECTED SOCIAL CHARACTERISTICS IN THE UNITED STATES – 2006-2010 American Community Survey 5-Year Estimates". United States Census Bureau. Retrieved 2015-07-12.
- ^ "DP03 SELECTED ECONOMIC CHARACTERISTICS – 2006-2010 American Community Survey 5-Year Estimates". United States Census Bureau. Retrieved 2015-07-12.
- ^ Leip, David. "Dave Leip's Atlas of U.S. Presidential Elections". uselectionatlas.org. Archived from the original on 23 March 2018. Retrieved 30 April 2018.
{{cite web}}: Unknown parameter|deadurl=ignored (|url-status=suggested) (help)
External links
- Madison County website
- A History of Madison County Illinois
- Madison Historical: The Online Encyclopedia and Digital Archive for Madison County, Illinois
Places adjacent to Madison County, Illinois | |
|---|---|
Municipalities and communities of Madison County, Illinois, United States | ||
|---|---|---|
| Cities |  | |
| Villages | ||
| Townships | ||
| CDPs | ||
| Other communities | ||
| Footnotes | ‡This populated place also has portions in an adjacent county or counties | |
| Topics |  | |
|---|---|---|
| Central city | ||
| Largest cities (over 50,000 in 2020) | ||
| Medium-sized cities (over 20,000 in 2020) | ||
| Largest towns and villages (over 10,000 in 2020) |
| |
| Missouri counties | ||
| Illinois counties | ||
| Subregions | ||
| Counties |  | |
|---|---|---|
| Major cities (25,000+) | ||
| Cities (5,000-25,000) | ||
| Communities (1,000-5,000) |
| |
| Transit systems | ||
| Amtrak stations |
| |
| Interstates | ||
| Airports | ||
| Colleges | ||
| Sports teams |
| |
| Counties |  | |
|---|---|---|
| Mid-sized cities (25,000+) | ||
| Small cities (10,000-25,000) | ||
| Small cities (5,000-10,000) | ||
| Transit systems | ||
| Amtrak stations | ||
| Interstates | ||
| Airports/military bases |
| |
| Universities | ||
| Colleges | ||
| Sports teams based in Southern Illinois | ||