Jump to content

Texas's 15th congressional district

Coordinates: 27°45′00″N 98°15′48″W / 27.75000°N 98.26333°W / 27.75000; -98.26333
From Wikipedia, the free encyclopedia

Texas's 15th congressional district
Texas's 15th congressional district - since January 3, 2023
Representative
Distribution
  • 86.67% urban[1]
  • 13.33% rural
Population (2023)799,844[2]
Median household
income
$59,068[3]
Ethnicity
Cook PVIR+1[4]

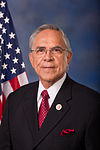
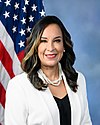
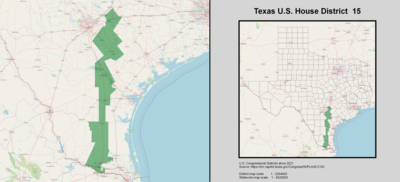
Texas's 15th congressional district of the United States House of Representatives includes a thin section of the far south of the state of Texas. The district's current Representative is Republican Monica De La Cruz. Elected in 2022, de la Cruz is the first Republican and woman to represent the district.

Currently, the 15th Congressional District composes of a narrow strip of land running from western Hidalgo County in the Rio Grande Valley northwards to eastern Guadalupe County, to the east of San Antonio. The district includes the entirety of Brooks, Jim Wells, Live Oak, Karnes, and Wilson counties between Hidalgo and Guadalupe counties.

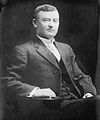
The district has generally given its congressmen very long tenures in Washington; only eight people, seven Democrats and one Republican, have ever represented it. The district's best-known Representative was John Nance Garner, who represented the district from its creation in 1903 until 1933, and was Speaker of the House from 1931 to 1933. He ran with Franklin D. Roosevelt in the 1932 and 1936 presidential campaigns, and was elected Vice President of the United States, serving from 1933 to 1941. The district was one of the first Latino-majority districts in the country, and has been represented by Latino congressmen since 1965.

Notably, this district narrowly voted more Republican in the House elections than the nation as a whole in 2020. Vincente Gonzalez won by 2.9 points while Democrats won the national vote by a combined 3.1 percentage points. It also voted more Republican than the national average while voting Democratic in the 2020 United States presidential election, and the difference between the national vote and the result was wider in the presidential election than the House. Due to redistricting, incumbent Gonzalez in the 2022 election ran in the 34th congressional district. The Republican nominee, former insurance agent Monica de la Cruz defeated the Democratic nominee, businesswoman Michelle Vallejo.

Election results from recent statewide races

[edit]

Results under current lines (since 2023)[5]

Year Office Result
2014 Senate Cornyn 53 - 47%
Governor Abbott 50 - 50%
2016 President Clinton 55 - 42%
2018 Senate O’Rourke 56 - 44%
Governor Valdez 50 - 49%
Lieutenant Governor Collier 54 - 44%
Attorney General Nelson 55 - 43%
2020 President Trump 51 - 48%
Senate Cornyn 51 - 46%
2022 Governor Abbott 52 - 46%
Lieutenant Governor Patrick 52 - 45%
Attorney General Paxton 51 - 47% [6]

List of members representing the district

[edit]
Member Party Years Cong
ress
Electoral history Counties
District established March 4, 1903

John N. Garner
(Uvalde)
Democratic March 4, 1903 –
March 3, 1933
58th
59th
60th
61st
62nd
63rd
64th
65th
66th
67th
68th
69th
70th
71st
72nd
Elected in 1902.
Re-elected in 1904.
Re-elected in 1906.
Re-elected in 1908.
Re-elected in 1910.
Re-elected in 1912.
Re-elected in 1914.
Re-elected in 1916.
Re-elected in 1918.
Re-elected in 1920.
Re-elected in 1922.
Re-elected in 1924.
Re-elected in 1926.
Re-elected in 1928.
Re-elected in 1930.
Re-elected in 1932.
Resigned to become Vice President of the United States.
1903–1911
[data missing]
1911–1919
[data missing]
1919–1935
[data missing]
Vacant March 4, 1933 –
April 23, 1933
73rd

Milton H. West
(Brownsville)
Democratic April 23, 1933 –
October 28, 1948
73rd
74th
75th
76th
77th
78th
79th
80th
Elected to finish Garner's term.
Re-elected in 1934.
Re-elected in 1936.
Re-elected in 1938.
Re-elected in 1940.
Re-elected in 1942.
Re-elected in 1944.
Re-elected in 1946.
Died.
1935–1959
[data missing]
Vacant October 28, 1948 –
December 4, 1948
80th

Lloyd Bentsen
(McAllen)
Democratic December 4, 1948 –
January 3, 1955
80th
81st
82nd
83rd
Elected to finish West's term.
Re-elected in 1948.
Re-elected in 1950.
Re-elected in 1952.
Retired.

Joe M. Kilgore
(McAllen)
Democratic January 3, 1955 –
January 3, 1965
84th
85th
86th
87th
88th
Elected in 1954.
Re-elected in 1956.
Re-elected in 1958.
Re-elected in 1960.
Re-elected in 1962.
Retired.
1959–1967
[data missing]

Kika de la Garza
(McAllen)
Democratic January 3, 1965 –
January 3, 1997
89th
90th
91st
92nd
93rd
94th
95th
96th
97th
98th
99th
100th
101st
102nd
103rd
104th
Elected in 1964.
Re-elected in 1966.
Re-elected in 1968.
Re-elected in 1970.
Re-elected in 1972.
Re-elected in 1974.
Re-elected in 1976.
Re-elected in 1978.
Re-elected in 1980.
Re-elected in 1982.
Re-elected in 1984.
Re-elected in 1986.
Re-elected in 1988.
Re-elected in 1990.
Re-elected in 1992.
Re-elected in 1994.
Retired.
1967–1969
[data missing]
1969–1973
[data missing]
1973–1975
[data missing]
1975–1983
[data missing]
1983–1985
[data missing]
1985–1993
[data missing]
1993–2003
Bee, Brooks, De Witt, Goliad, Hidalgo, Jim Wells, Karnes, Kleberg, Live Oak, San Patricio, and Willacy

Rubén Hinojosa
(Mercedes)
Democratic January 3, 1997 –
January 3, 2017
105th
106th
107th
108th
109th
110th
111th
112th
113th
114th
Elected in 1996.
Re-elected in 1998.
Re-elected in 2000.
Re-elected in 2002.
Re-elected in 2004.
Re-elected in 2006.
Re-elected in 2008.
Re-elected in 2010.
Re-elected in 2012.
Re-elected in 2014.
Retired.
2003–2005
Bee, Brooks, Goliad, Hidalgo, Kleberg, Live Oak, Nueces, and San Patricio
2005–2007

Bastrop, Bee, Brooks, Cameron, Colorado, De Witt, Fayette, Goliad, Hidalgo, Jim Wells, Lavaca, Refugio, and San Patricio
2007–2013

Bee, Brooks, Cameron, De Witt, Duval, Goliad, Hidalgo, Jim Wells, Karnes, Live Oak, Refugio, and San Patricio
2013–2023

Brooks, Duval, Guadalupe (part), Hidalgo (part), Jim Hogg, Karnes, Live Oak, and Wilson (part)[7]

Vicente Gonzalez
(McAllen)
Democratic January 3, 2017 –
January 3, 2023
115th
116th
117th
Elected in 2016.
Re-elected in 2018.
Re-elected in 2020.
Redistricted to the 34th district.

Monica De La Cruz
(Edinburg)
Republican January 3, 2023 –
present
118th Elected in 2022. 2023–present

Brooks, Guadalupe (part), Hidalgo (part), Jim Wells, Karnes, Live Oak, and Wilson[8]

Election results

[edit]

19201922192419261928193019321934193619381940194219441946194819501952195419561958196019621964196619681970197219741976197819801982198419861988199019921994199619982000200220042006 (Special)20082010201220142016201820202022

1920

[edit]
1920 United States House of Representatives elections[9]
Party Candidate Votes %
Democratic John N. Garner (incumbent) 10,265 100.00
Total votes 10,265 100.0
Turnout  
Democratic hold

1922

[edit]
1922 United States House of Representatives elections[10]
Party Candidate Votes %
Democratic John N. Garner (incumbent) 14,366 100.00
Total votes 14,366 100.0
Turnout  
Democratic hold

1924

[edit]
1924 United States House of Representatives elections[11]
Party Candidate Votes %
Democratic John N. Garner (incumbent) 22,776 100.00
Total votes 22,776 100.0
Turnout  
Democratic hold

1926

[edit]
1926 United States House of Representatives elections[12]
Party Candidate Votes %
Democratic John N. Garner (Incumbent) 13,548 82.75
Republican Hardie F. Jefferies 2,823 17.25
Total votes 16,371 100.0
Turnout  
Democratic hold

1928

[edit]
1928 United States House of Representatives elections[13]
Party Candidate Votes %
Democratic John N. Garner (Incumbent) 28,417 99.99
Independent J.L. Burd 1 0.003
Total votes 28,418 100.0
Turnout  
Democratic hold

1930

[edit]
1930 United States House of Representatives elections[14]
Party Candidate Votes %
Democratic John N. Garner (Incumbent) 20,733 77.50
Republican Carlos G. Watson 6,016 22.50
Total votes 26,749 100.0
Turnout  
Democratic hold

1932

[edit]
1932 United States House of Representatives elections[15]
Party Candidate Votes %
Democratic John N. Garner (Incumbent) 44,318 85.75
Republican Carlos G. Watson 7,362 14.25
Total votes 51,680 100.0
Turnout  
Democratic hold

1933 (Special)

[edit]
1933 Texas's 15th congressional district special election
Party Candidate Votes %
Democratic Milton H. West 13,546 91.20
Republican Carlos G. Watson 1,302 8.80
Total votes 14,848 100.0
Turnout  
Democratic hold

1934

[edit]
1934 United States House of Representatives elections[16]
Party Candidate Votes %
Democratic Milton H. West (Incumbent) 20,102 100.00
Total votes 20,102 100.0
Turnout  
Democratic hold

1936

[edit]
1936 United States House of Representatives elections[17]
Party Candidate Votes %
Democratic Milton H. West (Incumbent) 29,508 82.53
Independent J.A. Simpson 6,244 17.47
Total votes 35,752 100.0
Turnout  
Democratic hold

1938

[edit]
1938 United States House of Representatives elections[18]
Party Candidate Votes %
Democratic Milton H. West (Incumbent) 18,558 99.99
Other write-in votes Write-in votes 2 0.010
Total votes 18,560 100.0
Turnout  
Democratic hold

1940

[edit]
1940 United States House of Representatives elections[19]
Party Candidate Votes %
Democratic Milton H. West (Incumbent) 31,800 92.36
Republican J.A. Simpson 2,628 7.64
Total votes 34,428 100.0
Turnout  
Democratic hold

1942

[edit]
1942 United States House of Representatives elections[20]
Party Candidate Votes %
Democratic Milton H. West (Incumbent) 12,169 100.00
Total votes 12,169 100.0
Turnout  
Democratic hold

1944

[edit]
1944 United States House of Representatives elections[21]
Party Candidate Votes %
Democratic Milton H. West (Incumbent) 36,362 99.98
Other write-in votes Write-in votes 5 0.013
Total votes 36,367 100.0
Turnout  
Democratic hold

1946

[edit]
1946 United States House of Representatives elections[22]
Party Candidate Votes %
Democratic Milton H. West (Incumbent) 14,623 99.98
Other write-in votes Write-in votes 3 0.020
Total votes 14,626 100.0
Turnout  
Democratic hold

1948 (Special)

[edit]
1948 Texas's 15th congressional district special election
Party Candidate Votes %
Democratic Lloyd Bentsen 2,396 100.00
Other write-in votes Charles McNelly 1 0.00
Total votes 2,397 100.0
Turnout  
Democratic hold

1948

[edit]
1948 United States House of Representatives elections[23]
Party Candidate Votes %
Democratic Lloyd Bentsen (Incumbent) 27,402 100.00
Total votes 27,402 100.0
Turnout  
Democratic hold

1950

[edit]
1950 United States House of Representatives elections[24]
Party Candidate Votes %
Democratic Lloyd Bentsen (Incumbent) 18,524 100.00
Total votes 18,524 100.0
Turnout  
Democratic hold

1952

[edit]
1952 United States House of Representatives elections[25]
Party Candidate Votes %
Democratic Lloyd Bentsen (Incumbent) 63,767 100.00
Total votes 63,767 100.0
Turnout  
Democratic hold

1954

[edit]
1954 United States House of Representatives elections[26]
Party Candidate Votes %
Democratic Joe M. Kilgore 29,113 100.00
Total votes 29,113 100.0
Turnout  
Democratic hold

1956

[edit]
1956 United States House of Representatives elections[27]
Party Candidate Votes %
Democratic Joe M. Kilgore (Incumbent) 64,011 100.00
Total votes 64,011 100.0
Turnout  
Democratic hold

1958

[edit]
1958 United States House of Representatives elections[28]
Party Candidate Votes %
Democratic Joe M. Kilgore (Incumbent) 28,404 100.00
Total votes 28,404 100.0
Turnout  
Democratic hold

1960

[edit]
1960 United States House of Representatives elections[29]
Party Candidate Votes %
Democratic Joe M. Kilgore (Incumbent) 76,421 100.00
Total votes 76,421 100.0
Turnout  
Democratic hold

1962

[edit]
1962 United States House of Representatives elections[30]
Party Candidate Votes %
Democratic Joe M. Kilgore (Incumbent) 53,552 100.00
Total votes 53,552 100.0
Turnout  
Democratic hold

1964

[edit]
1964 United States House of Representatives elections[31]
Party Candidate Votes %
Democratic Kika de la Garza 66,897 69.36
Republican Joe B. Coulter 29,551 30.64
Total votes 96,448 100.0
Turnout  
Democratic hold

1966

[edit]
1966 United States House of Representatives elections[32]
Party Candidate Votes %
Democratic Kika de la Garza (Incumbent) 33,129 100.00
Total votes 33,129 100.0
Turnout  
Democratic hold

1968

[edit]
1968 United States House of Representatives elections[33]
Party Candidate Votes %
Democratic Kika de la Garza (Incumbent) 57,618 100.00
Total votes 57,618 100.0
Turnout  
Democratic hold

1970

[edit]
1970 United States House of Representatives elections[34]
Party Candidate Votes %
Democratic Kika de la Garza (Incumbent) 54,498 76.16
Republican Ben A. Martinez 17,049 23.82
Other write-in votes Write-in votes 1 0.02
Total votes 71,548 100.0
Turnout  
Democratic hold

1972

[edit]
1972 United States House of Representatives elections[35]
Party Candidate Votes %
Democratic Kika de la Garza (Incumbent) 73,994 100.00
Total votes 73,994 100.0
Turnout  
Democratic hold

1974

[edit]
1974 United States House of Representatives elections[36]
Party Candidate Votes %
Democratic Kika de la Garza (Incumbent) 42,567 100.00
Total votes 42,567 100.0
Turnout  
Democratic hold

1976

[edit]
1976 United States House of Representatives elections[37]
Party Candidate Votes %
Democratic Kika de la Garza (Incumbent) 102,837 74.36
Republican R.L. (Lendy) McDonald 35,446 25.64
Total votes 138,283 100.0
Turnout  
Democratic hold

1978

[edit]
1978 United States House of Representatives elections[38]
Party Candidate Votes %
Democratic Kika de la Garza (Incumbent) 54,560 66.20
Republican R.L. (Lendy) McDonald 27,853 33.80
Total votes 82,413 100.0
Turnout  
Democratic hold

1980

[edit]
1980 United States House of Representatives elections[39]
Party Candidate Votes %
Democratic Kika de la Garza (Incumbent) 105,325 70.02
Republican R.L. (Lendy) McDonald 45,090 29.98
Total votes 150,145 100.0
Turnout  
Democratic hold

1982

[edit]
1982 United States House of Representatives elections[40]
Party Candidate Votes %
Democratic Kika de la Garza (Incumbent) 76,544 95.67
Libertarian Frank L. Jones III 3,458 4.33
Total votes 80,002 100.0
Turnout  
Democratic hold

1984

[edit]
1984 United States House of Representatives elections[41]
Party Candidate Votes %
Democratic Kika de la Garza (Incumbent) 104,863 100.00
Total votes 104,863 100.0
Turnout  
Democratic hold

1986

[edit]
1986 United States House of Representatives elections[42]
Party Candidate Votes %
Democratic Kika de la Garza (Incumbent) 70,077 100.00
Total votes 70,077 100.0
Turnout  
Democratic hold

1988

[edit]
1988 United States House of Representatives elections[43]
Party Candidate Votes %
Democratic Kika de la Garza (Incumbent) 93,672 93.85
Libertarian Gloria Joyce Hendrix 6,133 6.15
Total votes 99,805 100.0
Turnout  
Democratic hold

1990

[edit]
1990 United States House of Representatives elections[44]
Party Candidate Votes %
Democratic Kika de la Garza (Incumbent) 72,461 100.00
Total votes 138,283 100.0
Turnout  
Democratic hold

1992

[edit]
1992 United States House of Representatives elections[45]
Party Candidate Votes %
Democratic Kika de la Garza (Incumbent) 86,351 60.42
Republican Tom Haughey 56,549 39.58
Total votes 142,900 100.0
Turnout  
Democratic hold

1994

[edit]
1994 United States House of Representatives elections[46]
Party Candidate Votes %
Democratic Kika de la Garza (Incumbent) 61,527 58.95
Republican Tom Haughey 41,119 39.39
Independent John c.c. Hamilton 1,720 1.64
Total votes 104,366 100.0
Turnout  
Democratic hold

1996

[edit]
1996 United States House of Representatives elections[47]
Party Candidate Votes %
Democratic Rubén Hinojosa 86,347 62.28
Republican Tom Haughey 50,914 36.72
Natural Law Rob Wofford 1,333 1.00
Total votes 138,621 100.0
Turnout  
Democratic hold

1998

[edit]
1998 United States House of Representatives elections[48]
Party Candidate Votes %
Democratic Rubén Hinojosa (Incumbent) 47,957 58.35
Republican Tom Haughey 34,221 41.65
Total votes 82,178 100.0
Turnout  
Democratic hold

2000

[edit]
2000 United States House of Representatives elections[49]
Party Candidate Votes %
Democratic Rubén Hinojosa (Incumbent) 106,570 88.47
Libertarian Frank Jones 13,167 10.93
Write-in Israel Cantu 711 0.60
Total votes 120,448 100.0
Turnout  
Democratic hold

2002

[edit]
2002 United States House of Representatives elections[50]
Party Candidate Votes %
Democratic Rubén Hinojosa (Incumbent) 66,311 100.0
Total votes 66,311 100.0
Turnout  
Democratic hold

2004

[edit]
2004 United States House of Representatives elections[51]
Party Candidate Votes %
Democratic Rubén Hinojosa (Incumbent) 96,089 57.76
Republican Michael D. Thamm 67,917 40.82
Libertarian William R. Cady 2,352 1.41
Total votes 166,358 100.0
Turnout  
Democratic hold

2006 (Special)

[edit]
2006 United States House of Representatives elections[52]
Party Candidate Votes %
Democratic Rubén Hinojosa (Incumbent) 43,236 61.77
Republican Paul B. Haring 16,601 23.72
Republican Eddie Zamora 10,150 14.51
Total votes 69,987 100.0
Turnout  
Democratic hold

2008

[edit]
2008 United States House of Representatives elections[53]
Party Candidate Votes %
Democratic Rubén Hinojosa (Incumbent) 107,578 67.28
Republican Eddie Zamora 52,303 32.72
Total votes 159,881 100.0
Turnout  
Democratic hold

2010

[edit]
2010 United States House of Representatives elections[54]
Party Candidate Votes %
Democratic Rubén Hinojosa (Incumbent) 53,546 55.73
Republican Eddie Zamora 39.964 41.59
Libertarian Aaron I. Cohn 2,570 2.68
Total votes 96,080 100.0
Turnout  
Democratic hold

2012

[edit]
2012 United States House of Representatives elections[55]
Party Candidate Votes %
Democratic Rubén Hinojosa (Incumbent) 89,296 60.88
Republican Dale Brueggemann 54,056 36.85
Libertarian Ron Finch 3,309 2.27
Total votes 146,661 100.0
Turnout  
Democratic hold

2014

[edit]
2014 United States House of Representatives elections[56]
Party Candidate Votes %
Democratic Rubén Hinojosa (Incumbent) 48,708 54.01
Republican Eddie Zamora 39,016 43.26
Libertarian Johnny Partain 2,460 2.73
Total votes 90,184 100.0
Turnout  
Democratic hold

2016

[edit]
2016 United States House of Representatives elections[57]
Party Candidate Votes %
Democratic Vicente Gonzalez 101,712 57.31
Republican Tim Westley 66,877 37.68
Green Vanessa S. Tijerina 5,448 3.07
Libertarian Ross Lynn Leone 3,442 1.94
Total votes 177,479 100.0
Democratic hold

2018

[edit]
2018 United States House of Representatives elections
Party Candidate Votes %
Democratic Vicente Gonzalez (incumbent) 98,333 59.07
Republican Tim Westley 63,862 38.07
Libertarian Anthony Cristo 2,607 1.06
Total votes 164,802 100.0
Democratic hold

2020

[edit]
2020 United States House of Representatives elections
Party Candidate Votes %
Democratic Vicente Gonzalez (incumbent) 115,605 50.05
Republican Monica De La Cruz 109,017 47.06
Libertarian Ross Lynn Leone 4,295 1.09
Total votes 228,917 100.0
Democratic hold

2022

[edit]
2022 United States House of Representatives elections
Party Candidate Votes %
Republican Monica De La Cruz 80,978 53.31
Democratic Michelle Vallejo 68,097 44.83
Libertarian Ross Leone 2,814 1.85
Total votes 151,889 100.0
Republican gain from Democratic

Historical district boundaries

[edit]
2007–2013
2013–2023

See also

[edit]

References

[edit]
Specific
  1. ^ "Congressional Districts Relationship Files (State-based)". U.S. Census Bureau. Archived from the original on April 2, 2013.
  2. ^ "My Congressional District".
  3. ^ "My Congressional District".
  4. ^ "2022 Cook PVI: District Map and List". Cook Political Report. July 12, 2022. Retrieved January 10, 2023.
  5. ^ "2022 Cook PVI: District Map and List". Cook Political Report. July 12, 2022. Retrieved January 23, 2023.
  6. ^ "TX 2022 Congressional". Dave’s Redistricting App. Retrieved July 15, 2023.
  7. ^ "District Population Analysis with County Subtotals | CONGRESSIONAL DISTRICTS - PLANC2100" (PDF). Capitol Data Portal. Texas Legislative Council. August 26, 2021. Archived (PDF) from the original on June 27, 2022. Retrieved January 1, 2023.
  8. ^ "District Population Analysis with County Subtotals | CONGRESSIONAL DISTRICTS - PLANC2193" (PDF). Capitol Data Portal. Texas Legislative Council. October 17, 2021. Archived (PDF) from the original on December 25, 2022. Retrieved January 1, 2023.
  9. ^ 1920 election results
  10. ^ 1922 election results
  11. ^ 1924 election results
  12. ^ 1926 election results
  13. ^ 1928 election results
  14. ^ 1930 election results
  15. ^ 1932 election results
  16. ^ 1934 election results
  17. ^ 1936 election results
  18. ^ 1938 election results
  19. ^ 1940 election results
  20. ^ 1942 election results
  21. ^ 1944 election results
  22. ^ 1946 election results
  23. ^ 1948 election results
  24. ^ 1950 election results
  25. ^ 1952 election results
  26. ^ 1954 election results
  27. ^ 1956 election results
  28. ^ 1958 election results
  29. ^ 1960 election results
  30. ^ 1962 election results
  31. ^ 1964 election results
  32. ^ 1966 election results
  33. ^ 1968 election results
  34. ^ 1970 election results
  35. ^ 1972 election results
  36. ^ 1974 election results
  37. ^ 1976 election results
  38. ^ 1978 election results
  39. ^ 1980 election results
  40. ^ 1982 election results
  41. ^ 1984 election results
  42. ^ 1986 election results
  43. ^ 1988 election results
  44. ^ 1990 election results
  45. ^ 1992 election results
  46. ^ 1994 election results
  47. ^ 1996 election results
  48. ^ 1998 election results
  49. ^ 2000 election results
  50. ^ 2002 election results
  51. ^ 2004 election results
  52. ^ 2006 election results
  53. ^ 2008 election results
  54. ^ 2010 election results
  55. ^ 2012 election results
  56. ^ 2014 election results
  57. ^ 2016 election results
General
U.S. House of Representatives
Preceded by Home district of the speaker of the U.S. House of Representatives
December 7, 1931 – March 4, 1933
Succeeded by

27°45′00″N 98°15′48″W / 27.75000°N 98.26333°W / 27.75000; -98.26333