
List of urban areas in the Republic of Ireland: Difference between revisions
Content deleted Content added
added up to 250 |
|||
| Line 3: | Line 3: | ||
This is a '''list of urban areas in the Republic of Ireland by population'''. In 2022, the [[Central Statistics Office (Ireland)|Central Statistics Office]] (CSO), the [[Department of Housing, Local Government and Heritage]] and [[Tailte Éireann]] created of a new unit of urban geography called Built Up Areas (BUAs) which were used to produce data for urban areas in the [[2022 census of Ireland]].<ref>{{cite web |title=Census 2022 Urban Boundaries and Built Up Areas |url=https://www.cso.ie/en/census/census2022/census2022urbanboundariesandbuiltupareas/ |website=[[Central Statistics Office (Ireland)|CSO]] |date=21 June 2023 |access-date=3 July 2023}}</ref> |
This is a '''list of urban areas in the Republic of Ireland by population'''. In 2022, the [[Central Statistics Office (Ireland)|Central Statistics Office]] (CSO), the [[Department of Housing, Local Government and Heritage]] and [[Tailte Éireann]] created of a new unit of urban geography called Built Up Areas (BUAs) which were used to produce data for urban areas in the [[2022 census of Ireland]].<ref>{{cite web |title=Census 2022 Urban Boundaries and Built Up Areas |url=https://www.cso.ie/en/census/census2022/census2022urbanboundariesandbuiltupareas/ |website=[[Central Statistics Office (Ireland)|CSO]] |date=21 June 2023 |access-date=3 July 2023}}</ref> |
||
There were 867 BUAs, representing the entire settlement area of each town and city (including [[suburb]]s and environs). The |
There were 867 BUAs, representing the entire settlement area of each town and city (including [[suburb]]s and environs). The 250 largest cities, towns and villages are listed below with data from the 2022 census.<ref name="F1015">{{cite web|url=https://data.cso.ie/table/F1015|title=Census 2022 Profile 1 - Population Distribution and Movements|publisher=[[Central Statistics Office (Ireland)|CSO]]}}</ref> |
||
==Cities and towns list== |
==Cities and towns list== |
||
| Line 225: | Line 225: | ||
|105|| style="text-align:center; color:#0c0;"| {{increase}} '''14'''||[[Newcastle, Dublin|Newcastle]]||[[County Dublin]]||align="right"|4,526||align="right"|46.3% |
|105|| style="text-align:center; color:#0c0;"| {{increase}} '''14'''||[[Newcastle, Dublin|Newcastle]]||[[County Dublin]]||align="right"|4,526||align="right"|46.3% |
||
|- |
|- |
||
|106|| style="text-align:center; color:#0c0;"| {{increase}} '''5'''||[[Courtown]]{{ |
|106|| style="text-align:center; color:#0c0;"| {{increase}} '''5'''||[[Courtown]]{{efn|Listed as Courtown Harbour-Riverchapel-Ardamine in the 2016 census.}}||[[County Wexford]]||align="right"|4,365||align="right"|21.6% |
||
|- |
|- |
||
|107|| style="text-align:center; color:#f00;"| {{decrease}} '''2'''||[[Macroom]]||[[County Cork]]||align="right"|4,096||align="right"|8.8% |
|107|| style="text-align:center; color:#f00;"| {{decrease}} '''2'''||[[Macroom]]||[[County Cork]]||align="right"|4,096||align="right"|8.8% |
||
| Line 321: | Line 321: | ||
|153|| style="text-align:center; color:#0c0;"| {{increase}} '''8'''||[[Castlerea]]||[[County Roscommon]]||align="right"|2,348||align="right"|17.9% |
|153|| style="text-align:center; color:#0c0;"| {{increase}} '''8'''||[[Castlerea]]||[[County Roscommon]]||align="right"|2,348||align="right"|17.9% |
||
|- |
|- |
||
|154|| style="text-align:center; color:#0c0;"| {{increase}} '''5'''||[[Barna]]{{ |
|154|| style="text-align:center; color:#0c0;"| {{increase}} '''5'''||[[Barna]]{{efn|Listed as Bearna in the 2016 and 2022 census.}}||[[County Galway]]||align="right"|2,336||align="right"|16.9% |
||
|- |
|- |
||
|155|| style="text-align:center; color:#0c0;"| {{increase}} '''7'''||[[Tubbercurry]]||[[County Sligo]]||align="right"|2,307||align="right"|16.2% |
|155|| style="text-align:center; color:#0c0;"| {{increase}} '''7'''||[[Tubbercurry]]||[[County Sligo]]||align="right"|2,307||align="right"|16.2% |
||
| Line 329: | Line 329: | ||
|157|| style="text-align:center; color:#0c0;"| {{increase}} '''1'''||[[Balrothery]]||[[County Dublin]]||align="right"|2,282||align="right"|13.1% |
|157|| style="text-align:center; color:#0c0;"| {{increase}} '''1'''||[[Balrothery]]||[[County Dublin]]||align="right"|2,282||align="right"|13.1% |
||
|- |
|- |
||
|158|| style="text-align:center; color:#0c0;"| {{increase}} '''28'''||[[Moycullen]]{{ |
|158|| style="text-align:center; color:#0c0;"| {{increase}} '''28'''||[[Moycullen]]{{efn|Listed as Maigh Cuilinn in the 2016 and 2022 census.|}}||[[County Galway]]||align="right"|2,279||align="right"|33.7% |
||
|- |
|- |
||
|159|| style="text-align:center; color:#f00;"| {{decrease}} '''7'''||[[Clogherhead]]||[[County Louth]]||align="right"|2,275||align="right"|6.1% |
|159|| style="text-align:center; color:#f00;"| {{decrease}} '''7'''||[[Clogherhead]]||[[County Louth]]||align="right"|2,275||align="right"|6.1% |
||
| Line 335: | Line 335: | ||
|160|| style="text-align:center; color:#0c0;"| {{increase}} '''25'''||[[Rathdrum, County Wicklow|Rathdrum]]||[[County Wicklow]]||align="right"|2,264||align="right"|36.1% |
|160|| style="text-align:center; color:#0c0;"| {{increase}} '''25'''||[[Rathdrum, County Wicklow|Rathdrum]]||[[County Wicklow]]||align="right"|2,264||align="right"|36.1% |
||
|- |
|- |
||
|161|| style="text-align:center; color:#0c0;"| {{increase}} '''80'''||[[Rosslare Harbour]]{{ |
|161|| style="text-align:center; color:#0c0;"| {{increase}} '''80'''||[[Rosslare Harbour]]{{efn|Listed as Ballygeary (Rosslare Harbour) in the 2016 census.}}||[[County Wexford]]||align="right"|2,247||align="right"|87.3% |
||
|- |
|- |
||
|162|| style="text-align:center; color:#f00;"| {{decrease}} '''12'''||[[Ballyshannon]]||[[County Donegal]]||align="right"|2,246||align="right"|-2.3% |
|162|| style="text-align:center; color:#f00;"| {{decrease}} '''12'''||[[Ballyshannon]]||[[County Donegal]]||align="right"|2,246||align="right"|-2.3% |
||
| Line 341: | Line 341: | ||
|163|| style="text-align:center; color:#f00;"| {{decrease}} '''6'''||[[Abbeyfeale]]||[[County Wexford]]||align="right"|2,206||align="right"|9.0% |
|163|| style="text-align:center; color:#f00;"| {{decrease}} '''6'''||[[Abbeyfeale]]||[[County Wexford]]||align="right"|2,206||align="right"|9.0% |
||
|- |
|- |
||
|164|| style="text-align:center; color:#f00;"| {{decrease}} '''9'''||[[Edgeworthstown]]{{ |
|164|| style="text-align:center; color:#f00;"| {{decrease}} '''9'''||[[Edgeworthstown]]{{efn|Listed as Meathas Truim (Edgeworthstown) in the 2016 census.}}||[[County Longford]]||align="right"|2,199||align="right"|6.1% |
||
|- |
|- |
||
|165|| style="text-align:center; color:#f00;"| {{decrease}} '''5'''||[[Newport, County Tipperary|Newport]]||[[County Tipperary]]||align="right"|2,183||align="right"|9.4% |
|165|| style="text-align:center; color:#f00;"| {{decrease}} '''5'''||[[Newport, County Tipperary|Newport]]||[[County Tipperary]]||align="right"|2,183||align="right"|9.4% |
||
| Line 351: | Line 351: | ||
|168|| style="text-align:center; color:#0c0;"| {{increase}} '''8'''||[[Mountrath]]||[[County Laois]]||align="right"|2,070||align="right"|16.7% |
|168|| style="text-align:center; color:#0c0;"| {{increase}} '''8'''||[[Mountrath]]||[[County Laois]]||align="right"|2,070||align="right"|16.7% |
||
|- |
|- |
||
|169|| style="text-align:center; color:#f00;"| {{decrease}} '''6'''||[[Bunclody]]{{ |
|169|| style="text-align:center; color:#f00;"| {{decrease}} '''6'''||[[Bunclody]]{{efn|Listed as Bunclody-Carrickduff in the 2016 census.}}||[[County Wexford]] & [[County Carlow]]||align="right"|2,053||align="right"|3.5% |
||
|- |
|- |
||
|170|| style="text-align:center; color:#f00;"| {{decrease}} '''5'''||[[Templemore]]||[[County Tipperary]]||align="right"|2,005||align="right"|3.4% |
|170|| style="text-align:center; color:#f00;"| {{decrease}} '''5'''||[[Templemore]]||[[County Tipperary]]||align="right"|2,005||align="right"|3.4% |
||
| Line 393: | Line 393: | ||
|189|| style="text-align:center; color:#0af;"| {{steady}} '''0'''||[[Collooney]]||[[County Sligo]]||align="right"|1,797||align="right"|11.6% |
|189|| style="text-align:center; color:#0af;"| {{steady}} '''0'''||[[Collooney]]||[[County Sligo]]||align="right"|1,797||align="right"|11.6% |
||
|- |
|- |
||
|190|| style="text-align:center; color:#f00;"| {{decrease}} '''2'''||[[Rosslare Strand]]{{ |
|190|| style="text-align:center; color:#f00;"| {{decrease}} '''2'''||[[Rosslare Strand]]{{efn|Listed as Rosslare in the 2016 census.}}||[[County Wexford]]||align="right"|1,795||align="right"|10.8% |
||
|- |
|- |
||
|191|| style="text-align:center; color:#f00;"| {{decrease}} '''7'''||[[Kilmallock]]||[[County Limerick]]||align="right"|1,761||align="right"|5.6% |
|191|| style="text-align:center; color:#f00;"| {{decrease}} '''7'''||[[Kilmallock]]||[[County Limerick]]||align="right"|1,761||align="right"|5.6% |
||
|- |
|- |
||
|192|| style="text-align:center; color:#0c0;"| {{increase}} '''33'''||[[Ballysadare]]{{ |
|192|| style="text-align:center; color:#0c0;"| {{increase}} '''33'''||[[Ballysadare]]{{efn|Listed as Ballisodare in the 2016 census.}}||[[County Sligo]]||align="right"|1,747||align="right"|29.4% |
||
|- |
|- |
||
|193|| style="text-align:center; color:#0c0;"| {{increase}} '''5'''||[[Fethard, County Tipperary|Fethard]]||[[County Tipperary]]||align="right"|1,738||align="right"|12.5% |
|193|| style="text-align:center; color:#0c0;"| {{increase}} '''5'''||[[Fethard, County Tipperary|Fethard]]||[[County Tipperary]]||align="right"|1,738||align="right"|12.5% |
||
| Line 414: | Line 414: | ||
|- |
|- |
||
|200|| style="text-align:center; color:#f00;"| {{decrease}} '''3'''||[[Tullyallen, County Louth|Tullyallen]]||[[County Louth]]||align="right"|1,697||align="right"|9.7% |
|200|| style="text-align:center; color:#f00;"| {{decrease}} '''3'''||[[Tullyallen, County Louth|Tullyallen]]||[[County Louth]]||align="right"|1,697||align="right"|9.7% |
||
|- |
|||
|201|| ||[[Portumna]]||[[County Galway]]||align="right"|1,690|| |
|||
|- |
|||
|202=|| ||[[Castledermot]]||[[County Kildare]]||align="right"|1,685|| |
|||
|- |
|||
|202=|| ||[[Allenwood, County Kildare|Allenwood]]||[[County Kildare]]||align="right"|1,685|| |
|||
|- |
|||
|202=|| ||[[Longwood, County Meath|Longwood]]||[[County Meath]]||align="right"|1,685|| |
|||
|- |
|||
|205|| ||[[Dingle]]||[[County Kerry]]||align="right"|1,671|| |
|||
|- |
|||
|206|| ||[[Manorhamilton]]||[[County Leitrim]]||align="right"|1,667|| |
|||
|- |
|||
|207|| ||[[Killaloe, County Clare|Killaloe]]||[[County Clare]]||align="right"|1,666|| |
|||
|- |
|||
|208|| ||[[Mullagh, County Cavan|Mullagh]]||[[County Cavan]]||align="right"|1,651|| |
|||
|- |
|||
|209|| ||[[Claregalway]]{{efn|Listed as Baile Chláir in the 2016 and 2022 census.}}||[[County Galway]]||align="right"|1,632|| |
|||
|- |
|||
|210|| ||[[Ballybunion]]||[[County Kerry]]||align="right"|1,618|| |
|||
|- |
|||
|211|| ||[[Lifford]]||[[County Donegal]]||align="right"|1,613|| |
|||
|- |
|||
|212|| ||[[Belturbet]]||[[County Cavan]]||align="right"|1,610|| |
|||
|- |
|||
|213|| ||[[Castlemartyr]]||[[County Cork]]||align="right"|1,603|| |
|||
|- |
|||
|214|| ||[[Kilbeggan]]||[[County Westmeath]]||align="right"|1,575|| |
|||
|- |
|||
|215|| ||[[Killucan and Rathwire]]||[[County Westmeath]]||align="right"|1,574|| |
|||
|- |
|||
|216|| ||[[Caherconlish]]||[[County Limerick]]||align="right"|1,569|| |
|||
|- |
|||
|217|| ||[[Carlingford, County Louth|Carlingford]]||[[County Louth]]||align="right"|1,528|| |
|||
|- |
|||
|218|| ||[[Graiguenamanagh|Graiguenamanagh–Tinnahinch]]||[[County Kilkenny]] & [[County Carlow]]||align="right"|1,506|| |
|||
|- |
|||
|219|| ||[[Rochfortbridge]]||[[County Westmeath]]||align="right"|1,498|| |
|||
|- |
|||
|220|| ||[[Castlecomer]]||[[County Kilkenny]]||align="right"|1,496|| |
|||
|- |
|||
|221|| ||[[Coill Dubh]]||[[County Kildare]]||align="right"|1,476|| |
|||
|- |
|||
|222|| ||[[Killumney]]||[[County Cork]]||align="right"|1,466|| |
|||
|- |
|||
|223|| ||[[Swinford]]||[[County Mayo]]||align="right"|1,459|| |
|||
|- |
|||
|224|| ||[[Foxford]]||[[County Mayo]]||align="right"|1,452|| |
|||
|- |
|||
|225|| ||[[Slane]]||[[County Meath]]||align="right"|1,445|| |
|||
|- |
|||
|226|| ||[[Aughrim, County Wicklow|Aughrim]]||[[County Wicklow]]||align="right"|1,437|| |
|||
|- |
|||
|227|| ||[[Moroe]]||[[County Limerick]]||align="right"|1,432|| |
|||
|- |
|||
|228|| ||[[Ballyconnell]]||[[County Cavan]]||align="right"|1,422|| |
|||
|- |
|||
|229|| ||[[Muff, County Donegal|Muff]]||[[County Donegal]]||align="right"|1,418|| |
|||
|- |
|||
|230|| ||[[Oldcastle, County Meath|Oldcastle]]||[[County Meath]]||align="right"|1,409|| |
|||
|- |
|||
|231|| ||[[Stradbally]]||[[County Laois]]||align="right"|1,404|| |
|||
|- |
|||
|232|| ||[[Moville]]||[[County Donegal]]||align="right"|1,390|| |
|||
|- |
|||
|233|| ||[[Ballinroad]]||[[County Waterford]]||align="right"|1,389|| |
|||
|- |
|||
|234|| ||[[Rathdowney]]||[[County Laois]]||align="right"|1,368|| |
|||
|- |
|||
|235|| ||[[Castlepollard]]||[[County Westmeath]]||align="right"|1,349|| |
|||
|- |
|||
|236|| ||[[Lismore, County Waterford|Lismore]]||[[County Waterford]]||align="right"|1,347|| |
|||
|- |
|||
|237|| ||[[Ballybay]]||[[County Monaghan]]||align="right"|1,329|| |
|||
|- |
|||
|238|| ||[[Ferbane]]||[[County Offaly]]||align="right"|1,324|| |
|||
|- |
|||
|239|| ||[[Johnstown, County Kildare|Johnstown]]||[[County Kildare]]||align="right"|1,320|| |
|||
|- |
|||
|240|| ||[[Ferns, County Wexford|Ferns]]||[[County Wexford]]||align="right"|1,317|| |
|||
|- |
|||
|241|| ||[[Cahirciveen]]||[[County Kerry]]||align="right"|1,297|| |
|||
|- |
|||
|242|| ||[[Dromiskin]]||[[County Louth]]||align="right"|1,292|| |
|||
|- |
|||
|243|| ||[[Enniscrone]]||[[County Sligo]]||align="right"|1,291|| |
|||
|- |
|||
|244|| ||[[Ramelton]]||[[County Donegal]]||align="right"|1,288|| |
|||
|- |
|||
|245|| ||[[Piltown]]||[[County Kilkenny]]||align="right"|1,275|| |
|||
|- |
|||
|246|| ||[[Greencastle, County Donegal|Greencastle]]||[[County Donegal]]||align="right"|1,268|| |
|||
|- |
|||
|247|| ||[[Portrane]]||[[County Dublin]]||align="right"|1,262|| |
|||
|- |
|||
|248|| ||[[Clifden]]||[[County Galway]]||align="right"|1,259|| |
|||
|- |
|||
|249|| ||[[Killybegs]]||[[County Donegal]]||align="right"|1,258|| |
|||
|- |
|||
|250|| ||[[Kilpedder]]||[[County Wicklow]]||align="right"|1,248|| |
|||
|} |
|} |
||
Revision as of 15:17, 7 October 2023

This is a list of urban areas in the Republic of Ireland by population. In 2022, the Central Statistics Office (CSO), the Department of Housing, Local Government and Heritage and Tailte Éireann created of a new unit of urban geography called Built Up Areas (BUAs) which were used to produce data for urban areas in the 2022 census of Ireland.[1]
There were 867 BUAs, representing the entire settlement area of each town and city (including suburbs and environs). The 250 largest cities, towns and villages are listed below with data from the 2022 census.[2]
Cities and towns list
Notes
- ^ Listed as Courtown Harbour-Riverchapel-Ardamine in the 2016 census.
- ^ Listed as Bearna in the 2016 and 2022 census.
- ^ Listed as Maigh Cuilinn in the 2016 and 2022 census.
- ^ Listed as Ballygeary (Rosslare Harbour) in the 2016 census.
- ^ Listed as Meathas Truim (Edgeworthstown) in the 2016 census.
- ^ Listed as Bunclody-Carrickduff in the 2016 census.
- ^ Listed as Rosslare in the 2016 census.
- ^ Listed as Ballisodare in the 2016 census.
- ^ Listed as Baile Chláir in the 2016 and 2022 census.
-
 1st, Dublin
 -
 2nd, Cork
 -
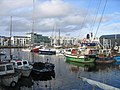
 3rd, Limerick
 -
 4th, Galway
 -
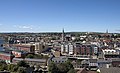
 5th, Waterford
 -
 6th, Drogheda
 -
 7th, Dundalk
 -
 8th, Swords
 -
 9th, Navan
 -
 10th, Bray
 -
 11th, Ennis
 -
 12th, Carlow
 -
 13th, Kilkenny
 -
 14th, Naas
 -
 15th, Tralee


See also
- List of urban areas in the Republic of Ireland/2016 census
- List of urban areas in the Republic of Ireland/2011 census
- List of urban areas in the Republic of Ireland/2006 census
- List of urban areas in the Republic of Ireland/2002 census
- List of towns and villages in the Republic of Ireland
- List of localities in Northern Ireland by population
- List of settlements on the island of Ireland by population
References
- ^ "Census 2022 Urban Boundaries and Built Up Areas". CSO. 21 June 2023. Retrieved 3 July 2023.
- ^ a b "Census 2022 Profile 1 - Population Distribution and Movements". CSO.