2016 United States presidential election in Vermont
| |||||||||||||||||||||||||||||||||
| Turnout | 67.95% | ||||||||||||||||||||||||||||||||
|---|---|---|---|---|---|---|---|---|---|---|---|---|---|---|---|---|---|---|---|---|---|---|---|---|---|---|---|---|---|---|---|---|---|
| |||||||||||||||||||||||||||||||||
| |||||||||||||||||||||||||||||||||
| |||||||||||||||||||||||||||||||||
| Elections in Vermont |
|---|
 |

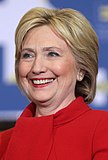
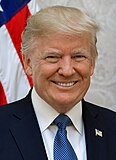
The 2016 United States presidential election in Vermont was held on November 8, 2016, as part of the 2016 United States presidential election in which all 50 states plus the District of Columbia participated. Vermont voters chose three electors to represent them in the Electoral College via a popular vote pitting the Republican Party's nominee, businessman Donald Trump, and his running mate Indiana Governor Mike Pence, against the Democratic Party's nominee, former U.S. Secretary of State Hillary Clinton, and her running mate, Virginia Senator Tim Kaine. Independent Vermont Senator Bernie Sanders received a number of unsolicited write-in votes.
Clinton won Vermont with 55.7% of the vote and[1] a vote margin of 25.9%, a substantial decline from Barack Obama's 35.6% margin in 2012.[2] Trump received 29.8% of the vote statewide and carried Essex County—the most rural and sparsely populated county in the state, thus making him the first Republican presidential candidate to win a county in Vermont since George W. Bush in 2004.
After voting Republican in all but one election from 1856 to 1988, Vermont has since become one of the most reliably Democratic strongholds in the nation. In 2016, Trump became only the second Republican, after George W. Bush, to win the White House without carrying Vermont.
Vermont Senator and Democratic primary candidate Bernie Sanders, who had endorsed Clinton after she won the primary, received 5.7% of the vote through write-ins, the highest write-in draft campaign percentage for a statewide presidential candidate in history.[3] Libertarian nominee Gary Johnson, received 3.1%, and Green Party nominee Jill Stein received 2.1%.[4] Trump's 29.76% vote share is the worst for a Republican presidential nominee in Vermont history.
Primary elections
[edit]On March 1, 2016, in the presidential primaries, Vermont voters expressed their preferences for the Democratic, Republican, and Libertarian parties. Voters who were unaffiliated chose any 1 primary in which to vote.
Democratic primary
[edit]The 2016 Vermont Democratic primary took place on March 1 as one of the Democratic Party's primaries ahead of the 2016 presidential election.
On the same day, dubbed "Super Tuesday," Democratic primaries were held in 10 other states plus American Samoa, while the Republican Party held primaries in 11 states including their own Vermont primary.
As Sanders was an extremely popular favorite son, there was no campaign to speak of and all pledged delegates were given to Sanders, due to Clinton getting less than 15% of the popular vote. Sanders won every municipality in the state.
Republican primary
[edit]| Candidate | Votes | Percentage | Actual delegate count | ||
|---|---|---|---|---|---|
| Bound | Unbound | Total | |||
| Donald Trump | 19,974 | 32.34% | 8 | 0 | 8 |
| John Kasich | 18,534 | 30.01% | 8 | 0 | 8 |
| Marco Rubio | 11,781 | 19.08% | 0 | 0 | 0 |
| Ted Cruz | 5,932 | 9.61% | 0 | 0 | 0 |
| Ben Carson | 2,551 | 4.13% | 0 | 0 | 0 |
| Jeb Bush (withdrawn) | 1,106 | 1.79% | 0 | 0 | 0 |
| Rand Paul (withdrawn) | 423 | 0.68% | 0 | 0 | 0 |
| Chris Christie (withdrawn) | 361 | 0.58% | 0 | 0 | 0 |
| Carly Fiorina (withdrawn) | 212 | 0.34% | 0 | 0 | 0 |
| Rick Santorum (withdrawn) | 164 | 0.27% | 0 | 0 | 0 |
| Unprojected delegates: | 0 | 0 | 0 | ||
| Total: | 61,756 | 100.00% | 16 | 0 | 16 |
| Source: The Green Papers | |||||
General election
[edit]Predictions
[edit]| Source | Ranking | As of |
|---|---|---|
| Los Angeles Times[5] | Safe D | November 6, 2016 |
| CNN[6] | Safe D | November 4, 2016 |
| Cook Political Report[7] | Safe D | November 7, 2016 |
| Electoral-vote.com[8] | Safe D | November 8, 2016 |
| Rothenberg Political Report[9] | Safe D | November 7, 2016 |
| Sabato's Crystal Ball[10] | Safe D | November 7, 2016 |
| RealClearPolitics[11] | Safe D | November 8, 2016 |
| Fox News[12] | Safe D | November 7, 2016 |
Polling
[edit]Hillary Clinton won every poll pre-election by double digits. Interestingly, she only reached 50% in the last poll, leading 50% to 22%, which may indicate support for writing in Bernie Sanders or other third-party candidates. The average of the final three polls showed Hillary Clinton leading Trump 48% to 22%.[13]
Results
[edit]| Party | Candidate | Votes | % | |
|---|---|---|---|---|
| Democratic | Hillary Clinton | 178,573 | 55.72% | |
| Republican | Donald Trump | 95,369 | 29.76% | |
| Independent | Bernie Sanders (write-in) | 18,218 | 5.68% | |
| Libertarian | Gary Johnson | 10,078 | 3.14% | |
| Green | Jill Stein | 6,758 | 2.11% | |
| Reform | Rocky De La Fuente | 1,063 | 0.33% | |
| Republican | John Kasich (write-in) | 831 | 0.26% | |
| Independent | Evan McMullin (write-in) | 641 | 0.20% | |
| Liberty Union | Gloria La Riva | 327 | 0.10% | |
| Constitution | Darrell Castle (write-in) | 63 | 0.02% | |
| Socialist | Mimi Soltysik (write-in) | 3 | <0.01% | |
| Write-in | Other Write-in | 3,143 | 1.00% | |
| n/a | No Name/None of the Above | 257 | 0.09% | |
| n/a | Spoiled/blank | 5,400 | 1.69% | |
| Total votes | 320,467 | 100.00% | ||
| Democratic win | ||||
Extended content
| ||||
|---|---|---|---|---|
| Other Write-ins | Candidate | Votes | Percentage | |
| Republican | Mike Pence (write-in) | 305 | 0.09% | |
| Republican | Paul Ryan (write-in) | 209 | 0.06% | |
| Republican | Mitt Romney (write-in) | 122 | 0.04% | |
| Republican | Marco Rubio (write-in) | 93 | 0.03% | |
| Republican | Jeb Bush (write-in) | 79 | 0.03% | |
| Republican | John McCain (write-in) | 76 | 0.03% | |
| Republican | Ted Cruz (write-in) | 63 | 0.02% | |
| Libertarian | Ron Paul (write-in) | 25 | 0.02% | |
| Republican | Colin Powell (write-in) | 25 | 0.02% | |
| Democratic | Martin O'Malley (write-in) | 6 | <0.01% | |
| n/a | Write-in (Other) | 2,140 | 0.72% |
By county
[edit]| County | Hillary Clinton Democratic |
Donald Trump Republican |
Various candidates Other parties |
Margin | Total votes cast | ||||
|---|---|---|---|---|---|---|---|---|---|
| # | % | # | % | # | % | # | % | ||
| Addison | 11,219 | 58.95% | 5,297 | 27.83% | 2,515 | 13.22% | 5,922 | 31.12% | 19,031 |
| Bennington | 9,539 | 54.88% | 5,925 | 34.09% | 1,917 | 11.03% | 3,614 | 20.79% | 17,381 |
| Caledonia | 6,445 | 45.79% | 5,534 | 39.32% | 2,095 | 14.89% | 911 | 6.47% | 14,074 |
| Chittenden | 54,814 | 65.71% | 18,601 | 22.30% | 10,001 | 11.99% | 36,213 | 43.41% | 83,416 |
| Essex | 1,019 | 34.84% | 1,506 | 51.49% | 400 | 13.67% | -487 | -16.65% | 2,925 |
| Franklin | 9,351 | 43.67% | 8,752 | 40.88% | 3,308 | 15.45% | 599 | 2.79% | 21,411 |
| Grand Isle | 2,094 | 50.96% | 1,487 | 36.19% | 528 | 12.85% | 607 | 14.77% | 4,109 |
| Lamoille | 7,241 | 56.74% | 3,570 | 27.97% | 1,951 | 15.29% | 3,671 | 28.77% | 12,762 |
| Orange | 7,541 | 51.48% | 5,007 | 34.18% | 2,101 | 14.34% | 2,534 | 17.30% | 14,649 |
| Orleans | 5,185 | 43.04% | 5,159 | 42.83% | 1,702 | 14.13% | 26 | 0.21% | 12,046 |
| Rutland | 13,635 | 46.04% | 12,479 | 42.14% | 3,501 | 11.82% | 1,156 | 3.90% | 29,615 |
| Washington | 18,594 | 59.81% | 7,993 | 25.71% | 4,499 | 14.48% | 10,601 | 34.10% | 31,086 |
| Windham | 14,340 | 63.36% | 5,454 | 24.10% | 2,840 | 12.54% | 8,886 | 39.26% | 22,634 |
| Windsor | 17,556 | 58.66% | 8,605 | 28.75% | 3,767 | 12.59% | 8,951 | 29.91% | 29,928 |
| Totals | 178,573 | 56.68% | 95,369 | 30.27% | 41,125 | 13.05% | 83,204 | 26.41% | 315,067 |
- Counties that flipped from Democratic to Republican
By congressional district
[edit]Due to the state's low population, only one congressional district is allocated. This district, called the at-large district because it covers the entire state, is thus equivalent to the statewide election results.
| District | Trump | Clinton | Representative |
|---|---|---|---|
| At-large | 29.76% | 55.72% | Peter Welch |
See also
[edit]- United States presidential elections in Vermont
- 2016 Democratic Party presidential debates and forums
- 2016 Democratic Party presidential primaries
- 2016 Republican Party presidential debates and forums
- 2016 Republican Party presidential primaries
References
[edit]- ^ "2016 Presidential General Election Results - Vermont".
- ^ "Vermont Election Results 2016". The New York Times. August 1, 2017. ISSN 0362-4331. Retrieved January 11, 2020.
- ^ Weigel, David (November 17, 2016). "More than 18,000 Vermonters wrote in Bernie Sanders for president". The Washington Post. Retrieved January 11, 2020.
- ^ "Vermont Election Night Results". sec state vt us/. Archived from the original on May 28, 2019. Retrieved November 12, 2016.
- ^ "Our final map has Clinton winning with 352 electoral votes. Compare your picks with ours". Los Angeles Times. November 6, 2016. Retrieved November 13, 2016.
- ^ Chalian, David (November 4, 2016). "Road to 270: CNN's new election map". CNN. Retrieved March 3, 2019.
- ^ "2016 Electoral Scorecard". The Cook Political Report. November 7, 2016. Archived from the original on March 1, 2019. Retrieved March 3, 2019.
- ^ "2016 Electoral Map Prediction". Electoral-vote.com. November 8, 2016. Retrieved March 3, 2019.
- ^ "Presidential Ratings". The Rothenberg Political Report. Retrieved August 16, 2021.
- ^ Sabato, Larry J. (November 7, 2016). "2016 President". University of Virginia Center for Politics. Retrieved March 3, 2019.
- ^ "2016 Election Maps - Battle for White House". RealClearPolitics. Retrieved November 13, 2016.
- ^ "Electoral Scorecard: Map shifts again in Trump's favor, as Clinton holds edge". Fox News. November 7, 2016. Retrieved November 13, 2016.
- ^ "RealClearPolitics - Election 2016 - Vermont: Trump vs. Clinton". www.realclearpolitics.com. 2017. Retrieved September 15, 2020.
- ^ "Presidential Election Statement of Votes". Vermont Secretary of State. Archived from the original on April 7, 2016. Retrieved November 26, 2016.
- ^ http://www.thegreenpapers.com/G16/VT The Green Papers
- ^ "Here's a map of the US counties that flipped to Trump from Democrats". www.cnbc.com. Retrieved September 1, 2020.


