
South Texas


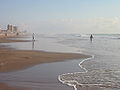
South Texas is a region of the U.S. state of Texas that lies roughly south of and including San Antonio. The southern and western boundary is the Rio Grande River, and to the east it is the Gulf of Mexico. The population of this region is about 4.5 million. The southern portion of this region is often referred to as the Rio Grande Valley. The eastern portion along the Gulf of Mexico is also referred to as the Coastal Bend.
Land
There is no defined northern boundary, although it is believed to be at the city of San Antonio and from an east to west line extending from the Rio Grande near Maverick County to the Gulf of Mexico, but turning southeast at or near Lavaca County, and continuing towards the Gulf of Mexico to separate it from East Texas and Southeast Texas. The Rio Grande serves as the western and southern boundaries and separates Texas from Mexico. The eastern portion of South Texas is bordered by the Gulf of Mexico. This region of Texas consist of 41 counties.South Texas terrain is flat, lying on the coastal plain. South Texas itself is so vast that there are even sub-regions. The very southern tip of South Texas is called the Rio Grande Valley which has a fertile soil and known for its citrus production . The eastern portion of South Texas is often referred to as the Coastal Bend, here coastal salt marshes, estuaries and wetlands are scattered and the western and central parts are known as the South Texas Plains or the brush country. Mesquite trees and crop fields dominate the land.
Counties

Cities
| City | 2010 Census Population[1] | State Rank | County |
| San Antonio | 1,327,407 | 2 | Bexar County |
| Corpus Christi | 305,215 | 8 | Nueces County |
| Laredo | 236,091 | 10 | Webb County |
| Brownsville | 175,023 | 16 | Cameron County |
| McAllen | 129,877 | 20 | Hidalgo County |
| Edinburg | 77,100 | 43 | Hidalgo County |
| Mission | 77,058 | 44 | Hidalgo County |
| Pharr | 70,400 | 47 | Hidalgo County |
| Harlingen | 64,849 | 51 | Cameron County |
| Victoria | 62,592 | 54 | Victoria County |
| Weslaco | 35,670 | 88 | Hidalgo County |
| San Juan | 33,856 | 91 | Hidalgo County |
| Schertz | 31,465 | 97 | Bexar County |
| Eagle Pass | 26,248 | 109 | Maverick County |
| Kingsville | 26,213 | 110 | Kleberg County |
| Seguin | 25,175 | 114 | Guadalupe County |
| San Benito | 24,250 | 116 | Cameron County |
Some people consider Houston to be in South Texas for several reasons. Numerous businesses in the Houston region contain 'South Texas' in their titles.[2] The South Texas College of Law is located in downtown Houston. The United States District Court for the Southern District of Texas includes the Houston division. And like South Texas, the city has a large Hispanic population. However, Houston is most accurately classified as being within Southeast Texas, a subregion of East Texas.
Rivers
| City | Note |
| Rio Grande | Forms the international border between the United States and Mexico. |
| Nueces River | At one time considered by Mexico as the border between Texas and Mexico. |
| San Antonio River | Part of the river is the location of San Antonio's Famous River Walk. |
| Aransas River | A short rivers that drains in Copano Bay. |
| Frio River | A fairly cold river hence the name Frio, is the Spanish term for Cold |
| Atascosa River | A short river that empties into the Frio River |
| Mission River | Flows into Mission Bay |
| Leona River | A tributary of the Frio River, within the Nueces River Basin |
| Guadalupe River (Texas) | Flows into the San Antonio Bay estuary at Guadalupe Bay |
Lakes And Reservoirs
- Choke Canyon Reservoir
- Brauning Lake
- Lake Calaveras
- Lake Corpus Christi
- Falcon Lake
- Lake Amistad
- Mitchell Lake
- Lake Casa Blanca
Bays
- Corpus Christi Bay
- San Antonio Bay
- Baffin Bay
- Nueces Bay
- Oso Bay
- Copano Bay
- Aransas Bay
- Matagorda Bay
- Lavaca Bay
- Redfish Bay
- Mission Bay
Estuaries and Waterways
- Rincon Bayou- A bayou in the Nueces River Delta, Just north of the mouth of the Nueces River, For Location See Nueces Bay (Features (Map)
- Elm Bayou- A bayou on the Victoria-Refugio County Line
- Gulf Intracoastal Waterway- A navigable route along the Gulf Of Mexico without many of the hazards of travel on the open sea.
- Resaca's of the Rio Grande Valley- Many oxbow lakes found scattered throughout the lower Rio Grande Valley
- Laguna Madre- a long hypersaline bay that crates a barrier between Padre Island and mainland Texas
Islands
Climate
The true climate of South Texas is varied. The area along the Mexican border is considered a desert climate while the coastal area is a humid subtropical climate(Köppen climate classification Cfa or Cwa). Its weather is affected by the Sierra Madre Oriental mountains to the west, the Gulf of Mexico to the east, and the Chihuahuan Desert of Northern Mexico. Moisture from the Pacific is cut off by the Mexican mountain range. Along coastal south Texas the climate is best exemplified in the summers because the summers are long and almost tropical or arid, depending if tropical moisture from the gulf and sometimes from the pacific (Pacific Hurricanes) are flowing in or if the region is affected with long droughts and is cut off from any moisture , which occur every few years., and temperatures reach freezing only a few times in the winter with rare snowfall, usually three inches or less. Summers in this zone are hot and humid, with daily averages above 25 °C (90 °F), air temps could feel like an arid climate inland and tropical along the coast. In addition, areas in Texas that are slightly inland from the Gulf of Mexico, such as San Antonio that border the semi-arid climate zone, generally see a peak of precipitation in the spring, and a deep, drought-like nadir in mid-summer . Night time tempputaures are around 85° F in summer. The region of South Texas includes the semiarid ranch country and the wetter Rio Grande Valley. Considered to be the southernmost tip of the American Great Plains region, the inland region has rainfall that is similar to that of the Northern Plains. The coastal areas are nearly warm most of the year due to currents of the Gulf of Mexico, but can get cold in winter if a strong front comes in, and sometimes even causing snow at sea level.Rain in the coastal region is more abundant than in the inland region. Inland, where it is drier, ranches dominate the landscape, characterized by thick spiny brush and grasslands. The winters in the inland region are cold and dry as Arctic air makes it into the region, therefore making snow a rare occurrence due to the lack of humidity in winter, and the summers are for the most part hot and dry, but at times can be humid if winds come off the warmer Gulf of Mexico. Tornadoes can occur in this region, but less frequent than in other parts of the state
| Climate data for San Antonio (San Antonio Int'l), 1991–2020 normals,[a] extremes 1885–present[b] | |||||||||||||
|---|---|---|---|---|---|---|---|---|---|---|---|---|---|
| Month | Jan | Feb | Mar | Apr | May | Jun | Jul | Aug | Sep | Oct | Nov | Dec | Year |
| Record high °F (°C) | 89 (32) |
100 (38) |
100 (38) |
101 (38) |
104 (40) |
108 (42) |
107 (42) |
110 (43) |
111 (44) |
99 (37) |
94 (34) |
90 (32) |
111 (44) |
| Mean maximum °F (°C) | 80.3 (26.8) |
84.9 (29.4) |
88.9 (31.6) |
92.2 (33.4) |
96.0 (35.6) |
98.9 (37.2) |
100.5 (38.1) |
102.1 (38.9) |
98.7 (37.1) |
93.1 (33.9) |
85.1 (29.5) |
80.6 (27.0) |
103.8 (39.9) |
| Mean daily maximum °F (°C) | 63.3 (17.4) |
67.5 (19.7) |
73.8 (23.2) |
80.3 (26.8) |
86.6 (30.3) |
92.4 (33.6) |
94.9 (34.9) |
96.0 (35.6) |
90.1 (32.3) |
82.2 (27.9) |
71.7 (22.1) |
64.7 (18.2) |
80.3 (26.8) |
| Daily mean °F (°C) | 52.2 (11.2) |
56.3 (13.5) |
62.8 (17.1) |
69.4 (20.8) |
76.5 (24.7) |
82.6 (28.1) |
84.8 (29.3) |
85.5 (29.7) |
79.9 (26.6) |
71.3 (21.8) |
60.7 (15.9) |
53.5 (11.9) |
69.6 (20.9) |
| Mean daily minimum °F (°C) | 41.0 (5.0) |
45.1 (7.3) |
51.8 (11.0) |
58.4 (14.7) |
66.4 (19.1) |
72.7 (22.6) |
74.7 (23.7) |
74.9 (23.8) |
69.6 (20.9) |
60.4 (15.8) |
49.8 (9.9) |
42.4 (5.8) |
58.9 (14.9) |
| Mean minimum °F (°C) | 26.2 (−3.2) |
29.0 (−1.7) |
33.7 (0.9) |
41.6 (5.3) |
53.1 (11.7) |
65.3 (18.5) |
70.2 (21.2) |
69.4 (20.8) |
57.4 (14.1) |
41.8 (5.4) |
32.2 (0.1) |
27.4 (−2.6) |
23.5 (−4.7) |
| Record low °F (°C) | 0 (−18) |
4 (−16) |
19 (−7) |
31 (−1) |
42 (6) |
48 (9) |
60 (16) |
57 (14) |
41 (5) |
27 (−3) |
21 (−6) |
6 (−14) |
0 (−18) |
| Average precipitation inches (mm) | 1.96 (50) |
1.74 (44) |
2.31 (59) |
2.42 (61) |
4.40 (112) |
3.28 (83) |
2.41 (61) |
2.15 (55) |
3.88 (99) |
3.75 (95) |
2.08 (53) |
2.00 (51) |
32.38 (822) |
| Average snowfall inches (cm) | 0.0 (0.0) |
0.1 (0.25) |
0.0 (0.0) |
0.0 (0.0) |
0.0 (0.0) |
0.0 (0.0) |
0.0 (0.0) |
0.0 (0.0) |
0.0 (0.0) |
0.0 (0.0) |
0.0 (0.0) |
0.1 (0.25) |
0.2 (0.51) |
| Average precipitation days (≥ 0.01 in) | 6.9 | 7.4 | 8.5 | 6.4 | 8.3 | 7.0 | 5.0 | 4.7 | 6.9 | 6.4 | 6.4 | 7.4 | 81.3 |
| Average snowy days (≥ 0.1 in) | 0.0 | 0.3 | 0.0 | 0.0 | 0.0 | 0.0 | 0.0 | 0.0 | 0.0 | 0.0 | 0.0 | 0.0 | 0.3 |
| Average relative humidity (%) | 67.1 | 65.2 | 63.2 | 66.3 | 70.5 | 68.8 | 65.0 | 64.7 | 68.0 | 67.2 | 68.3 | 68.0 | 66.9 |
| Average dew point °F (°C) | 37.0 (2.8) |
39.9 (4.4) |
46.8 (8.2) |
55.6 (13.1) |
63.7 (17.6) |
68.4 (20.2) |
68.9 (20.5) |
68.5 (20.3) |
65.7 (18.7) |
57.0 (13.9) |
48.0 (8.9) |
40.1 (4.5) |
55.0 (12.8) |
| Mean monthly sunshine hours | 159.4 | 169.7 | 215.5 | 209.7 | 221.8 | 275.9 | 308.8 | 293.9 | 234.9 | 218.0 | 171.9 | 149.7 | 2,629.2 |
| Percent possible sunshine | 49 | 54 | 58 | 54 | 52 | 66 | 72 | 72 | 63 | 61 | 54 | 47 | 59 |
| Source: NOAA (relative humidity, dew point and sun 1961–1990)[3][4][5] | |||||||||||||
| Climate data for Corpus Christi, Texas | |||||||||||||
|---|---|---|---|---|---|---|---|---|---|---|---|---|---|
| Month | Jan | Feb | Mar | Apr | May | Jun | Jul | Aug | Sep | Oct | Nov | Dec | Year |
| Record high °F (°C) | 94 (34) |
97 (36) |
102 (39) |
102 (39) |
103 (39) |
106 (41) |
105 (41) |
104 (40) |
109 (43) |
98 (37) |
98 (37) |
91 (33) |
109 (43) |
| Mean daily maximum °F (°C) | 66.0 (18.9) |
69.7 (20.9) |
75.8 (24.3) |
80.7 (27.1) |
85.6 (29.8) |
90.2 (32.3) |
93.2 (34.0) |
93.4 (34.1) |
89.9 (32.2) |
83.6 (28.7) |
74.9 (23.8) |
68.0 (20.0) |
81.4 (27.4) |
| Mean daily minimum °F (°C) | 46.2 (7.9) |
49.3 (9.6) |
56.2 (13.4) |
62.3 (16.8) |
69.5 (20.8) |
73.5 (23.1) |
74.4 (23.6) |
74.5 (23.6) |
71.6 (22.0) |
64.0 (17.8) |
55.4 (13.0) |
48.1 (8.9) |
62.5 (16.9) |
| Record low °F (°C) | 14 (−10) |
11 (−12) |
24 (−4.4) |
33 (1) |
44 (7) |
56 (13) |
64 (18) |
64 (18) |
52 (11) |
28 (−2.2) |
28 (−2.2) |
13 (−11) |
11 (−12) |
| Average rainfall inches (mm) | 1.62 (41) |
1.84 (47) |
1.74 (44) |
2.05 (52) |
3.48 (88) |
3.53 (90) |
2.00 (51) |
3.54 (90) |
5.03 (128) |
3.94 (100) |
1.74 (44) |
1.75 (44) |
32.26 (819) |
| Average rainy days (≥ 0.01 in) | 7.7 | 6.3 | 5.1 | 5.2 | 6.6 | 6.7 | 4.7 | 6.9 | 9.0 | 6.7 | 6.3 | 6.6 | 78.0 |
| Mean monthly sunshine hours | 139.5 | 158.2 | 198.4 | 207.0 | 235.6 | 291.0 | 328.6 | 300.7 | 243.0 | 232.5 | 171.0 | 136.4 | 2,641.9 |
| Source 1: NWS (normals 1971−2000, extremes 1887−present) [6] | |||||||||||||
| Source 2: HKO (sun, 1961−1990) [7] | |||||||||||||
| Climate data for Laredo, TX | |||||||||||||
|---|---|---|---|---|---|---|---|---|---|---|---|---|---|
| Month | Jan | Feb | Mar | Apr | May | Jun | Jul | Aug | Sep | Oct | Nov | Dec | Year |
| Record high °F (°C) | 95 (35) |
103 (39) |
105 (41) |
110 (43) |
114 (46) |
114 (46) |
113 (45) |
111 (44) |
110 (43) |
104 (40) |
97 (36) |
95 (35) |
114 (46) |
| Mean daily maximum °F (°C) | 68 (20) |
73 (23) |
82 (28) |
89 (32) |
95 (35) |
100 (38) |
102 (39) |
101 (38) |
95 (35) |
87 (31) |
77 (25) |
69 (21) |
87 (31) |
| Mean daily minimum °F (°C) | 44 (7) |
48 (9) |
56 (13) |
63 (17) |
70 (21) |
74 (23) |
75 (24) |
75 (24) |
71 (22) |
63 (17) |
53 (12) |
45 (7) |
61 (16) |
| Record low °F (°C) | 19 (−7) |
20 (−7) |
27 (−3) |
32 (0) |
45 (7) |
58 (14) |
66 (19) |
61 (16) |
49 (9) |
28 (−2) |
27 (−3) |
11 (−12) |
11 (−12) |
| Average precipitation inches (mm) | 0.76 (19) |
0.94 (24) |
0.92 (23) |
1.55 (39) |
2.73 (69) |
2.99 (76) |
1.79 (45) |
2.42 (61) |
2.73 (69) |
2.72 (69) |
1.13 (29) |
0.85 (22) |
21.53 (547) |
| Source: [8] | |||||||||||||
| Climate data for Brownsville, Texas | |||||||||||||
|---|---|---|---|---|---|---|---|---|---|---|---|---|---|
| Month | Jan | Feb | Mar | Apr | May | Jun | Jul | Aug | Sep | Oct | Nov | Dec | Year |
| Record high °F (°C) | 91 (33) |
94 (34) |
106 (41) |
102 (39) |
102 (39) |
103 (39) |
103 (39) |
104 (40) |
105 (41) |
99 (37) |
98 (37) |
94 (34) |
106 (41) |
| Mean daily maximum °F (°C) | 70.7 (21.5) |
73.9 (23.3) |
79.0 (26.1) |
83.9 (28.8) |
88.6 (31.4) |
92.3 (33.5) |
93.7 (34.3) |
94.5 (34.7) |
90.6 (32.6) |
85.7 (29.8) |
79.2 (26.2) |
72.0 (22.2) |
83.7 (28.7) |
| Mean daily minimum °F (°C) | 51.6 (10.9) |
54.7 (12.6) |
59.6 (15.3) |
65.9 (18.8) |
72.3 (22.4) |
75.7 (24.3) |
76.3 (24.6) |
76.2 (24.6) |
73.1 (22.8) |
66.9 (19.4) |
59.6 (15.3) |
52.7 (11.5) |
65.4 (18.6) |
| Record low °F (°C) | 18 (−8) |
12 (−11) |
28 (−2) |
37 (3) |
41 (5) |
56 (13) |
57 (14) |
63 (17) |
51 (11) |
35 (2) |
27 (−3) |
16 (−9) |
12 (−11) |
| Average rainfall inches (mm) | 1.27 (32) |
1.07 (27) |
1.23 (31) |
1.53 (39) |
2.64 (67) |
2.56 (65) |
2.04 (52) |
2.44 (62) |
5.92 (150) |
3.74 (95) |
1.81 (46) |
1.15 (29) |
27.41 (696) |
| Average rainy days (≥ 0.01 in) | 7.7 | 5.4 | 4.2 | 4.0 | 5.0 | 6.6 | 5.0 | 7.2 | 9.3 | 7.3 | 5.9 | 7.2 | 74.8 |
| Mean monthly sunshine hours | 130.2 | 152.6 | 207.7 | 234.0 | 266.6 | 306.0 | 334.8 | 306.9 | 252.0 | 229.4 | 165.0 | 130.2 | 2,715.4 |
| Source 1: National Weather Service (normals 1981−2010) [9] | |||||||||||||
| Source 2: Hong Kong Observatory (sun, 1961−1990) [7] | |||||||||||||
| Climate data for Victoria, Texas | |||||||||||||
|---|---|---|---|---|---|---|---|---|---|---|---|---|---|
| Month | Jan | Feb | Mar | Apr | May | Jun | Jul | Aug | Sep | Oct | Nov | Dec | Year |
| Record high °C | 88 | 96 | 99 | 100 | 102 | 107 | 110 | 109 | 111 | 109 | 93 | 88 | 111 |
| Mean daily maximum °C | 62.8 | 66.6 | 73.4 | 79.2 | 85.1 | 90.3 | 93.4 | 93.7 | 89.9 | 83.0 | 73.0 | 65.2 | 79.6 |
| Mean daily minimum °C | 43.6 | 46.7 | 53.9 | 60.1 | 68.1 | 73.3 | 75.0 | 74.6 | 70.3 | 61.6 | 52.3 | 45.2 | 60.4 |
| Record low °C | 9 | 15 | 21 | 33 | 40 | 54 | 61 | 61 | 45 | 31 | 18 | 9 | 9 |
| Average precipitation mm | 2.44 | 2.04 | 2.25 | 2.97 | 5.12 | 4.96 | 2.90 | 3.05 | 5.00 | 4.26 | 2.64 | 2.47 | 40.1 |
| Record high °F | 31 | 36 | 37 | 38 | 39 | 42 | 43 | 43 | 44 | 43 | 34 | 31 | 44 |
| Mean daily maximum °F | 17.1 | 19.2 | 23.0 | 26.2 | 29.5 | 32.4 | 34.1 | 34.3 | 32.2 | 28.3 | 22.8 | 18.4 | 26.5 |
| Mean daily minimum °F | 6.4 | 8.2 | 12.2 | 15.6 | 20.1 | 22.9 | 23.9 | 23.7 | 21.3 | 16.4 | 11.3 | 7.3 | 15.8 |
| Record low °F | −13 | −9 | −6 | 1 | 4 | 12 | 16 | 16 | 7 | −1 | −8 | −13 | −13 |
| Average precipitation inches | 62 | 52 | 57 | 75 | 130 | 126 | 74 | 77 | 127 | 108 | 67 | 63 | 1,018 |
| Source: National Weather Service[10] | |||||||||||||
Hurricanes are one of the most dangerous weather systems to effect South Texas. Hurricanes season is between the summer months of June threw November However, the Texas coast gets affected usually between August and September when systems sporadically organize in the southern Gulf around the Bay of Campeche or western Caribbean and the latter months forming off the coast of Africa.
Droughts- Although South Texas summers generally see rainfall in summer months there are some years where lack of rain is persistent and leads to water shortages, lake levels to drop significantly and lead to municipal water restrictions. In the summer of 2011 records numerous records were shattered. On Sunday, August 28, 2011 most of South Texas saw temperatures reach 110° breaking many cities record highs. Furthermore 95 percent of the state faced an extreme or exceptional drought, according to the office of the Texas state climatologist. These drought conditions led to a string of dangerous wildfires across the state and the enforcement of burn bans in 250 out of the 254 counties in Texas
Tornadoes do occur in this part of the state but not as frequently as other parts of the state. They approach usually from the northwest to southeast as a line of severe thunderstorms mostly in the summer months and by cold fronts in fall
Snow rarely falls south of San Antonio or on the coast except in rare circumstances. Of note is the 2004 Christmas Eve Snowstorm, when 6 inches (150 mm) of snow fell as far south as McAllen.
People
Multicultural influences
South Texas is well-known for a strong Hispanic, primarily Mexican American and Tejano (the Spanish term for Texan) influence, due to its proximity to Mexico. Many Tejanos and Mexicans living in South Texas are descended from the Spanish and Sephardic Jewish-Converso settlers of Mexico. These families have resided in North America for hundreds of years. This migration occurred and has been ongoing since the late 16th century in New Mexico and the early 18th century in South Texas. The Treaty of Guadalupe Hidalgo in the 1840s, failed to secure land belonging to the Hispanic settlers. The disputed area was between the Nueces River south of San Antonio and Corpus Christi, the King Ranch, and the Rio Grande River. Not recognized by Mexico nor the United States, The Republic of the Rio Grande was established in this region in 1840, lasting less than a year. Laredo, Texas served as its capital.
The Rio Grande Valley area played a significant role in the Mexican War of Independence, Civil War, Texas Independence, Mexican-American War with many historical battle sites around the area. General Robert E. Lee made residence in Fort Ringold (Rio Grande City) during this time as a Colonel. President Zachary Taylor was a General of the Army at Fort Brown (Brownsville) during the Mexican-American War.
The Texas Rangers gained popularity for their actions in South Texas during the Mexican bandit raids and the late 19th century and early 20th century. On May 25, 1876, a band of forty Texas Rangers rode out of Laredo and headed north to the infamous Nueces Strip. Their mission was to find, kill or capture John King Fisher, leader of a band of cattle rustlers and cut-throats that had been terrorizing the area. The Rangers were members of a select group known as the Special Force. Led by the legendary Leander McNelly, the Special Force was tasked with bringing law and order to an area of South Texas that lay between Corpus Christi and the Mexican border.
Industry
Rice

An important event in the development of South Texas and the Texas Gulf Coast rice industry was the introduction of seed imported from Japan in 1904. The Houston Chamber of Commerce and the Southern Pacific Railroad invited Japanese farmers to Texas to help area farm in the production of rice. The seed the Japanese farmers brought with them was a gift from the Japanese emperor. The production of Japanese rice began at Webster in Harris County. The Gulf Coast rice industry is credited to the Saibara family.[11].
Transportation
Air Travel
- San Antonio International Airport
- Corpus Christi International Airport
- Laredo International Airport
- Valley International Airport
- Victoria Regional Airport
- McAllen-Miller International Airport
- Brownsville/South Padre Island International Airport
- Alice International Airport
- South Texas International Airport at Edinburg
- Aransas County Airport[12]
- Kleberg County Airport
- Duval-Freer Airport
- Mustang Beach Airport
- San Jose Island Airport
Major Highways
Interstate Highways
United States Routes
Texas State Highways
 Texas Highway 4
 Texas Highway 16
 Texas Highway 44
 Texas Highway 107
 Texas Highway 255
 Texas Highway 336
 Texas Highway 359
 Texas Highway 361
 Texas Highway 495
 Texas Highway 141
 Texas Highway 290
International Bridges
Laredo
- Gateway to the Americas International Bridge
- Juarez-Lincoln International Bridge
- Texas-Mexican Railway International Bridge
- World Trade International Bridge
- Colombia-Solidarity International Bridge
Eagle Pass
- Eagle Pass-Piedras Negras International Bridge
- Camino Real International Bridge
- Union Pacific International Railroad Bridge
Brownsville
- Brownsville & Matamoros International Bridge
- Veteran's International Bridge
- Gateway International Bridge
Los Indios
Falcon Heights
Hidalgo McAllen
Pharr
Progreso
Rio Grande City
Roma
Tourism
San Antonio
- The Alamo
- SeaWorld San Antonio
- Six Flags Fiesta Texas
- San Antonio River Walk
- San Antonio Zoo
- San Antonio Museum of Art
- San Antonio Stock Show & Rodeo
Corpus Christi
- Mirador de la Flor (Selena Memorial Statue)
- Texas State Aquarium
- USS Lexington Museum Ship
- Mustang Island & Mustang Island State Park
- Padre Island National Seashore near Corpus Christi
- Bayfest
Laredo
- San Agustin de Laredo Historic District
- Republic of the Rio Grande Capitol Building Museum
- Washington's Birthday Celebration festivities during January and February
Rio Grande Valley
- South Padre Island on Gulf Coast east of Brownsville
- Gladys Porter Zoo in Brownsville
Other
- King Ranch near Kingsville
- Aransas National Wildlife Refuge
-

-
-

-

-
-
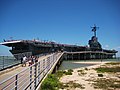 USS Lexington floating museum in Corpus Christi
 -
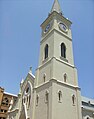 San Agustin Cathedral in Laredo's San Agustin de Laredo Historic District
 -
 Republic of the Rio Grande Capitol building is located in Laredo


Education
Colleges
- Alamo Community College District
- Coastal Bend College
- Del Mar College
- Laredo Community College
- South Texas College
- Texas State Technical College
Universities
Public universities
- Texas A&M International University (Laredo)
- Texas A&M University–Corpus Christi
- Texas A&M University–Kingsville (Texas A&I)
- Texas A&M University-San Antonio
- University of Houston–Victoria
- University of Texas at Brownsville
- University of Texas–Pan American
- University of Texas Health Science Center at San Antonio
- University of Texas at San Antonio
Private universities
- Our Lady of the Lake University
- St. Mary's University
- University of the Incarnate Word
- Trinity University
- Wayland Baptist University
Sports
The only major professional sports team in South Texas is the San Antonio Spurs in the NBA.
Area codes
- 210 - San Antonio
- 361 - Corpus Christi, Alice, Victoria, Kingsville, Rockport
- 956 - Laredo, Brownsville, McAllen
- 830 - Eagle Pass, San Antonio
- 979 - only the southern half of this area is in South Texas
See also
References
- ^ Census Fact Finder
- ^ [1]
- ^ "NowData − NOAA Online Weather Data". National Oceanic and Atmospheric Administration. Retrieved 2021-05-31.
- ^ "Station Name: TX SAN ANTONIO INTL AP". U.S. Climate Normals 2020: U.S. Monthly Climate Normals (1991−2020). National Oceanic & Atmospheric Administration. Archived from the original on 2023-12-25. Retrieved 2021-05-31.
- ^ "WMO Climate Normals for SAN ANTONIO/INTL, TX 1961–1990". National Oceanic and Atmospheric Administration. Archived from the original on 2023-12-25. Retrieved 2020-07-19.
- ^ "National Weather Service Corpus Christi". Weather.gov. 2006-07-21. Retrieved 2010-05-22.
- ^ a b "Climatological Information for Corpus Christi, United States". Hong Kong Observatory. Retrieved 2011-01-24. Cite error: The named reference "HKO" was defined multiple times with different content (see the help page).
- ^ "Average Weather for Laredo, TX – Temperature and Precipitation". Weather.com. June 2011. Retrieved May 7, 2009.
- ^ National Weather Service Brownsville
- ^ "National Weather Service Corpus Christi". Archived from the original on 2008-01-02. Retrieved 2008-06-29.
- ^ Henry C. Dethloff, "RICE CULTURE," Handbook of Texas Online (http://www.tshaonline.org/handbook/online/articles/afr01), accessed March 20, 2012. Published by the Texas State Historical Association.
- ^ Aransas County Airport Website Aransas Co Airport Call Sign: RKP(U.S), KRKP(International)
Cite error: There are <ref group=lower-alpha> tags or {{efn}} templates on this page, but the references will not show without a {{reflist|group=lower-alpha}} template or {{notelist}} template (see the help page).