
New Hope, Minnesota
New Hope | |
|---|---|
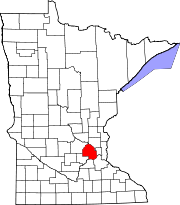
 Location of the city of New Hope within Hennepin County, Minnesota | |
| Coordinates: 45°2′N 93°23′W / 45.033°N 93.383°W | |
| Country | United States |
| State | Minnesota |
| County | Hennepin |
| Incorporated | 1936 |
| Government | |
| • Mayor | Kathi Hemken |
| Area | |
| • Total | 5.11 sq mi (13.25 km2) |
| • Land | 5.06 sq mi (13.10 km2) |
| • Water | 0.06 sq mi (0.15 km2) 1.18% |
| Elevation | 932 ft (284 m) |
| Population (2020) | |
| • Total | 21,986 |
| • Density | 4,347.64/sq mi (1,678.64/km2) |
| Time zone | UTC-6 (Central) |
| • Summer (DST) | UTC-5 (Central) |
| ZIP codes | 55427, 55428 |
| Area code | 763 |
| FIPS code | 27-45628[2] |
| GNIS feature ID | 0648510[3] |
| Website | City of New Hope |
New Hope is a city in Hennepin County, Minnesota, United States and a suburb of Minneapolis. The population was 21,986 at the 2020 census.[4]
History[edit]
New Hope was originally a farming community called Hope in Crystal Lake Township. In 1936, rural residents of the township broke away and formed their own township, choosing the name New Hope.[5]
Geography[edit]
According to the United States Census Bureau, the city has an area of 5.10 square miles (13.21 km2), of which 5.04 square miles (13.05 km2) is land and 0.06 square miles (0.16 km2) is water.[6] It is 12 miles northwest of downtown Minneapolis.
Climate[edit]
According to the Köppen Climate Classification system, New Hope has a hot-summer humid continental climate, abbreviated "Dfa" on climate maps. The hottest temperature recorded in New Hope was 102 °F (38.9 °C) on July 3, 1990, while the coldest temperature recorded was −33 °F (−36.1 °C) on February 2, 1996.[7]
| Climate data for New Hope, Minnesota, 1991–2020 normals, extremes 1990–present | |||||||||||||
|---|---|---|---|---|---|---|---|---|---|---|---|---|---|
| Month | Jan | Feb | Mar | Apr | May | Jun | Jul | Aug | Sep | Oct | Nov | Dec | Year |
| Record high °F (°C) | 55 (13) |
62 (17) |
81 (27) |
91 (33) |
98 (37) |
100 (38) |
102 (39) |
99 (37) |
98 (37) |
88 (31) |
76 (24) |
67 (19) |
102 (39) |
| Mean maximum °F (°C) | 43.0 (6.1) |
47.2 (8.4) |
64.4 (18.0) |
79.4 (26.3) |
87.9 (31.1) |
92.2 (33.4) |
93.0 (33.9) |
90.2 (32.3) |
86.8 (30.4) |
78.9 (26.1) |
62.0 (16.7) |
46.0 (7.8) |
95.0 (35.0) |
| Mean daily maximum °F (°C) | 23.6 (−4.7) |
28.8 (−1.8) |
41.9 (5.5) |
56.7 (13.7) |
69.0 (20.6) |
78.2 (25.7) |
82.3 (27.9) |
79.7 (26.5) |
71.8 (22.1) |
57.4 (14.1) |
41.4 (5.2) |
28.5 (−1.9) |
54.9 (12.7) |
| Daily mean °F (°C) | 15.3 (−9.3) |
19.8 (−6.8) |
32.4 (0.2) |
45.9 (7.7) |
58.4 (14.7) |
68.2 (20.1) |
72.7 (22.6) |
70.3 (21.3) |
62.1 (16.7) |
48.2 (9.0) |
33.6 (0.9) |
21.0 (−6.1) |
45.7 (7.6) |
| Mean daily minimum °F (°C) | 7.0 (−13.9) |
10.8 (−11.8) |
22.8 (−5.1) |
35.2 (1.8) |
47.7 (8.7) |
58.1 (14.5) |
63.1 (17.3) |
60.8 (16.0) |
52.4 (11.3) |
39.0 (3.9) |
25.8 (−3.4) |
13.6 (−10.2) |
36.4 (2.4) |
| Mean minimum °F (°C) | −15.8 (−26.6) |
−10.2 (−23.4) |
0.3 (−17.6) |
19.2 (−7.1) |
33.8 (1.0) |
45.0 (7.2) |
52.4 (11.3) |
50.4 (10.2) |
36.3 (2.4) |
23.9 (−4.5) |
8.4 (−13.1) |
−8.9 (−22.7) |
−18.2 (−27.9) |
| Record low °F (°C) | −30 (−34) |
−33 (−36) |
−18 (−28) |
4 (−16) |
26 (−3) |
38 (3) |
47 (8) |
39 (4) |
30 (−1) |
13 (−11) |
−6 (−21) |
−22 (−30) |
−33 (−36) |
| Average precipitation inches (mm) | 0.95 (24) |
1.02 (26) |
1.88 (48) |
3.31 (84) |
4.49 (114) |
4.64 (118) |
4.51 (115) |
4.18 (106) |
3.45 (88) |
2.98 (76) |
1.87 (47) |
1.40 (36) |
34.68 (882) |
| Average snowfall inches (cm) | 10.1 (26) |
10.1 (26) |
9.0 (23) |
5.1 (13) |
0.0 (0.0) |
0.0 (0.0) |
0.0 (0.0) |
0.0 (0.0) |
0.0 (0.0) |
0.8 (2.0) |
6.9 (18) |
12.3 (31) |
54.3 (139) |
| Average precipitation days (≥ 0.01 in) | 9.9 | 7.5 | 9.0 | 11.4 | 12.9 | 12.1 | 10.6 | 9.2 | 9.5 | 10.0 | 8.1 | 10.4 | 120.6 |
| Average snowy days (≥ 0.1 in) | 9.8 | 7.5 | 5.5 | 2.9 | 0.0 | 0.0 | 0.0 | 0.0 | 0.0 | 0.8 | 4.7 | 9.7 | 40.9 |
| Source 1: NOAA[8] | |||||||||||||
| Source 2: National Weather Service[7] | |||||||||||||
Demographics[edit]
| Census | Pop. | Note | %± |
|---|---|---|---|
| 1940 | 394 | — | |
| 1950 | 691 | 75.4% | |
| 1960 | 3,552 | 414.0% | |
| 1970 | 23,180 | 552.6% | |
| 1980 | 23,087 | −0.4% | |
| 1990 | 21,853 | −5.3% | |
| 2000 | 20,873 | −4.5% | |
| 2010 | 20,339 | −2.6% | |
| 2020 | 21,986 | 8.1% | |
| U.S. Decennial Census[9] 2018 Estimate[10] | |||
2010 census[edit]
As of the census[11] of 2010, there were 20,339 people, 8,427 households, and 5,032 families living in the city. The population density was 4,035.5 inhabitants per square mile (1,558.1/km2). There were 9,051 housing units at an average density of 1,795.8 per square mile (693.4/km2). The racial makeup of the city was 74.5% White, 14.7% African American, 0.4% Native American, 3.8% Asian, 2.9% from other races, and 3.6% from two or more races. Hispanic or Latino of any race were 6.5% of the population.
There were 8,427 households, of which 28.4% had children under age 18 living with them, 43.1% were married couples living together, 12.6% had a female householder with no husband present, 4.0% had a male householder with no wife present, and 40.3% were non-families. 33.3% of all households were made up of individuals, and 13.1% had someone living alone who was 65 or older. The average household size was 2.31 and the average family size was 2.97.
The median age in the city was 39.4. 22% of residents were under 18; 7.3% were between 18 and 24; 27.8% were from 25 to 44; 24.4% were from 45 to 64; and 18.6% were 65 or older. The gender makeup of the city was 46.9% male and 53.1% female.
2000 census[edit]
As of the census[2] of 2000, there were 20,873 people, 8,665 households, and 5,268 families living in the city. The population density was 4,098.6 inhabitants per square mile (1,582.5/km2). There were 8,746 housing units at an average density of 1,717.4 per square mile (663.1/km2). The racial makeup of the city was 86.66% White, 5.78% African American, 0.46% Native American, 3.21% Asian, 0.04% Pacific Islander, 1.74% from other races, and 2.11% from two or more races. Hispanic or Latino of any race were 3.45% of the population.
There were 8,665 households, of which 27.2% had children under 18 living with them, 47.2% were married couples living together, 10.4% had a female householder with no husband present, and 39.2% were non-families. 32.3% of all households were made up of individuals, and 12.5% had someone living alone who was 65 or older. The average household size was 2.29 and the average family size was 2.91.
In the city, the population was spread out, with 21.3% under 18, 8.1% from 18 to 24, 30.2% from 25 to 44, 22.7% from 45 to 64, and 17.8% who were 65 or older. The median age was 38. For every 100 females, there were 86.6 males. For every 100 females 18 and over, there were 83.4 males.
The median income for a household was $46,795, and the median income for a family was $60,424. Males had a median income of $41,192 versus $29,454 for females. The per capita income was $23,562. About 4.1% of families and 6.5% of the population were below the poverty line, including 7.8% of those under 18 and 6.3% of those 65 or older.
Politics[edit]
| Year | Republican | Democratic | Third parties |
|---|---|---|---|
| 2020 | 30.1% 3,579 | 67.3% 8,006 | 2.6% 307 |
| 2016 | 31.8% 3,500 | 59.4% 6,542 | 8.8% 972 |
| 2012 | 37.9% 4,344 | 59.9% 6,873 | 2.2% 248 |
| 2008 | 39.6% 4,542 | 58.7% 6,740 | 1.7% 203 |
| 2004 | 42.8% 4,865 | 56.3% 6,397 | 0.9% 102 |
| 2000 | 40.3% 4,371 | 53.3% 5,777 | 6.4% 695 |
| 1996 | 33.6% 3,410 | 56.7% 5,757 | 9.7% 993 |
| 1992 | 33.2% 3,823 | 44.8% 5,165 | 22.0% 2,539 |
| 1988 | 47.0% 5,463 | 53.0% 6,163 | 0.0% 0 |
| 1984 | 52.3% 6,288 | 47.7% 5,730 | 0.0% 0 |
| 1980 | 41.6% 4,716 | 47.4% 5,371 | 11.0% 1,239 |
| 1976 | 46.9% 5,062 | 51.4% 5,547 | 1.7% 182 |
| 1972 | 57.9% 5,705 | 40.6% 3,999 | 1.5% 154 |
| 1968 | 41.5% 2,926 | 55.4% 3,908 | 3.1% 224 |
| 1964 | 36.7% 1,378 | 63.1% 2,371 | 0.2% 9 |
| 1960 | 44.8% 632 | 55.0% 776 | 0.2% 2 |
Education[edit]
New Hope is in the Robbinsdale Area school district. Schools in New Hope include Robbinsdale Cooper High School, Meadow Lake Elementary, Robbinsdale Spanish Immersion, Sonnesyn Elementary, and Holy Trinity Lutheran School, a Christian Pre-K-8 grade school of the Wisconsin Evangelical Lutheran Synod (WELS).[13]
Notable people[edit]
- Leo G. Adams - Minnesota state legislator
- Curt Hennig - professional wrestler, entombed at Gethsemane Cemetery.
- Dorothy Hokr - Minnesota state legislator.
- Tim Vakoc – first United States military chaplain to be critically injured during Operation Iraqi Freedom, died in New Hope.
- Rashad Vaughn - NBA player for Milwaukee Bucks
- Mark Thompson - Minnesota state legislator
- Mariana Cress - athlete in the 2016 Rio Olympics
- Lance Pitlick - NHL player for Ottawa Senators and Florida Panthers
- Steve Zahn - American actor and comedian
References[edit]
- ^ "2020 U.S. Gazetteer Files". United States Census Bureau. Retrieved July 24, 2022.
- ^ a b "U.S. Census website". United States Census Bureau. Retrieved January 31, 2008.
- ^ "US Board on Geographic Names". United States Geological Survey. October 25, 2007. Retrieved January 31, 2008.
- ^ "U.S. Census Bureau QuickFacts: New Hope city, Minnesota". Retrieved January 24, 2023.
- ^ "City of New Hope". Retrieved July 28, 2022.
- ^ "US Gazetteer files 2010". United States Census Bureau. Archived from the original on January 25, 2012. Retrieved November 13, 2012.
- ^ a b "NOAA Online Weather Data – NWS Minneapolis". National Weather Service. Retrieved March 8, 2023.
- ^ "U.S. Climate Normals Quick Access – Station: New Hope, MN". National Oceanic and Atmospheric Administration. Retrieved March 8, 2023.
- ^ United States Census Bureau. "Census of Population and Housing". Retrieved October 28, 2014.
- ^ "Population Estimates". United States Census Bureau. Retrieved June 8, 2018.
- ^ "U.S. Census website". United States Census Bureau. Retrieved November 13, 2012.
- ^ "Office of the Minnesota Secretary of State - Election Results". Archived from the original on February 22, 2021. Retrieved February 22, 2021.
- ^ "Sharing Jesus Christ with All Ages and Nations".
External links[edit]
Municipalities and communities of Hennepin County, Minnesota, United States | ||
|---|---|---|
| Cities |
|  |
| Unincorporated area | ||
| Footnotes | ‡This populated place also has portions in an adjacent county or counties | |
45°2′N 93°23′W / 45.033°N 93.383°W
| International | |
|---|---|
| National | |
| Geographic | |