From Wikipedia, the free encyclopedia
United States presidential election in Maryland, 2016
Clinton—40-50%
Clinton—50-60%
Clinton—70-80%
Clinton—80-90%
Trump—40-50%
Trump—50-60%
Trump—60-70%
Trump—70-80%
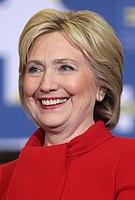
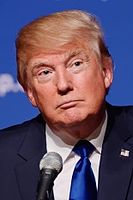
The 2016 United States presidential election in Maryland was held on November 8, 2016, as part of the 2016 General Election in which all 50 states plus The District of Columbia participated. Maryland voters chose electors to represent them in the Electoral College via a popular vote pitting the Republican Party 's nominee, businessman Donald Trump , and running mate Indiana Governor Mike Pence against Democratic Party nominee, former Secretary of State Hillary Clinton and her running mate, Virginia Senator Tim Kaine .
On April 26, 2016,[ 1] presidential primaries , Maryland voters expressed their preferences for the Democratic , and Republican parties' respective nominees for President. Registered members of each party only voted in their party's primary, while voters who were unaffiliated only voted in nonpartisan primary elections (e.g. School Board).[ 2]
Hillary Clinton won Maryland with 60.5% of the vote. Donald Trump received 35.3% of the vote.[ 3] [ 4]
Primary Elections
Democratic primary
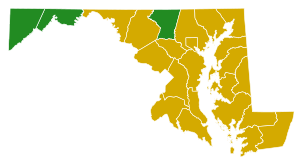
Election results by county. Hillary Clinton
Bernie Sanders
Maryland Democratic primary, April 26, 2016
Candidate
Popular vote
Estimated delegates
Count
Percentage
Pledged
Unpledged
Total
Hillary Clinton
573,242
62.53%
60
17
77
Bernie Sanders
309,990
33.81%
35
1
36
Rocky De La Fuente
3,582
0.39%
—
Uncommitted
29,949
3.27%
0
6
6
Total
916,763
100%
95
24
119
Source: The Green Papers Maryland State Board of Elections - Official Primary Results MDP Announces DNC Delegates, Alternates and State DNC Members MDP Announces District-Level Delegate Winners
Republican primary
Election results by county. Donald Trump
Maryland Republican primary, April 26, 2016
Candidate
Votes
Percentage
Actual delegate count
Bound
Unbound
Total
Donald Trump
248,343
54.10%
38
0
38
John Kasich
106,614
23.22%
0
0
0
Ted Cruz
87,093
18.97%
0
0
0
Ben Carson (withdrawn)
5,946
1.30%
0
0
0
Marco Rubio (withdrawn)
3,201
0.70%
0
0
0
Jeb Bush (withdrawn)
2,770
0.60%
0
0
0
Rand Paul (withdrawn)
1,533
0.33%
0
0
0
Chris Christie (withdrawn)
1,239
0.27%
0
0
0
Carly Fiorina (withdrawn)
1,012
0.22%
0
0
0
Mike Huckabee (withdrawn)
837
0.18%
0
0
0
Rick Santorum (withdrawn)
478
0.10%
0
0
0
Unprojected delegates:
0
0
0
Total:
459,066
100.00%
38
0
38
Source: The Green Papers
By county
County
Trump
Votes
Clinton
Votes
Others
Votes
Totals
Allegany 69.40
21,270
25.70
7,875
4.90
1,509
30,654
Anne Arundel 45.78
118,636
47.22
122,385
7.00
18,135
259,156
Baltimore (City) 10.70
24,225
84.44
190,981
4.86
10,955
226,161
Baltimore (County) 38.62
146,469
55.58
210,771
5.80
22,013
379,253
Calvert 55.22
26,176
38.44
18,225
6.34
3,006
47,407
Caroline 66.95
9,368
28.65
4,009
4.40
615
13,992
Carroll 64.57
57,385
28.97
25,749
6.46
5,737
88,871
Cecil 62.56
28,866
29.58
13,650
7.86
3,626
46,142
Charles 32.90
25,529
63.20
49,035
3.90
2,984
77,548
Dorchester 53.30
8,413
39.55
6,245
7.15
1,132
15,790
Frederick 47.54
58,502
44.78
55,109
7.68
9,444
123,055
Garrett 76.91
10,775
18.32
2,566
4.77
668
14,009
Harford 58.42
77,443
35.12
46,553
6.46
8,574
132,570
Howard 29.28
47,484
63.26
102,597
7.46
12,112
162,193
Kent 48.66
4,876
45.66
4,575
5.68
570
10,021
Montgomery 19.70
87,337
74.51
330,366
5.79
25,668
443,371
Prince George's 8.42
30,998
88.17
324,411
3.41
12,513
367,922
Queen Anne's 64.07
16,993
30.60
7,973
5.33
1,557
26,523
Somerset 57.59
28,482
35.14
17,381
7.27
3,597
49,460
St. Mary's 53.98
5,341
42.41
4,196
3.61
357
9,894
Talbot 52.68
10,487
41.67
8,294
5.65
1,125
19,906
Washington 62.13
40,998
32.02
21,129
5.85
3,864
65,991
Wicomico 52.40
21,994
42.20
17,727
5.40
2,256
41,977
Worcester 61.25
16,890
34.21
9,435
4.54
1,252
27,577
Polling
See also
References
External links
Election timelines National opinion polling State opinion polling Fundraising Debates and forums Straw polls Major events Caucuses primaries
Results breakdown National
Reforms


