1984 European Parliament election
| |||||||||||||||||||||||||||||||||||||||||||||||||||||||||||||||||||||||||||||||||||||
All 434 seats to the European Parliament 218 seats needed for a majority | |||||||||||||||||||||||||||||||||||||||||||||||||||||||||||||||||||||||||||||||||||||
|---|---|---|---|---|---|---|---|---|---|---|---|---|---|---|---|---|---|---|---|---|---|---|---|---|---|---|---|---|---|---|---|---|---|---|---|---|---|---|---|---|---|---|---|---|---|---|---|---|---|---|---|---|---|---|---|---|---|---|---|---|---|---|---|---|---|---|---|---|---|---|---|---|---|---|---|---|---|---|---|---|---|---|---|---|---|
| Turnout | 61% | ||||||||||||||||||||||||||||||||||||||||||||||||||||||||||||||||||||||||||||||||||||
| |||||||||||||||||||||||||||||||||||||||||||||||||||||||||||||||||||||||||||||||||||||
 * The number of seats was increased from 410 to 434 – so this is a nominal figure | |||||||||||||||||||||||||||||||||||||||||||||||||||||||||||||||||||||||||||||||||||||
| |||||||||||||||||||||||||||||||||||||||||||||||||||||||||||||||||||||||||||||||||||||
| This article is part of a series on |
 |
|---|
|
|
The 1984 election to the European Parliament was the first since the inaugural election of 1979 and the 1981 enlargement of the European Community to include Greece. It was also the last before the accession of Spain and Portugal in 1986.
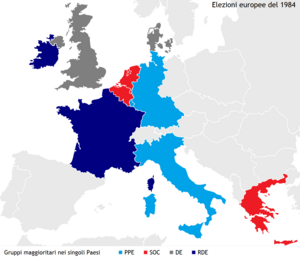
Results showed centre-left and right wing MEPs profiting at the expense of the far-left and centre-right. The Socialists consolidated their position as the biggest group in the Parliament and there were notable changes for the smaller groups, with far-right MEPs forming a group and the coalescence of the Green and Regionalist group known as "Rainbow". Overall turnout dropped to 61%. No majority was achieved.
Pre-election
Seat changes
| ||||||||||||||||||||||||||||||
The number of seats was the same as before for each member state that took part in the 1979 election. Greece, which had joined in 1981, was allocated 24 new seats. This raised the number of seats to 434 from 410.
Campaign
This section needs expansion. You can help by adding to it. (June 2008) |
Election and regrouping
Overview
The Socialists increased their share by six seats to 130 seats, up from 124 before the elections. The Democratic Alliance (formerly Progressive Democrats) also made gains, up by seven to 29 seats. The People's Party's, the European Democrats, Communists and Liberals all lost seats. The French National Front and the Italian Social Movement founded a group called the "European Right": the first far-right group in the Parliament. The Technical Group of Independents was replaced by the Rainbow Group, a mixture of Greens and Regionalists.
Final results
Statistics
Template:European Parliament election, 1984 - Statistics Template:European Parliament election, 1984 - Timeline Template:European Parliament election, 1984 - Delegation at 23 July 1984
Post-election
This section needs expansion. You can help by adding to it. (June 2008) |
External links
- The election of the Members of the European Parliament European Navigator
- Full Election Details Elections Online (In French)
Template:European Parliament constituencies 1984-1989


