
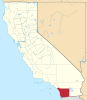
San Diego County, California
County of San Diego | |
|---|---|
 Location in the state of California | |
 California's location in the United States | |
| Country | United States |
| State | California |
| metropolitan area | San Diego metropolitan area |
| municipal corporation | 1850 |
| county seat | San Diego |
| largest city | San Diego |
| Area | |
| • Total | 4,525.52 sq mi (11,721.0 km2) |
| • Land | 4,199.89 sq mi (10,877.7 km2) |
| • Water | 325.62 sq mi (843.4 km2) |
| Population (2010 Census) | 3,095,313 |
| • Density | 737/sq mi (285/km2) |
| Time zone | UTC-8 (Pacific Standard Time) |
| • Summer (DST) | UTC-7 (Pacific Daylight Time) |
| Website | sdcounty.ca.gov |
San Diego County is a county located in the southwestern corner of the U.S. state of California. Hence, San Diego County is also located in the southwestern corner of the 48 contiguous United States. Both the county seat and largest city of San Diego County is the city of San Diego. The population of San Diego County was about 2,813,835 in the 2000 U.S. Census. In July 2008, an estimate by the U.S. Census Bureau set its population at about 3,001,000 people, making San Diego County the third-most-populous county in California, just behind its northern neighbors Orange County and Los Angeles County.[1] Its population in 2009 was estimated at 3,208,466,[2] making it the fifth most-populous county in the United States and giving it a population greater than 20 of the 50 U.S. states.
San Diego County has 70 miles (110 km) of coastline.It has a mild Mediterranean to semi-arid climate.[3] Also in this county are 16 significant naval and military locations of the United States Navy, U.S. Marine Corps and the U.S. Coast Guard, including Naval Base San Diego, Marine Corps Base Camp Pendleton, Marine Corps Air Station Miramar, and Naval Air Station North Island.
San Diego County defines the metropolitan statistical area of San Diego-Carlsbad-San Marcos, and in its metropolitan capacity is also known as Greater San Diego. In addition, San Diego County is part of the San Diego–Tijuana metropolitan area, an area with above five million people and the largest bi-national metropolitan area shared between the United States and Mexico. San Diego County is categorized in the economic region "South Border" along with Imperial County for convenience which is the smallest but most economically diverse region in the state, though the two counties maintain weak relations and have little in common, aside from their border proximity.[4]
San Diego County extends south all the way to the Mexican border, which is also the northern border of the State of Baja California and the northern municipal limits of Tijuana Municipality. San Diego County is bordered by Orange County and Riverside County on its north, by Imperial County on its east, and the Pacific Ocean on its west and southwest.
History
The area which is now San Diego County has been inhabited for more than 10,000 years by Kumeyaay (also called Diegueño), Luiseño, Cupeño and Cahuilla Indians.[5]
European settlement in what is now San Diego County began with the founding of the Mission San Diego de Alcalá, by Spanish pioneers, in 1769. This county was part of Alta California under the Viceroyalty of New Spain until the Mexican revolution. From 1821 through 1848 this area was part of Mexico.
San Diego County became part of the United States as a result of the Treaty of Guadalupe Hidalgo in 1848, ending the U.S.-Mexican War. This treaty designated the new border as terminating at a point on the Pacific Ocean coast which would result in the border passing one Spanish league south of the southernmost portion of San Diego Bay, thus ensuring that the United States received all of this natural harbor.
San Diego County was one of the original counties of California, and it was created at the time of California statehood in 1850.[6] San Diego County was named for San Diego Bay, which had been rechristened in 1602 by Sebastián Vizcaíno in honor of the Franciscan St. Didacus of Alcalá, known in Spanish as San Diego de Alcalá de Henares, and whose name was borne by Vizcaíno's flagship.
As originally created in 1850 San Diego County was quite large, and it included all of southmost California that was south and east of Los Angeles County. As such it included major parts of what are now Inyo County and San Bernardino County, and all of Riverside County and Imperial County.[6]
During the later part of the 19th century, there were numerous changes in the boundaries of San Diego County, when various areas were sliced off to form the newer counties mentioned above. The most recent changes were the creation of Riverside County in 1893[7] and Imperial County in 1907.[8] Imperial County was the last new county to be established in California, and after this division, San Diego no longer extended from the Pacific Ocean to the Colorado River, and it no longer covered the entire border between California and Mexico.
Geography

*This map does not show neighborhoods of the city of San Diego that are considered to be part of North County, such as Del Mar Heights, Rancho Peñasquitos, and Rancho Bernardo)
*Some areas in white in this general region that are in white would be also considered part of North County, but only cities and unincorporated communities are colored on this map.


According to the 2000 census, the county has a total area of 4,525.52 square miles (11,721.0 km2), of which 4,199.89 square miles (10,877.7 km2) (or 92.80%) is land and 325.62 square miles (843.4 km2) (or 7.20%) is water.[9]
The county is bigger in area than the combined states of Rhode Island and Delaware.[10]
San Diego County has a varied topography. On its western side is 70 miles (110 km) of coastline.[11] Most of San Diego between the coast and the Laguna Mountains consists of hills, mesas, and small canyons. Snow-capped (in winter) mountains rise to the northeast, with the Sonoran Desert to the far east. Cleveland National Forest is spread across the central portion of the county, while the Anza-Borrego Desert State Park occupies most of the northeast.
North San Diego County is known as North County; the exact geographic definitions of "North County" vary, but it includes the northern suburbs and sometimes certain northern neighborhoods of the City of San Diego.
The eastern suburbs are collectively known as East County, though most still lie in the western third of the county. The southern suburbs and southern detached portion of the city of San Diego, extending to the Mexican border, are collectively referred to as South Bay. While the desert region in the north east of the county is known as Borrego.
Largest cities in San Diego County by population
Largest cities (2010 census population):
| City | Population |
|---|---|
| San Diego | 1,387,000
|
| Chula Vista | 244,000
|
| Oceanside | 182,000
|
| Escondido | 151,000
|
| Vista | 99,000
|
| El Cajon | 97,000
|
| San Marcos | 89,000
|
| Encinitas | 62,000
|
Cities and towns in San Diego County
Incorporated cities and towns

- Carlsbad
- Chula Vista
- Coronado
- Del Mar
- El Cajon
- Encinitas (Cardiff-by-the-Sea, Leucadia, Olivenhain)
- Escondido
- Imperial Beach
- La Mesa
- Lemon Grove
- National City
- Oceanside
- Poway
- San Diego
- San Marcos
- Santee
- Solana Beach
- Vista
Unincorporated communities
Indian reservations
San Diego County has 18 federally recognized Indian reservations, more than any other county in the United States.[12] Although they are typical in size to other Indian reservations in California (many of which are termed "Rancherías"), they are relatively tiny by national standards,[citation needed] and all together total 200.2 square miles (518.5 km²) of area.
Boundaries (counties and municipalities)

Template:Image label verysmall Template:Image label verysmall Template:Image label verysmall Template:Image label verysmall Template:Image label verysmall Template:Image label verysmall
National protected areas
- Cabrillo National Monument
- Cleveland National Forest (part)
- San Diego National Wildlife Refuge Complex, which includes several individual wildlife refuge areas:[13]
- San Diego Bay South Bay
- San Diego Bay Sweetwater Marsh
- Tijuana Slough National Wildlife Refuge
- Seal Beach National Wildlife Refuge (located in Orange County)
- San Diego National Wildlife Refuge
- Vernal Pools
State parks and protected areas
- Anza-Borrego Desert State Park (portions are also in Imperial and Riverside counties)
- Torrey Pines State Reserve
- Cuyamaca Rancho State Park
- Palomar Mountain State Park
- San Pasqual Battlefield State Historic Park
- Old Town San Diego State Historic Park
- Border Field State Park
- Tijuana River Natural Estuarine Research Reserve
- San Onofre State Beach
- Moonlight State Beach
- Carlsbad State Beach
- South Carlsbad State Beach
- Leucadia State Beach
- San Elijo State Beach
- Cardiff State Beach
- Torrey Pines State Beach
- Silver Strand State Beach
Mountains
- Cuyamaca Mountains
- In-Ko-Pah Mountains
- Jacumba Mountains
- Laguna Mountains
- Palomar Mountain
- Peninsular Ranges
- San Ysidro Mountains
- Santa Ana Mountains
- Volcan Mountains
There are 236 mountain summits and peaks in San Diego County[14] including:
- Black Mountain
- Cuyamaca Peak (second highest point in San Diego County)
- Cowles Mountain (highest point in the city of San Diego)
- Mount Helix
- Hot Springs Mountain (highest point in San Diego County)
- Mount Soledad
- Stonewall Mountain
Bays and Lagoons
- Buena Vista Lagoon
- Agua Hedionda Lagoon
- Batiquitos Lagoon
- San Elijo Lagoon
- Mission Bay
- San Diego Bay
Lakes
Column-generating template families
The templates listed here are not interchangeable. For example, using {{col-float}} with {{col-end}} instead of {{col-float-end}} would leave a <div>...</div> open, potentially harming any subsequent formatting.
| Type | Family | Handles wiki
table code?† |
Responsive/ mobile suited |
Start template | Column divider | End template |
|---|---|---|---|---|---|---|
| Float | "col-float" | Yes | Yes | {{col-float}} | {{col-float-break}} | {{col-float-end}} |
| "columns-start" | Yes | Yes | {{columns-start}} | {{column}} | {{columns-end}} | |
| Columns | "div col" | Yes | Yes | {{div col}} | – | {{div col end}} |
| "columns-list" | No | Yes | {{columns-list}} (wraps div col) | – | – | |
| Flexbox | "flex columns" | No | Yes | {{flex columns}} | – | – |
| Table | "col" | Yes | No | {{col-begin}}, {{col-begin-fixed}} or {{col-begin-small}} |
{{col-break}} or {{col-2}} .. {{col-5}} |
{{col-end}} |
† Can template handle the basic wiki markup {| | || |- |} used to create tables? If not, special templates that produce these elements (such as {{(!}}, {{!}}, {{!!}}, {{!-}}, {{!)}})—or HTML tags (<table>...</table>, <tr>...</tr>, etc.)—need to be used instead.
Rivers
- San Diego River
- San Luis Rey River
- San Dieguito River
- Sweetwater River (California)
- Otay River
- Tijuana River
Transportation in San Diego County
Major Highways
Border crossings to Mexico
San Ysidro Border Crossing
Otay Mesa Border Crossing
Tecate Border Crossing
Railroads
AMTRAK (Pacific Surfliner)
Metrolink
The Coaster
San Diego and Arizona Eastern Railway
San Diego and Imperial Valley Railroad
Sprinter (North County)
Light rail and local transit
San Diego Trolley
San Diego Metropolitan Transit System
Sprinter
North County Transit District
The Port of San Diego
Primary Civilian Airports
- Lindbergh Field (San Diego International Airport) (SAN)
- Montgomery Field, (MYF)
- McClellan-Palomar Airport, (CLD or CRQ) a.k.a. Palomar Airport or Carlsbad Airport
- Gillespie Field, (SEE) in El Cajon
- Agua Caliente Airport
- Borrego Valley Airport
- Fallbrook Airport
- Oceanside Municipal Airport
- Ocotillo Airport
- Ramona Airport, (RNM)
- Brown Field Municipal Airport, (SDM) (formerly East Field, NAAS Otay Mesa, and NAAS Brown Field)
Education
San Diego County contains three public state universities: University of California, San Diego; San Diego State University; and California State University, San Marcos. Major private universities in the county include University of San Diego (USD), Point Loma Nazarene University (PLNU), Alliant International University (AIU), and National University.
Within the county there are 24 public elementary school districts, 6 high school districts, and 12 unified school districts. There are also 5 community college districts.[15]
There are two separate public library systems in San Diego County: the San Diego Public Library serving the city of San Diego, and the San Diego County Library serving all other areas of the county. In 2010 the county library had 33 branches and two bookmobiles; circulated over 10.7 million books, CDs, DVDs, and other material formats; recorded 5.7 million visits to library branches; and hosted 21,132 free programs and events. The San Diego County Library is one of the 25 busiest libraries in the nation as measured by materials circulated.[16][17]
Significant Naval and Military stations
U.S. Navy
- Naval Base San Diego, also known as "32nd Street Naval Station"
- Naval Amphibious Base Coronado
- Naval Air Station North Island
- Naval Base Point Loma, which includes the Submarine Base and the Fleet Antisubmarine Warfare Training Center
- Space and Naval Warfare Systems Center San Diego (SPAWAR)
- Bob Wilson Naval Hospital, formerly the Naval Medical Center San Diego, also known as Balboa Naval Hospital
U.S. Marine Corps
- Marine Corps Base Camp Pendleton
- Marine Corps Air Station Miramar
- Marine Corps Recruit Depot San Diego
U.S. Coast Guard
Sites of interest
- Anza-Borrego State Park, the largest state park in California with high levels of both plant and animal biodiversity
- Mount Laguna Observatory, owned and primarily operated by San Diego State University
- Palomar Observatory, owned and primarily operated by the California Institute of Technology
- The Ramona Valley wine-producing region, located 28 miles (45 km) northeast of the City of San Diego
- San Diego Zoo Safari Park, formerly known as the San Diego Wild Animal Park, 35 miles (56 km) north of the San Diego Zoo and east of Escondido
- Sea World of San Diego, on Mission Bay.
- Mission Bay Recreation Area, including Fiesta Island, a sheltered bay popular for water sports, also known for the annual Over the line tournament.
- Mission San Diego de Alcala, the first of California's 21 Spanish missions. It is an operating Roman Catholic parish and also is open for historical interest tours during the week. It is located near the interchange of Interstates 8 and 15.
- Balboa Park, with numerous museums and other cultural locations, located just north of Downtown San Diego.
- San Diego Zoo, located in Balboa Park
- Old Town San Diego State Historic Park, located at the western end of Mission Valley, north of Downtown San Diego. It preserves and recreates the original settlement of San Diego during its pueblo, Alta California, and early American periods, through 1872.
- Presidio Park, located on a bluff directly above Old Town, a city historic park on the site of the San Diego Presidio, the first European settlement in California.
- Cabrillo National Monument, located at the southern tip of the Point Loma Peninsula. It has historical exhibits about Juan Rodriguez Cabrillo and World War II as well as the Old Point Loma Lighthouse which is open to the public. It offers striking views of the harbor and ocean, natural areas for hiking and bird watching, and tide pools.
- San Diego Bay contains the aircraft carrier USS Midway now used as a memorial ship and as a floating museum, and the eight floating museum ships of the San Diego Maritime Museum. Harbor cruises, sailing, and sport fishing are also available.
- Legoland California is a "Lego" theme park in Carlsbad. It is the only Legoland outside of Europe.
- Alta Vista Gardens is a Botanical Garden in Vista dedicated to bringing together 'People, Nature & Art'.
Politics
| Year | GOP | DEM | Others |
|---|---|---|---|
| 2008 | 44.1% 539,939 | 54.3% 664,685 | 1.7% 19,270 |
| 2004 | 52.5% 596,033 | 46.4% 526,437 | 1.1% 12,378 |
| 2000 | 49.6% 475,736 | 45.7% 437,666 | 4.7% 45,232 |
| 1996 | 45.8% 402,876 | 44.1% 389,964 | 10.3% 91,311 |
| 1992 | 35.7% 352,125 | 37.2% 367,397 | 27.1% 267,124 |
| 1988 | 60.2% 523,143 | 38.3% 333,264 | 1.5% 12,788 |
| 1984 | 65.3% 502,344 | 33.4% 257,029 | 1.3% 9,894 |
| 1980 | 60.8% 435,910 | 27.3% 195,410 | 11.9% 85,546 |
| 1976 | 55.7% 353,302 | 41.6% 263,654 | 2.7% 16,839 |
| 1972 | 61.8% 371,627 | 34.3% 206,455 | 3.8% 23,055 |
| 1968 | 56.3% 261,540 | 36.1% 167,669 | 7.7% 35,654 |
| 1964 | 50.3% 214,445 | 49.7% 211,808 | 0.0% 33 |
| 1960 | 56.4% 233,045 | 43.3% 171,259 | 0.3% 1,106 |
| 1956 | 64.5% 195,742 | 35.2% 106,716 | 0.4% 1,147 |
| 1952 | 63.5% 186,091 | 35.9% 105,255 | 0.6% 1,688 |
| 1948 | 49.4% 101,552 | 47.8% 98,217 | 2.8% 5,690 |
| 1944 | 45.4% 75,746 | 53.9% 89,959 | 0.6% 1,059 |
| 1940 | 43.3% 55,434 | 55.6% 71,188 | 1.2% 1,488 |
| 1936 | 35.0% 35,686 | 63.5% 64,628 | 1.5% 1,540 |
| 1932 | 41.5% 35,305 | 53.6% 45,622 | 5.0% 4,223 |
| 1928 | 67.1% 47,769 | 32.0% 22,749 | 0.9% 633 |
| 1924 | 49.0% 22,726 | 6.4% 2,944 | 44.7% 20,721 |
| 1920 | 63.8% 19,826 | 27.3% 8,478 | 9.0% 2,783 |
San Diego County has historically been a Republican stronghold: 2008 was the first time in decades that a Democratic presidential nominee won a majority of the county's votes (though in 1992 Bill Clinton won a plurality). The city of San Diego itself is more Democratic than the county's average (though fairly moderate for a large city) and has voted for Democrats Clinton, Gore, Kerry, and Obama in the last five presidential elections respectively. The city of San Diego, as well as Coronado and Imperial Beach, is part of the 53rd congressional district which has a Cook Partisan Voting Index (CPVI) of D +12. San Diego's northern and eastern suburbs tend to be very conservative. Northern suburbs including Carlsbad are part of the 50th district with a CPVI of R +5. In the 2004 presidential election, San Diego, Encinitas, National City, Del Mar, and some other areas voted for John Kerry; San Marcos, Escondido, Carlsbad, Oceanside, Coronado, Santee, Poway, El Cajon, and Vista overwhelmingly backed George W. Bush. Chula Vista, La Mesa, Lemon Grove, Solana Beach, and Imperial Beach are considered swing areas of the county – Chula Vista and Imperial Beach narrowly backed Al Gore in 2000 but narrowly voted for Bush in 2004, while Solana Beach switched from Bush in 2000 to Kerry in 2004. La Mesa narrowly voted for Bush both times, and Lemon Grove narrowly went Democratic both times. In 2008, Barack Obama became the first Democrat to win a majority of votes in San Diego County since World War II. Obama captured Chula Vista, Oceanside, and Carlsbad.
One unique feature of the political scene is the use of Golden Hall, a convention facility next to City Hall, as a central elections center. The County Registrar of Voters rents the hall to distribute election results. Supporters and political observers are invited to watch the results come in, candidates give their victory and concession speeches and host parties for campaign volunteers and donors at the site, and television stations broadcast from the floor of the convention center. Golden Hall was scheduled to be closed in 2004, but was reused again for the November 2005 special election. The atmosphere on the evening of election day is often comparable to the voting portion of a political party national convention.[18]
In the House of Representatives, all of California's 50th, 52nd, and 53rd districts and parts of the 49th and 51st districts are in the county. By district, the seats are held by Republican Darrell Issa, Republican Brian Bilbray, Democrat Bob Filner, Republican Duncan D. Hunter, and Democrat Susan Davis.
On Nov. 4, 2008 San Diego County voted 53.8 % for Proposition 8 which amended the California Constitution to ban same-sex marriages, thus restoring Proposition 22 which was overturned by a ruling from the California Supreme Court. However the city of San Diego, along with Del Mar, Encinitas, and Solana Beach, voted against Proposition 8.[19]
In the State Assembly, parts of the 66th and 73rd districts, and all of the 74th–79th districts are in the county. Districts 76 and 79 are held by Democrats, Lori Saldaña and Mary Salas respectively; the others are held by Republicans; by district they are Kevin Jeffries, Mimi Walters, Martin Garrick, George A. Plescia, Joel Anderson, and Shirley Horton.
In the State Senate, all of the 39th district and parts of the 36th, 38th, and 40th districts are in the county and are held by Republicans Dennis Hollingsworth and Mark Wyland, and Democrats Christine Kehoe and Denise Moreno Ducheny.
| District | Location | Cook PVI | % for Bush, 2004 | Median household income[20] | Per capita income[20] |
|---|---|---|---|---|---|
| 49th district | Northern San Diego and southwestern Riverside County | R +10 | 63% | $46,445 | $19,659 |
| 50th district | Northern San Diego County, including costal communities such as Carlsbad, California but excluding La Jolla | R +5 | 55% | $59,813 | $29,877 |
| 51st district | Southern San Diego County, including Chula Vista and National City. Also includes all of Imperial County | D +7 | 46% | $39,243 | $14,923 |
| 52nd district | Eastern San Diego County, including La Mesa, El Cajon and Lakeside. | R +9 | 61% | $52,940 | $24,544 |
| 53rd district | San Diego including La Jolla, Coronado and Imperial Beach | D +12 | 39% | $36,637 | $21,715 |
| Mean | Districts: 49th, 50th, 51st, 52nd, 53rd | R +5 | 52.8% | $47,016 | $22,144 |
County Board of Supervisors
As of December 2010 the members of the San Diego County Board of Supervisors are:
- Greg Cox, District 1
- Dianne Jacob, District 2
- Pam Slater-Price, District 3, Chairwoman
- Ron Roberts, District 4
- Bill Horn, District 5, Vice-Chairman
Demographics
| Census | Pop. | Note | %± |
|---|---|---|---|
| 1850 | 798 | — | |
| 1860 | 4,324 | 441.9% | |
| 1870 | 4,951 | 14.5% | |
| 1880 | 8,018 | 61.9% | |
| 1890 | 34,987 | 336.4% | |
| 1900 | 35,090 | 0.3% | |
| 1910 | 61,665 | 75.7% | |
| 1920 | 112,248 | 82.0% | |
| 1930 | 209,659 | 86.8% | |
| 1940 | 289,348 | 38.0% | |
| 1950 | 556,808 | 92.4% | |
| 1960 | 1,033,011 | 85.5% | |
| 1970 | 1,357,854 | 31.4% | |
| 1980 | 1,861,846 | 37.1% | |
| 1990 | 2,498,016 | 34.2% | |
| 2000 | 2,813,833 | 12.6% | |
| 2008 (est.) | 3,001,072 |
As of 2009 Census Bureau estimates, there were 3,053,793 people, 1,067,846 households, and 663,449 families residing in the county. The population density was 670 people per square mile (259/km²). There were 1,142,245 housing units at an average density of 248 per square mile (96/km²). The racial makeup of the county was 79.4% White American, 5.6% Black or African American, 1% Native American, 10.4% Asian, 0.5% Pacific Islander, 10.3% from other races, and 3.6% from two or more races. 31.3% of the population were Hispanic or Latino of any race. 67.0% spoke only English at home; 21.9% spoke Spanish, 3.1% Tagalog and 1.2% Vietnamese.
In 2000 there were 994,677 households out of which 33.9% had children under the age of 18 living with them, 50.7% were married couples living together, 11.6% had a female householder with no husband present, and 33.3% were non-families. 24.2% of all households were made up of individuals and 7.9% had someone living alone who was 65 years of age or older. The average household size was 2.73 and the average family size was 3.29.
In the county the population was spread out with 25.7% under the age of 18, 11.30% from 18 to 24, 32.0% from 25 to 44, 19.8% from 45 to 64, and 11.2% who were 65 years of age or older. The median age was 33 years. For every 100 females there were 101.2 males. For every 100 females age 18 and over, there were 99.7 males.
The median income for a household in the county was $47,067, and the median income for a family was $53,438. Males had a median income of $36,952 versus $30,356 for females. The per capita income for the county was $22,926. About 8.9% of families and 12.4% of the population were below the poverty line, including 16.5% of those under age 18 and 6.8% of those age 65 or over.
Current estimates
According to estimates by the San Diego Association of Governments, the median household income of San Diego County in 2005 was $64,273 (not adjusted for inflation). When adjusted for inflation (1999 dollars; comparable to Census data above), the median household income was $52,192.
Crime statistics
Crime statistics for 2005 (Reported by the sheriff's office or police)[21]
- Murders: 105
- Rapes: 86
- Robberies: 270
- Assaults: 1220
- Burglaries: 2469
- Thefts: 4626
- Auto thefts: 2084
See also
- List of school districts in San Diego County, California
- List of high schools in San Diego County, California
- National Register of Historic Places listings in San Diego County, California
References
Constructs such as ibid., loc. cit. and idem are discouraged by Wikipedia's style guide for footnotes, as they are easily broken. Please improve this article by replacing them with named references (quick guide), or an abbreviated title. (May 2010) |
- ^ U.S. Census Quickfacts
- ^ Showley, Roger (December 18, 2009). "S.D. County's population tops 3.2 million". San Diego Union Tribune.
- ^ climate map
- ^ [1] Economics
- ^ kumeyaay website
- ^ a b Coy, Owen C.; Ph.D. (1923). California County Boundaries. Berkeley: California Historical Commission. p. 221. ASIN B000GRBCXG.
{{cite book}}: CS1 maint: multiple names: authors list (link) - ^ Ibid. 207
- ^ Ibid. 113
- ^ "Census 2000 U.S. Gazetteer Files: Counties". United States Census. Retrieved 2011-02-13.
- ^ [2]
- ^ Gerber, James ed. Economic Profile of the San Diego-Tijuana Region: Characteristics for Investment and Governance Decisions. Institute for Regional Studies of the Californias. 1995. p.11
- ^ University of San Diego
- ^ San Diego National Wildlife Refuge Complex website
- ^ MountainZone.com
- ^ San Diego County Board of Education
- ^ http://www.sdcl.org/aboutus.html
- ^ http://dbpcosdcsgt.co.san-diego.ca.us/screens/AR2010/index.html
- ^ Amid the celebrations, farewell | The San Diego Union-Tribune
- ^ San Diego County Proposition 8 Results by Community
- ^ a b "US Census Bureau, 2000 Census income data by congressional district". Retrieved 2007-05-31.
- ^ "city-data - San_Diego_County-CA". analyzed data from numerous sources. Retrieved 2009-04-18.
External links
- Official Travel Resource for the San Diego Region
- County of San Diego Official Website
- San Diego Geographic Information Source Website
- San Diego County Water Authority Map
- California State Association of Counties (CSAC)
| County | |||||||||
|---|---|---|---|---|---|---|---|---|---|
| Cities |
| ||||||||
| CDPs 20k+ | |||||||||
| Reservations |
| ||||||||
| Bodies of water | |||||||||
| Sub-regions | |||||||||
| Parks and monuments | |||||||||
| Counties and municipalities |  | |
|---|---|---|
| Major cities | ||
| Cities 100k–250k | ||
| Cities and towns 20k–99k | ||
| Cities and towns 10k–19k | ||
| Bodies of water | ||
| Sub-regions | ||

Template:USLargestMetros 33°01′N 116°46′W / 33.02°N 116.77°W