New York's 3rd congressional district
| New York's 3rd congressional district | |
|---|---|
Interactive map of district boundaries | |
| Representative | |
| Distribution |
|
| Population (2023) | 760,691[1] |
| Median household income | $133,103[2] |
| Ethnicity |
|
| Cook PVI | D+2[3] |
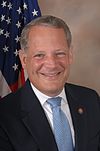
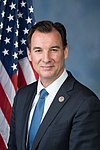
New York's 3rd congressional district is a congressional district for the United States House of Representatives in the State of New York. It is represented by Democrat Tom Suozzi, after a special election was held on February 13, 2024, to replace expelled Republican George Santos.[4][5] The election was called for Suozzi by the Associated Press about an hour after the polls closed.[6]
NY-03 is the wealthiest congressional district in New York, and in 2022, was the fourth-wealthiest nationally.[7]
The district was also one of the congressional districts that voted for Donald Trump in the 2024 presidential election that was won by a Democrat in the 2024 United States House of Representatives elections.[8]
Composition
[edit]The district includes part of the North Shore of Long Island. It expands across northern Nassau County and into far northeastern Queens. Long Island communities in the district include Oyster Bay Cove, Old Brookville, Levittown, Glen Cove, Roslyn, Manhasset, Plainview, Bethpage, Port Washington, Hicksville, Jericho, Syosset, Mineola, Farmingdale, Massapequa Park, and Great Neck. Queens neighborhoods in the district include Little Neck, Whitestone, Glen Oaks, Floral Park, and Queens Village.
Recent statewide election results
[edit]| Year | Office | Results |
|---|---|---|
| 1992 | President | Clinton 44–42% |
| 1996 | President | Clinton 53–38% |
| 2000 | President | Gore 52–44% |
| 2004 | President | Bush 52–47% |
| 2008 | President | Obama 54–46% |
| 2012 | President | Obama 51–48%[9] |
| 2016 | President | Clinton 51–45% |
| 2020 | President | Biden 54–44% |
| 2024 | President | Trump 52–47%[better source needed][10][user-generated source] |
List of members representing the district
[edit]1789–1805: one seat
[edit]| Representative | Party | Years | Cong ress |
Electoral history | |
|---|---|---|---|---|---|
| District established March 4, 1789 | |||||
 Egbert Benson (New York) |
Pro- Administration |
March 4, 1789 – March 3, 1793 |
1st 2nd |
Elected in 1789. Re-elected in 1790. Retired. | |
 Philip Van Cortlandt (Cortlandt) |
Anti- Administration |
March 4, 1793 – March 3, 1795 |
3rd 4th 5th 6th 7th |
Elected in 1793. Re-elected in 1794. Re-elected in 1796. Re-elected in 1798. Re-elected in 1800. Redistricted to the 4th district. | |
| Democratic- Republican |
March 4, 1795 – March 3, 1803 | ||||
 Samuel L. Mitchill (New York) |
Democratic- Republican |
March 4, 1803 – November 22, 1804 |
8th | Redistricted from the 2nd district and re-elected in 1802. Resigned when elected U.S. Senator. | |
| Vacant | November 22, 1804 – February 14, 1805 |
||||
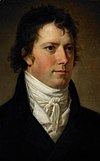 George Clinton Jr. (New York) |
Democratic- Republican |
February 14, 1805 – March 3, 1805 |
Elected to finish Mitchill's term. Also elected in the combined 2nd and 3rd districts, see below. | ||
1805–1809: two seats on general ticket with 2nd district
[edit]Gurdon S. Mumford is usually[by whom?] listed as member from the 2nd district, and George Clinton Jr. from the 3rd district, because Clinton was elected to fill the vacancy caused by the election of Mitchill to the U.S. Senate, and Mitchill had been elected previously in the 3rd district. However, in 1804 Mitchill was already re-elected on the 2nd/3rd general ticket, and both Clinton and Mumford were elected in special elections, receiving votes in both districts.
| Years | Cong ress |
Seat A | Seat B | ||||||
|---|---|---|---|---|---|---|---|---|---|
| Representative | Party | Electoral history | Representative | Party | Electoral history | ||||
| March 4, 1805 – March 3, 1809 |
9th 10th |
Gurdon S. Mumford (New York) |
Democratic-Republican | Daniel D. Tompkins was elected in 1804 but declined the seat when appointed to the New York Supreme Court. Elected to begin Tompkins's term. Re-elected in 1806. |
 George Clinton Jr. (New York) |
Democratic-Republican | Samuel L. Mitchill (of the 3rd district) was re-elected in 1804 but resigned November 22, 1804 when elected U.S. Senator. Elected to begin Mitchill's term. Re-elected in 1806. | ||
The districts were separated in 1809.
1809–1823: one seat
[edit]| Representative | Party | Years | Cong ress |
Electoral history |
|---|---|---|---|---|
 Jonathan Fisk (Newburgh) |
Democratic- Republican |
March 4, 1809 – March 3, 1811 |
11th | Elected in 1808. [data missing] |
 Pierre Van Cortlandt Jr. (Peekskill) |
Democratic- Republican |
March 4, 1811 – March 3, 1813 |
12th | Elected in 1810. Lost re-election. |
| Peter Denoyelles (Haverstraw) |
Democratic- Republican |
March 4, 1813 – March 3, 1815 |
13th | Elected in 1812. [data missing] |
| Jonathan Ward (New Rochelle) |
Democratic- Republican |
March 4, 1815 – March 3, 1817 |
14th | Elected in 1814. [data missing] |
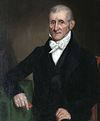 Caleb Tompkins (White Plains) |
Democratic- Republican |
March 4, 1817 – March 3, 1821 |
15th 16th |
Elected in 1816. Re-elected in 1818. [data missing] |
| Vacant | March 4, 1821– December 3, 1821 |
17th | Elections were held in April 1821. It is unclear when results were announced or credentials issued. | |
| Jeremiah H. Pierson (Ramapo) |
Democratic- Republican |
December 3, 1821 – March 3, 1823 | ||
1823–1843: three, then four, seats
[edit]Starting in 1823, three seats were elected at-large district-wide on a general ticket. In 1833, a fourth seat was apportioned to the district, also elected district-wide at-large on the same general ticket.
1843–present
[edit]Recent election results
[edit]In New York State there are numerous parties at various points on the political spectrum. Certain parties will invariably endorse either the Republican or Democratic candidate for every office, hence the state electoral results contain both the party votes, and the final candidate votes (Listed as "Recap").
1996
[edit]| Party | Candidate | Votes | % | ±% | |
|---|---|---|---|---|---|
| Republican | Peter T. King (incumbent) | 127,972 | 55.3 | ||
| Democratic | Dal LaMagna | 97,518 | 42.1 | ||
| Right to Life | John J. O'Shea | 4,129 | 1.8 | ||
| Liberal | John A. DePrima | 1,807 | 0.8 | ||
| Majority | 30,454 | 13.2 | |||
| Turnout | 231,426 | 100 | |||
1998
[edit]| Party | Candidate | Votes | % | ±% | |
|---|---|---|---|---|---|
| Republican | Peter T. King (incumbent) | 117,258 | 64.3 | +9.0 | |
| Democratic | Kevin N. Langberg | 63,628 | 34.9 | −7.2 | |
| Liberal | Thomas R. DiLavore | 1,497 | 0.8 | +0.0 | |
| Majority | 53,630 | 29.4 | +16.2 | ||
| Turnout | 182,383 | 100 | −21.2 | ||
2000
[edit]| Party | Candidate | Votes | % | ±% | |
|---|---|---|---|---|---|
| Republican | Peter T. King (incumbent) | 143,126 | 59.5 | −4.8 | |
| Democratic | Dal LaMagna | 95,787 | 39.8 | +4.9 | |
| Liberal | Selma Olchin | 1,515 | 0.6 | −0.2 | |
| Majority | 47,339 | 19.7 | −9.7 | ||
| Turnout | 240,428 | 100 | +31.8 | ||
2002
[edit]| Party | Candidate | Votes | % | ±% | |
|---|---|---|---|---|---|
| Republican | Peter T. King (incumbent) | 121,537 | 71.9 | +12.4 | |
| Democratic | Stuart L. Finz | 46,022 | 27.2 | −12.6 | |
| Liberal | Janeen DePrima | 1,513 | 0.9 | +0.3 | |
| Majority | 75,515 | 44.7 | +25.0 | ||
| Turnout | 169,072 | 100 | −29.7 | ||
2004
[edit]| Party | Candidate | Votes | % | ±% | |
|---|---|---|---|---|---|
| Republican | Peter T. King (incumbent) | 171,259 | 63.0 | −8.9 | |
| Democratic | Blair H. Mathies, Jr. | 100,737 | 37.0 | +9.8 | |
| Majority | 70,522 | 25.9 | −18.8 | ||
| Turnout | 271,996 | 100 | +60.9 | ||
2006
[edit]| Party | Candidate | Votes | % | ±% | |
|---|---|---|---|---|---|
| Republican | Peter T. King (incumbent) | 101,787 | 56.0 | −7.0 | |
| Democratic | Dave Mejias | 79,843 | 44.0 | +7.0 | |
| Majority | 21,944 | 12.1 | −13.8 | ||
| Turnout | 181,630 | 100 | −33.2 | ||
2008
[edit]| Party | Candidate | Votes | % | ±% | |
|---|---|---|---|---|---|
| Republican | Peter T. King (incumbent) | 135,648 | 64.0 | +8.0 | |
| Democratic | Graham Long | 76,918 | 36.0 | −7.0 | |
| Turnout | 212,566 | 100 | −33.2 | ||
2010
[edit]| Party | Candidate | Votes | % | ±% | |
|---|---|---|---|---|---|
| Republican | Peter T. King (incumbent) | 126,142 | 72.0 | +8.0 | |
| Democratic | Howard Kudler | 48,963 | 28.0 | −8.0 | |
| Turnout | 175,105 | 100 | −33.2 | ||
2012
[edit]| Party | Candidate | Votes | % | |
|---|---|---|---|---|
| Democratic | Steve Israel | 146,271 | 53.5 | |
| Working Families | Steve Israel | 6,506 | 2.4 | |
| Independence | Steve Israel | 5,103 | 1.9 | |
| Total | Steve Israel (incumbent) | 157,880 | 57.8 | |
| Republican | Stephen LaBate | 98,614 | 36.1 | |
| Conservative | Stephen LaBate | 14,589 | 5.4 | |
| Total | Stephen LaBate | 113,203 | 41.5 | |
| Libertarian | Michael McDermott | 1,644 | 0.6 | |
| Constitution | Anthony Tolda | 367 | 0.1 | |
| Total votes | 273,094 | 100 | ||
| Democratic gain from Republican | ||||
2014
[edit]| Party | Candidate | Votes | % | |
|---|---|---|---|---|
| Democratic | Steve Israel | 80,393 | 48.9 | |
| Working Families | Steve Israel | 5,191 | 3.2 | |
| Independence | Steve Israel | 4,448 | 2.7 | |
| Total | Steve Israel (incumbent) | 90,032 | 54.8 | |
| Republican | Grant Lally | 63,219 | 38.5 | |
| Conservative | Grant Lally | 11,050 | 6.7 | |
| Total | Grant Lally | 74,269 | 45.2 | |
| Total votes | 164,301 | 100.0 | ||
| Democratic hold | ||||
2016
[edit]| Party | Candidate | Votes | % | |
|---|---|---|---|---|
| Democratic | Tom Suozzi | 167,758 | 52.9 | |
| Republican | Jack Martins | 131,534 | 41.4 | |
| Conservative | Jack Martins | 16,134 | 5.1 | |
| Reform | Jack Martins | 1,909 | 0.6 | |
| Total | Jack Martins | 149,577 | 47.1 | |
| Total votes | 317,335 | 100.0 | ||
| Democratic hold | ||||
2018
[edit]| Party | Candidate | Votes | % | ±% | |
|---|---|---|---|---|---|
| Democratic | Tom Suozzi (incumbent) | 157,456 | 59.0 | +6.6 | |
| Republican | Dan DeBono | 109,514 | 41.0 | −6.6 | |
| Turnout | 266,970 | 100 | +13.2 | ||
| Democratic hold | |||||
2020
[edit]| Party | Candidate | Votes | % | |
|---|---|---|---|---|
| Democratic | Tom Suozzi (incumbent) | 195,927 | 52.6 | |
| Working Families | Tom Suozzi | 9,193 | 2.5 | |
| Independence | Tom Suozzi | 3,292 | 0.9 | |
| Total | Tom Suozzi (incumbent) | 208,412 | 55.9 | |
| Republican | George Santos | 147,437 | 39.6 | |
| Conservative | George Santos | 14,470 | 3.9 | |
| Total | George Santos | 161,907 | 43.4 | |
| Libertarian | Howard Rabin | 2,154 | 0.5 | |
| Total votes | 372,473 | 100.0 | ||
| Democratic hold | ||||
2022
[edit]| Party | Candidate | Votes | % | |
|---|---|---|---|---|
| Republican | George Santos | 133,859 | 49.33% | |
| Conservative | George Santos | 11,965 | 4.41% | |
| Total | George Santos | 145,824 | 53.74% | |
| Democratic | Rob Zimmerman | 120,045 | 44.24% | |
| Working Families | Rob Zimmerman | 5,359 | 1.98% | |
| Total | Rob Zimmerman | 125,404 | 46.22% | |
| Total votes | 271,331 | 100% | ||
| Republican gain from Democratic | ||||
2024 (special)
[edit]Following the expulsion of George Santos from Congress on December 1, 2023,[18] Governor Kathy Hochul set the special election date for Tuesday, February 13, 2024.[19]
| Party | Candidate | Votes | % | ±% | |
|---|---|---|---|---|---|
| Democratic | Tom Suozzi | 93,183 | 53.92 | +9.66 | |
| Republican | Mazi Melesa Pilip | 69,778 | 40.38 | −8.97 | |
| Conservative | Mazi Melesa Pilip | 9,512 | 5.50 | +1.09 | |
| Total | Mazi Melesa Pilip | 79,290 | 45.88 | −7.88 | |
| Write-in | 337 | 0.20 | N/A | ||
| Total votes | 172,810 | 100.00 | |||
| Democratic gain from Republican | |||||
Historical district boundaries
[edit]

This district historically has been centered in northeast Nassau County, but has added other areas from time to time. In the 1960s the district encompassed the northern half of Nassau County and a small corner of Queens. In the 1970s North Hempstead town was added to the 6th District and the 3rd moved into Huntington in Suffolk County and parts of southeast Nassau County. In the 1980s most of eastern Nassau was added to the 4th District, and the 3rd was composed of northwest Nassau, a narrow corridor along the Long Island Sound, and northwest Suffolk. After the 1992 redistricting the North Shore was transferred to the new 5th District and the 3rd consisted of inland areas of northern and eastern Nassau County, and the Nassau County south shore. An even narrower corridor linked the northwest Nassau and northwest Suffolk portion of the 5th District, leaving most of Oyster Bay in the 3rd. The 2002 remap removed some areas of eastern Nassau but added south shore towns in Suffolk County and the shore areas of northeast Nassau. In 2012, the district moved from the South Shore to the North Shore and re-entered Queens for the first time since the 1960s.
See also
[edit]- List of United States congressional districts
- New York's congressional districts
- United States congressional delegations from New York
References
[edit]- ^ "New York congressional districts by urban and rural population and land area". United States Census Bureau. June 8, 2017. Archived from the original on November 21, 2019. Retrieved November 21, 2019.
- ^ Center for New Media & Promotion (CNMP), US Census Bureau. "My Congressional District". www.census.gov.
- ^ "2022 Cook PVI: District Map and List". Cook Political Report. July 12, 2022. Retrieved January 10, 2023.
- ^ McDaniel, Eric. "George Santos expelled from Congress". Retrieved December 1, 2023.
- ^ Gamio, Lazaro; Williams, Josh; Wu, Ashley; Cook Escobar, Molly (December 1, 2023). "How Every Member Voted On The Expulsion of George Santos From Congress". The New York Times. Retrieved December 1, 2023.
- ^ "Democrat Tom Suozzi wins New York race to succeed George Santos in Congress". AP News. February 13, 2024. Retrieved February 14, 2024.
- ^ DePietro, Andrew. "The Wealthiest Congressional Districts Of 2022". Forbes. Retrieved December 2, 2022.
- ^ https://www.nbcnews.com/politics/congress/trumps-victory-sets-fight-house-turf-2026-rcna184017
- ^ "Swing State Project:: Presidential Results by Congressional District, 2000-2008". Archived from the original on March 5, 2009. Retrieved March 27, 2010.
- ^ https://docs.google.com/spreadsheets/d/1ZHx5E0-5vuXxcZShBgsAl_vwAntkkanGqYQp0owNjoQ/edit?gid=0#gid=0
- ^ "The House expels Rep. George Santos. An ethics report had accused him of breaking federal law". AP News. December 1, 2023. Archived from the original on December 2, 2023. Retrieved December 2, 2023.
- ^ "New York State Official Election Night Results" (PDF). New York Board of Elections. Retrieved March 8, 2021.
- ^ "NYS Board of Elections" (PDF). NYS Board of Elections. November 4, 2014. Retrieved January 23, 2017.
- ^ "New York State Official Election Night Results" (PDF). New York Board of Elections. Retrieved December 28, 2016.
- ^ "November 3, 2020 General Election Certification" (PDF). New York State Board of Elections. September 17, 2020. Retrieved September 25, 2020.
- ^ "2020 Election Results". New York State Board of Elections. Retrieved December 3, 2020.
- ^ "2022 General Election Results — Certified December 15, 2022". New York State Board of Elections. Archived from the original on December 30, 2022. Retrieved December 30, 2022.
- ^ "George Santos is gone. Two dozen candidates want his seat". New York Times. December 1, 2023. Retrieved December 1, 2023.
- ^ Gans, Jared (December 5, 2023). "Hochul sets special election to replace Santos for Feb. 13". The Hill. Retrieved December 5, 2023.
- ^ "2024 Special - Representative in Congress - Congressional District 3". New York State Board of Elections. February 13, 2024. Retrieved March 15, 2024.
- Martis, Kenneth C. (1989). The Historical Atlas of Political Parties in the United States Congress. New York: Macmillan Publishing Company.
- Martis, Kenneth C. (1982). The Historical Atlas of United States Congressional Districts. New York: Macmillan Publishing Company.
- Congressional Biographical Directory of the United States 1774–present
- National atlas congressional maps


