
Demographics of the United Kingdom
| Demographics of the United Kingdom | |
|---|---|
 Population pyramid in 2021 | |
| Population | |
| Density | 279/km2 (720/sq mi) (2022)[1] |
| Growth rate | |
| Birth rate | |
| Death rate | |
| Life expectancy | |
| • male | |
| • female | |
| Fertility rate | |
| Infant mortality rate | |
| Net migration rate | |
| Age structure | |
| 0–14 years | 17.6% (2020) |
| 15–64 years | 63.9% |
| 65 and over | 18.5% |
| Sex ratio | |
| At birth | 1.05 male(s)/female |
| Under 15 | 1.05 male(s)/female (2022) |
| 65 and over | 0.73 male(s)/female (2022) |
| Nationality | |
| Nationality | British |
| Major ethnic | |
| Minor ethnic |
|
| Language | |
| Spoken | British English |
| Sources:[2] | |
The population of the United Kingdom was estimated at almost 67.6 million people in 2022.[1] It is the 21st most populated country in the world and has a population density of 279 people per square kilometre (720 people/sq mi), with England having significantly greater density than Wales, Scotland, and Northern Ireland.[1] Almost a third of the population lives in south east England, which is predominantly urban and suburban, with about 9 million in the capital city, London, whose population density is just over 5,200 per square kilometre (13,468 per sq mi).[3]
The population of the UK has undergone demographic transition—that is, the transition from a (typically) pre-industrial population, with high birth and mortality rates and slow population growth, through a stage of falling mortality and faster rates of population growth, to a stage of low birth and mortality rates with, again, lower rates of growth. This growth through 'natural change' has been accompanied in the past two decades by growth through net immigration into the United Kingdom, which since 1999 has exceeded natural change.[4]
The United Kingdom's high literacy rate (99% at age 15 and above)[5] is attributable to universal state education, introduced at the primary level in 1870 (Scotland 1872, free 1890[6]) and at the secondary level in 1900. Parents are obliged to have their children educated from the ages of 5 to 16 years. In England, 16-17 year olds should remain in education, employment or training (for example, in the form of A-Levels, vocational training, and apprenticeships), until the age of 18.[7]
The United Kingdom's population is predominantly White British (81.88% at the 2011 Census), but due to migration from Commonwealth nations, Britain has become ethnically diverse. The second and third largest non-white racial groups are Asian British at 7% of the population, followed by Black British people at 3%.
The main language of the country is British English. Some Celtic languages, namely Scottish Gaelic and Irish, are still spoken by minorities in Scotland and Northern Ireland, respectively, and Cornish has been revived to a limited degree in Cornwall; but the predominant language in all these areas is English. Welsh is widely spoken as a first language in parts of North and West Wales, and to lesser extent in South East Wales, where English is the dominant first language.[citation needed]
History[edit]
Before the census, 200–1800[edit]
Roman Britain had an estimated population between 2.8 million and 3 million at the end of the second century AD. At the end of the fourth century, it had an estimated population of 3.6 million, of whom 125,000 consisted of the Roman army and their families and dependents.[8] The urban population of Roman Britain was about 240,000 people at the end of the fourth century.[8] Roman Britain's capital city, Londinium, is estimated to have had a population of about 60,000.[9][10]
Following the Roman withdrawal from Britain, Germanic tribes from continental Europe such as the Angles, Saxons and Jutes began a period of significant migration to the southeastern part of the island, notably bringing their language, Old English.[11] Nevertheless, the overall population is believed to have fallen precipitously due to political upheavals and plagues.[12][13] By the time of the compilation of the Domesday Book in the eleventh century, there may have between 1.25 and 2 million people living in England.[14] Though the Domesday Book did not count the English population, it has been regarded as one of the first attempts to produce a census of the country.[15]
Between the years of 1086 and 1750, the English population fluctuated in size due to civil war, famines and plagues.[4] By the end of the 13th century, the population was estimated to have reached between four and six million people, but a combination of factors such as widespread famine and disease in the following century collapsed the population dramatically. An agricultural crisis in 1315 to 1322 and the Black Death in 1348 to 1350 collapsed the population by over a third of its pre-existing number, and the growth rate.[4] By 1377, the population was estimated on a poll-tax of all people aged 14 and over, depending on the population amount of those under 14, to be around 2.2 million to 3.1 million.[4]
Periods of instability over the 15th century such as the War of the Roses caused the population to, while grow, increase at a slowed pace.[4] The general factors behind the slow increase was a high mortality rate due to war, less marriages within the population and late marriages, keeping fertility levels lower than they should have been for the time and a net emigration of English people out of the country.[4] However, in contrast to the preceding century, by the 16th century, this situation has elevated itself due to political stability under the Tudor monarchy and little civil unrest which would have resulted in a higher mortality rate.[4] While this was overturned with the English Civil War in 17th century, it allowed the population to grow at a faster pace, causing the population of England to reach a pre-collapse total of 5.74 million by 1750.[4] In Scotland, population growth was not to the same extent as it was in England, which resulted in being significantly lower in the late 17th and early 18th centuries, which is often ascribed to similar factors halting it such as a high mortality rate, especially for infants, and later marriage and childbearing patterns.[4] Ireland on the other hand before the 19th century consistently had rapid population growth, which has been ascribed to higher fertility rates and earlier marriage than England. Furthermore, the Plantation of Ulster in the 17th century also affected the population total of Scotland with an estimated 100,000 Scots migrating to Ulster, additionally, the Jacobite rebellion in 1745 also caused significant emigration.[4] The estimated population total of Scotland in 1691 was 1.23 million.[4]
The impetus to collect population data was reinforced due to food supply concerns and war against France in the late 18th century and the beginning of the early 19th century.[4] In 1800, the Census Act was passed, authorising the first modern census in British history to be conducted.[4]
Census established and the demographic transition, 1800–2000[edit]

The first Census in 1801 revealed that the population of Great Britain was 10.5 million.[16] Of this, England's population had grown to 8.3 million, Wales population rested at 0.6 million while Scotland had a population of 1.6 million.[4] In Ireland, the population rested at an estimate of between 4.5 and 5.5 million inhabitants.[17][18] Since 1801, a census has been conducted every decade, in Ireland this was conducted for the first time in 1821.[4]
During the Industrial Revolution, the demographic transition started to occur within the United Kingdom, going from a pre-industrial society demographically to one of an industrialised society. By 1841 Census, the population of England and Wales rested at 15.9 million,[4][19] doubling in the space of 40 years, for Ireland 8.2 million[4][19][20] and for Scotland 2.6 million.[4][19] This slowed rate of growth for Scotland may be attributed to higher net emigration of Scottish people out of the nation, and two typhus epidemics in 1837 and 1847.[4]
Factors often associated with the beginning of the demographic transition began to change dramatically as well, which contributed to the rapid increase. For example, Child mortality decreased dramatically, the proportion of children born in London who died before the age of five decreased from 74.5% in 1730–1749 to 31.8% in 1810–1829.[21] General mortality was thought to have declined as well, especially after 1850 as well as an increased birth rate caused the English population to sustain itself in the second phase of the transition from 1750 to 1870.[4]
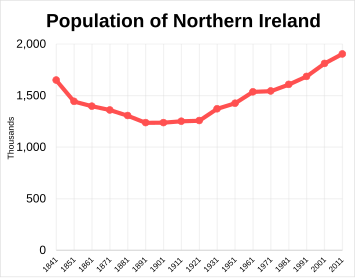
Due to this, in the second half of the 19th century the population of England continued to grow quickly from 16.8 million in 1851 to 30.5 million in 1901.[4] This rapid growth was also seen in the other constituent nations. In Wales, the population increased from 0.6 million in 1801 to 2 million in 1901, in Scotland, the population increased from 1.6 million to 4.5 million in 1901. In contrast however and due to the Great Irish Famine, which began in the 1840s, caused the deaths of 1 million Irish people, and caused well over a million to emigrate.[4][22] Mass emigration became entrenched as a result of the famine, and Ireland's population decreased rapidly, from 8.2 million in 1841 to 3.2 million in 1901.[4][23] However this massive population collapse did not effect Northern Ireland to the same extent, due to being more industrialised and urbanised and while the population did decline, it had recovered itself by the beginning of the 20th century.[4] This prolonged period of emigration and net population decline in Irish history was only reversed by the middle of the 20th century.[23]
By the 1870s, the total fertility rate of the UK population declined from 4.88 children per woman in 1871, to 2.4 by 1921, representing a transition to the third stage of the demographic transition.[4] Traditional means of birth control were used such as abstinence and withdrawal facilitated the collapse of the birth rate,[4] this was also hastened by the 1930s by more modern methods of contraception which were beginning to be used with increased acceptance.[4] From 1840 to 1930 there was a net emigration of English people out of the country which resulted in the population being stunted in the capacity it could have grown to.[4]
During the first half of the 20th century, the United Kingdom began to approach the 4th stage of the demographic transition.[4] The end of the First World War and the loss of lives of troops, coupled with an influenza outbreak is estimated to have caused the death of upwards of 900,000 people in the United Kingdom.[4] This as a consequence shrunk the male population of the Lost Generation and altered the sex ratio, which slowed the growth rate of the population down.[4] By the end of the Second World War, this transition had been completed and the society had a low but fluctuating birth rate, a low death rate and a slowed growth rate of the population.[4] In 1948, the British Nationality Act was signed which allowed the access of the peoples of the British Empire's colonies to migrate to the country being classed in nationality as the same as a native of the United Kingdom. This law, while an unintentional side-effect, led to the start of modern immigration to the United Kingdom.
The move into the 4th stage also took place during major social change in the United Kingdom throughout the 1960s.[4] Liberalisation of society during the decade led to the 1967 Abortion Act which legalised abortion in the United Kingdom for the first time, and the 1969 Divorce Reform Act, which liberalised the circumstances under which someone can get a divorce.[4] Between these years, the population fluctuated; from the 1950s onwards the population increased through natural growth but by the time of the mid-1970s the population decreased due to emigration, which took net migration to a negative, and deaths exceeding births.[4] For the first time in 1973, the birth rate of the country fell below replacement level, due to the previous liberalising acts.[24] By the 1980s, the decline of population growth had recovered to an extent due to a reversal of net emigration.[4]
In the 1990s, international migration began to contribute more proportionally to population growth,[4] and by 1998 this had passed natural increase as the main provider of growth.[4] Liberalisation of immigration rules under the new government allowed rapid increase of the number of migrants arriving, quadrupling the number from a net migration rate of 50,000 a year, to 200,000 a year.[25]
Modern century, 2000–present[edit]
By the beginning of the 21st century, the population of the United Kingdom rested at a total of 59,113,000 people. In each constituent nation, the population of England was 49,449,700, Scotland had a population of 5,064,200, Wales had a population of 2,910,200 and Northern Ireland a population of 1,689,300.[4] Increased international migration which began to rapidly increase at the end of the 20th century also has brought increased ethnic heterogenization to the British population, not only in ethnicity and race, but also in country of birth. In 2001, the White British population was registered to be 88.52% of the total population, but by 2011, this proportion of the population had dropped to 81.88%, with other ethnic groups either rising by 50% of their respective total population in 2001 or doubling entirely.
Such rapid immigration growth boosted population growth in the United Kingdom. In 2011, the population sat at around 63 million people.
Population[edit]

The population of the UK in the last recorded census in 2011 was 63 million, of whom 31 million were male and 32 million female. The 2011 census recorded the population of England as 53.0 million, Scotland as 5.3 million, Wales as 3.1 million, and Northern Ireland as 1.8 million.[26] At the last recorded population estimate, it was estimated that the UK population was at a total of 67,081,234 people.
There are 13 urban areas that exceed 500,000 inhabitants: they are centred on London, Birmingham, Glasgow, Leeds and Bradford, Southampton and Portsmouth, Sheffield, Liverpool, Leicester, Manchester, Belfast, Bristol, Newcastle upon Tyne and Nottingham.[27]
According to the World Population Review,[28] in 2019 there was:
- One birth every 39 seconds
- One death every 52 seconds
- A net gain of one person every minute
- One net immigrant every 3 minutes
Graphs are unavailable due to technical issues. There is more info on Phabricator and on MediaWiki.org. |
Graphs are unavailable due to technical issues. There is more info on Phabricator and on MediaWiki.org. |
Population by constituent country[edit]
| Part | Population (mid-2020)[29] |
Of total population (%) | Area (km2 (mi2))[30] |
Of total area (%) |
Population density (per km2 (per mi2)) | |
|---|---|---|---|---|---|---|
| England | 56,550,138 | 84.3 | 130,309 (50,313) | 53.7 | 434 (1,124) | |
| Scotland | 5,466,000 | 8.2 | 77,911 (30,082) | 32.1 | 70 (181) | |
| Wales | 3,169,586 | 4.7 | 20,736 (8,006) | 8.5 | 153 (396) | |
| Northern Ireland | 1,895,510 | 2.8 | 13,793 (5,326) | 5.7 | 137 (355) | |
| United Kingdom | 67,081,234 | 100 | 242,749 (93,726) | 100 | 274 (710) | |
- Population across constituent countries over time
-
 England
 -
 Scotland
 -
 Wales
Wales -
 Northern Ireland


Population change over time[edit]

The following table shows the total UK population estimated at census dates. Pre 1901 figures include the whole of Ireland, whereas from 1901 onwards only the population of Northern Ireland is included.
| Intercensal period |
Population at start of period |
Average annual numbers of | Population density at start of period (per km2) | ||||
|---|---|---|---|---|---|---|---|
| Overall change |
Births | Deaths | Net natural change |
Net migration etc. | |||
| 1851–1861 | 27,368,800 | 154,910 | Unknown | Unknown | Unknown | Unknown | 87 |
| 1861–1871 | 28,917,900 | 256,680 | Unknown | Unknown | Unknown | Unknown | 92 |
| 1871–1881 | 31,484,700 | 344,980 | Unknown | Unknown | Unknown | Unknown | 100 |
| 1881–1891 | 34,934,500 | 286,790 | Unknown | Unknown | Unknown | Unknown | 111 |
| 1891–1901 | 37,802,400 | 373,580 | Unknown | Unknown | Unknown | Unknown | 120 |
| 1901–1911 | 38,237,000 | 385,000 | 1,091,000 | 624,000 | 467,000 | −82,000 | 156 |
| 1911–1921 | 42,082,000 | 195,000 | 975,000 | 689,000 | 286,000 | −92,000 | 172 |
| 1921–1931 | 44,027,000 | 201,000 | 824,000 | 555,000 | 268,000 | −67,000 | 180 |
| 1931–1951 | 46,038,000 | 213,000 | 793,000 | 603,000 | 190,000 | 22,000 | 188 |
| 1951–1961 | 50,225,000 | 258,000 | 839,000 | 593,000 | 246,000 | 12,000 | 205 |
| 1961–1971 | 52,807,000 | 312,000 | 962,000 | 638,000 | 324,000 | −12,000 | 216 |
| 1971–1981 | 55,928,000 | 42,000 | 736,000 | 666,000 | 69,000 | −27,000 | 229 |
| 1981–1991 | 56,357,000 | 108,000 | 757,000 | 655,000 | 103,000 | 5,000 | 231 |
| 1991–2001 | 57,439,000 | 161,000 | 731,000 | 631,000 | 100,000 | 61,000 | 235 |
| 2001–2011 | 59,113,000 | 324,000 | 722,000 | 588,000 | 134,000 | 191,000 | 242 |
| 2011–2021 | 63,182,000 | — | — | — | — | — | 259 |
Population density calculated on:
- Pre–1901: 243,820 km2 total land area for the United Kingdom plus 70,273 km2 land area of the Republic of Ireland.
- Post–1901: its current boundaries.
Future projections[edit]

The UK government first began publishing population projections for the country in the 1920s under the Government Actuary’s Department (GAD) which were mainly produced to be used for long-term financial estimates for pensions and other schemes of social insurance.[34] However, since the Second World War, population projections have taken an expanded role in all areas of influencing government policy. The GAD produced population projections every year from 1955 to 1979 and then switched it to every 2 years up to 1991. The Office for National Statistics took control of producing population projections for the country in 2006.[34]
The British Office for National Statistics' 2016-based National Population Projections indicated that, if recent trends continue, the UK's population would increase by 3.6 million between mid-2016 and mid-2026. This represents an average annual growth rate of 0.5%. Over the same period, the population of England is projected to grow by 5.9%; for Wales, this figure is 3.1%, while for Scotland and Northern Ireland the figures are 3.2% and 4.2% respectively. These projections did not allow for any possible effects of the UK leaving the European Union.[35]
Fertility[edit]


Since 1838, it has been compulsory to register a birth or death in the United Kingdom.[36]
First official data on the fertility rate of the country was first made available in 1938,[36] However estimates of the total fertility rate (TFR) can be made back all the way till 1541.[37]
The fertility rate of the country before the 19th century maintained itself at an average of around 5 children per woman. This fertility rate within the United Kingdom has been falling since 1870, when the country began into transition into the 3rd stage of the demographic transition.[38][36][24][39][40] This transition represents the change in reproductive strategy from how many children a mother 'needs' to more of how many she 'wants' and a substitution of quality over quantity in the offspring produced.[41][42] From the 1880s onwards, the birth rate began to decline rapidly from the levels it had previous sustained itself at.[42] In England this crude birth rate decline represented a 44% decrease over a period from 1875 to 1920.[42]
A number of factors have been argued to have contributed to this ranging from four broad spectrums of biological, technological changes and developments in the society, socio-economic reasons and cultural considerations.[39] In the context of the Industrial Revolution, a large number of socio-economic developments occurred; large scale urbanisation of the population caused mass internal movements of people to high density population centres, income per capita of citizens rose significantly especially in the last half of the 19th century, coupled with large scale economic growth improved the livelihoods of the working and middle classes of the United Kingdom, this growth in the standard of living led also to the collapse of mortality rates, which had been in decline since the early 18th century and more especially the infant mortality.[40][42][39] This development came about with the decline of child labour at the same time as well which meant there was less of a need for a quantity of children to uphold the household economically,[40][42][39] educational quality of the country rose during the same time period which meant that children held more economical potential through educated labour means.[39]
The decline and equalling out of the gender gap in terms of place in the workforce meant that women were beginning in the 19th century to become a larger part of the workforce which also contributed to the birth rate decline.[40][42][39]
Improvements in public diets and nutritional quality increases, which are linked to biological factors such as a decline in lactation, have also been included as a potential factor in the decline of the fertility rate.[39] Technological developments within the society also began to have an effect; contraceptive use become somewhat usable on a mass scale in the latter half of the 19th century due to technological developments in the production of rubber.[39] Abortion, while illegal during the 19th century, was also used by women, however to what extent at the time is unknown.[39]
Cultural considerations such as decline in religious adherence (albeit little data on this matter during the 19th century) have also been considered as reasons.[39] While these factors altogether are debated by demographers as to which were more important than each other, it is generally accepted that due to these factors overall, mothers could begin to invest more time and nurture 'quality' into their offspring rather than having an increased 'quantity' of children that were needed in the past for various such reasons, and that this development led to the decrease of the total fertility rate.[41]
By 1914, the birthrate sat at around 2.88 children per woman, however by 1918 had collapsed proportionally by almost 50%[43] due to World War One and sank to 2.03 children.[44][37] In the post-World War One period, while the birthrate of the country boomed at the very end of the war reaching a peak of 3.08 children in 1920,[44] this began to endure a rapid decline and had slumped to historic lows by the 1930s, for the first time in the country's history falling below a replacement level fertility rate.[36][24] This did not recover in-till the end of the Second World War in 1945.
In the post-World War Two period, the fertility rate of the country boomed once again, bringing itself out of the below replacement level in the 1930s to levels not seen since the late 19th century. This peaked in 1964, with a TFR of 2.95.[45][46] However, by 1973, the fertility rate of the country collapsed again below replacement, and has not since in the present day reached a replacement level again.[36] However population issues such as the sub-replacement level fertility rate have often been categorised as something in which the government does not view as a major issue.[24] Little incentives were made and have been made to increase the birth rate throughout the UK's post war period.[24] However compared to other countries in continental Western European standards, the United Kingdom managed to retain a seemingly 'high' fertility rate.[24]
Family planning policies were enacted during the 1970s due to concerns of rapid population growth during the 1960s.[24] The 1973 NHS Reorganisation Act is an example of such policies, within this act family planning advice and supplies were first issued to the public.[24] Over this time period, with previous liberalising acts such as the Abortion Act and the Divorce Reform Act, and scientific developments such as increased access to contraceptive methods to reduce pregnancies, such as the contraceptive pill, it is generally ascribed that these social changes were the major contributors to the decline of the fertility rate below replacement level in the latter half of the 20th century.[24] With these changes also, pre-marital conceptions fell to 1950 levels by the late 1970s.[24] This pattern of decline of the birth rate is similar to other European countries.[24]
The government's position was further presented and then re-iterated in 1984 at the UN Conference on Population in Mexico;
The United Kingdom('s) government does not pursue a population policy in the sense of actively trying to influence the overall size of the population, its age-structure, or the components of change except in the field of immigration. Nor has it expressed a view about the size of population, or the age-structure, that would be desirable. ...The current level of births has not been the cause of general anxiety. The prevailing view is that decisions about fertility and childbearing are for people themselves to make, but that it is proper for government to provide individuals with the information and the means necessary to make their decisions effective. To this end, the government provides assistance with family planning as part of the National Health Service. The ‘ageing’ of the population does raise social and economic issues. However, it is believed that these will prove manageable; and also, to a degree, that society will adapt....’[24]
In 2003, Right to Request was setup which allowed the parents of small children to request flexible working times which included shorter working hours for parents to care for their children.[24] However, although a majority of requests for Right to Request are accepted, a report in 2006 found that its impact was negligible as mothers tended to switch employers to get reduced hours regardless.[24]
Due to migration beginning in the late 90s and especially during the 2000s lead to the overall total fertility rate of the country to rise by 0.1 in the period of 2004 to 2011.[24]
In 2012, the UK's total fertility rate (TFR) was 1.92 children per woman,[47] below the replacement rate, which in the UK is 2.075.[48] In 2001, the TFR was at a record low of 1.63, but it then increased every year until it reached a peak of 1.96 in 2008, before decreasing again.[47] In 2012 and 2013, England and Wales's TFR decreased to 1.85.[47][49] In Scotland however TFR is lower: it decreased from 1.75 in 2010 to 1.67 in 2012.[47] Northern Ireland has the highest TFR in the UK, standing at 2.02 in 2010 and 2.03 in 2012.[47]
Graphs are unavailable due to technical issues. There is more info on Phabricator and on MediaWiki.org. |
| Total fertility rate (TFR) from 1552 to 1899 | |||||||||||||||||
|---|---|---|---|---|---|---|---|---|---|---|---|---|---|---|---|---|---|
| Years[37] | |||||||||||||||||
| 1552 | 1556 | 1560 | 1565 | 1570 | 1575 | 1580 | 1590 | 1595 | 1600 | 1605 | 1610 | 1615 | 1620 | 1625 | 1630 | 1640 | 1650 |
| 5.12 | 4.78 | 4.7 | 5.31 | 4.64 | 4.48 | 4.62 | 4.25 | 4.47 | 4.63 | 4.79 | 4.47 | 4.51 | 4.78 | 4.35 | 4.45 | 4.71 | 3.49 |
| 1660 | 1665 | 1670 | 1675 | 1680 | 1690 | 1695 | 1700 | 1705 | 1710 | 1715 | 1720 | 1725 | 1730 | 1735 | 1740 | 1750 | 1755 |
| 3.83 | 4.1 | 3.97 | 3.75 | 3.97 | 4.29 | 4.37 | 4.39 | 4.37 | 3.79 | 4.25 | 4.16 | 4.51 | 4.28 | 4.94 | 4.58 | 4.73 | 4.64 |
| 1760 | 1765 | 1770 | 1775 | 1780 | 1785 | 1790 | 1795 | 1797 | 1799 | 1800 | 1801 | 1802 | 1803 | 1804 | 1805 | 1806 | 1807 |
| 4.56 | 4.81 | 4.98 | 4.96 | 4.9 | 5.09 | 5.35 | 5.21 | 5.4 | 5.11 | 4.97 | 4.6 | 5.3 | 5.61 | 5.65 | 5.55 | 5.49 | 5.45 |
| 1808 | 1809 | 1810 | 1811 | 1812 | 1813 | 1814 | 1815 | 1816 | 1817 | 1818 | 1819 | 1820 | 1821 | 1822 | 1823 | 1824 | 1825 |
| 5.4 | 5.24 | 5.36 | 5.43 | 5.31 | 5.45 | 5.46 | 6.02 | 5.73 | 5.69 | 5.54 | 5.45 | 5.4 | 5.55 | 5.69 | 5.54 | 5.42 | 5.38 |
| 1826 | 1827 | 1828 | 1829 | 1830 | 1831 | 1832 | 1833 | 1834 | 1835 | 1836 | 1837 | 1838 | 1839 | 1840 | 1841 | 1842 | 1843 |
| 5.36 | 5.07 | 5.23 | 4.85 | 4.83 | 4.78 | 4.78 | 5 | 4.89 | 4.83 | 4.86 | 4.79 | 4.78 | 4.93 | 4.9 | 4.89 | 4.83 | 4.82 |
| 1844 | 1845 | 1846 | 1847 | 1848 | 1849 | 1850 | 1851 | 1852 | 1853 | 1854 | 1855 | 1856 | 1857 | 1858 | 1859 | 1860 | 1861 |
| 4.83 | 4.75 | 4.9 | 4.58 | 4.71 | 4.78 | 4.85 | 4.94 | 4.94 | 4.78 | 4.89 | 4.85 | 4.94 | 4.9 | 4.79 | 4.97 | 4.86 | 4.88 |
| 1862 | 1863 | 1864 | 1865 | 1866 | 1867 | 1868 | 1869 | 1870 | 1871 | 1872 | 1873 | 1874 | 1875 | 1876 | 1877 | 1878 | 1879 |
| 4.92 | 4.94 | 4.96 | 4.94 | 4.92 | 4.94 | 4.97 | 4.82 | 4.88 | 4.85 | 4.89 | 4.94 | 4.93 | 4.92 | 4.9 | 4.89 | 4.88 | 4.81 |
| 1880 | 1881 | 1882 | 1883 | 1884 | 1885 | 1886 | 1887 | 1888 | 1889 | 1890 | 1891 | 1892 | 1893 | 1894 | 1895 | 1896 | 1897 |
| 4.75 | 4.68 | 4.62 | 4.55 | 4.47 | 4.39 | 4.32 | 4.24 | 4.16 | 4.11 | 4.06 | 4 | 3.95 | 3.9 | 3.84 | 3.79 | 3.73 | 3.68 |
| 1898 | 1899 | ||||||||||||||||
| 3.62 | 3.58 | ||||||||||||||||
- Birth statistics
-
 Mean age of mother by birth order in England and Wales
 -
 Mean age of parents at birth in England and Wales
 -
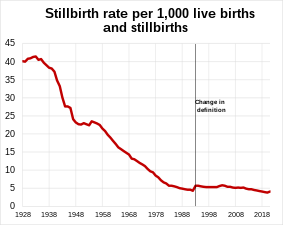 Stillbirth rate in England and Wales
 -
 Live births by age group in England and Wales
 -
 Percentage of women childless by age 30 in England and Wales by mothers year of birth
 -
 Average number of children by year of birth of the mothers in England and Wales
 -
 Percentage of births born outside of wedlock in England and Wales
 -
 Conception rate per 1000 women by age groups in England and Wales
 -
 Teenage conception rate per 1000 women in England and Wales


Mother's mean age at first birth[edit]
The first available data on when a mother gives birth for the first time was in 1920.[36]
The reduction of the total fertility rate of the United Kingdom has also had an effect on the mean age in which a mother gives birth to her first child.[45]
The age in which a mother gives birth to her first child has changed depending on the time period, but since the 1970s the age in which someone gives birth has been trending upwards.[45]
| Year | Mean age of childbearing |
|---|---|
| 1920 | 25.6 |
| 1941 | 23.8 |
| 1959 | 25.7 |
| 1960 | 27.8 |
| 1965 | 27.1 |
| 1970 | 26.3 |
| 1975 | 26.5 |
| 1980 | 26.9 |
| 1985 | 27.3 |
| 1990 | 27.7 |
| 2018 | 29 |
Family size[edit]
The reduction of the fertility rate has also had an effect on the general family size of mothers in the United Kingdom, with the two being interlinked with each other.[45] The family size of the average UK family can be estimated with a completed family size (CFS), which is an estimate of the amount of children a woman has birthed by the end of her childbearing years.[36]
Family size within the UK has shifted towards two or one children in recent decades, rather than in the past when larger family sizes were more prominent and sought after.[45] This pattern is similar to other European countries, where couples are having fewer children.[45] Increasingly, there are also more couples who are completely childless; this has been increasing since the 1950s.[45][50]
| No. of children | Years | ||||||||
|---|---|---|---|---|---|---|---|---|---|
| 1920 | 1925 | 1930 | 1935 | 1940 | 1945 | 1950 | 1955 | 1960 | |
| 0 | 21 | 17 | 13 | 12 | 11 | 10 | 14 | 17 | 21 |
| 1 | 21 | 22 | 18 | 15 | 13 | 13 | 12 | 12 | 12 |
| 2 | 27 | 28 | 30 | 32 | 37 | 43 | 43 | 40 | 35 |
| 3 | 16 | 17 | 19 | 21 | 22 | 21 | 20 | 20 | 21 |
| 4 or more | 15 | 16 | 20 | 20 | 17 | 13 | 11 | 11 | 11 |
| Average family size (Completed family size of all women) |
2 | 2.12 | 2.35 | 2.42 | 2.36 | 2.17 | 2.03 | 2.02 | 1.95 |
Life expectancy[edit]


Life expectancy has increased in the United Kingdom since the 18th century due to precipitate declines in child mortality, see below, and from relatively minor improvements in healthcare. A life expectancy of 40, the historical norm, does not mean that person is likely to die at 40 years old but rather when he or she is very old or very young; much in line with a bathtub curve.
At the start of the 20th century, the life expectancy at birth was only 45.6 years.[51]
By 1950, life expectancy at birth had risen to 68.6 years.[51] During the latter half of the century, further factors influenced the increase of life expectancy: diseases and the improvement of healthcare in the 1950s, decline in smoking in the mid-1970s and improvements in treating heart disease in the 1990s contributed to its decline.[52]
At the start of the 21st century, the life expectancy at birth was 77.8 years.[51]
In 2011 the life expectancy at birth of the UK was around 80.4 years,[51] but the rate of increase has been stalling.[52][53][54] Potential factors behind this may be austerity measures imposed in the beginning of the 2010s,[54][55] which coincidentally since then mortality rates have slowed down in decline[56] or older people dying off at faster rates than expected.[56] On the topic of austerity measures, Professor Richard Faragher has said that "It is possible to have high or rising life expectancy during austerity, as is the case in Japan. Similarly, you can have rising life expectancy despite high levels of inequality – this was the case in Britain from 1900-1950."[56] but noted that austerity measures to social services like the NHS, especially social care support for the elderly may be causing a stalling of life expectancy increase due to a decreased quality of life for older generations.[54][56]
| Life expectancy from 1543 to 2015 | |||||||||||||||||
|---|---|---|---|---|---|---|---|---|---|---|---|---|---|---|---|---|---|
| Years[57][51] | |||||||||||||||||
| 1543 | 1548 | 1553 | 1558 | 1563 | 1568 | 1573 | 1578 | 1583 | 1588 | 1593 | 1603 | 1608 | 1613 | 1618 | 1623 | 1628 | 1633 |
| 33.9 | 38.8 | 39.6 | 22.4 | 36.7 | 39.7 | 41.1 | 41.6 | 42.7 | 37.1 | 38.1 | 38.5 | 39.6 | 36.8 | 40.3 | 33.4 | 39.7 | 39.7 |
| 1638 | 1643 | 1648 | 1653 | 1658 | 1663 | 1668 | 1673 | 1678 | 1683 | 1688 | 1693 | 1698 | 1703 | 1713 | 1718 | 1723 | 1728 |
| 34.0 | 36.3 | 39.7 | 39.1 | 33.0 | 33.3 | 33.5 | 37.4 | 32.4 | 31.3 | 35.9 | 36.5 | 38.1 | 38.5 | 36.9 | 35.8 | 35.5 | 25.3 |
| 1733 | 1738 | 1743 | 1748 | 1753 | 1758 | 1763 | 1768 | 1773 | 1778 | 1783 | 1788 | 1793 | 1798 | 1803 | 1808 | 1813 | 1818 |
| 36.3 | 35.3 | 34.3 | 36.5 | 39.8 | 38.1 | 35.4 | 36.2 | 39.1 | 37.7 | 35.8 | 39.0 | 37.9 | 38.9 | 40.0 | 40.6 | 41.3 | 40.8 |
| 1823 | 1828 | 1833 | 1838 | 1842 | 1843 | 1844 | 1845 | 1846 | 1847 | 1848 | 1849 | 1850 | 1851 | 1852 | 1853 | 1854 | 1855 |
| 40.5 | 41.4 | 40.9 | 40.6 | 41.0 | 41.6 | 41.2 | 42.2 | 40.2 | 38.5 | 39.9 | 37.7 | 42.8 | 41.0 | 40.4 | 40.0 | 39.5 | 40.7 |
| 1856 | 1857 | 1858 | 1859 | 1860 | 1861 | 1862 | 1863 | 1864 | 1865 | 1866 | 1867 | 1868 | 1869 | 1870 | 1871 | 1872 | 1873 |
| 42.5 | 40.9 | 39.5 | 40.4 | 41.9 | 41.6 | 42.1 | 40.4 | 39.6 | 39.8 | 40.1 | 42.0 | 41.7 | 41.3 | 40.6 | 41.1 | 42.7 | 43.3 |
| 1874 | 1875 | 1876 | 1877 | 1878 | 1879 | 1880 | 1881 | 1882 | 1883 | 1884 | 1885 | 1886 | 1887 | 1888 | 1889 | 1890 | 1891 |
| 42.1 | 41.5 | 42.7 | 43.7 | 42.0 | 43.5 | 43.0 | 45.1 | 44.0 | 44.0 | 43.6 | 44.6 | 44.6 | 45.1 | 46.3 | 45.9 | 44.1 | 44.4 |
| 1892 | 1893 | 1894 | 1895 | 1896 | 1897 | 1898 | 1899 | 1900 | 1901 | 1902 | 1903 | 1904 | 1905 | 1906 | 1907 | 1908 | 1909 |
| 45.6 | 44.7 | 48.3 | 45.4 | 47.1 | 46.4 | 46.1 | 45.2 | 45.6 | 46.9 | 48.3 | 49.5 | 48.1 | 49.9 | 49.6 | 50.6 | 51.0 | 51.7 |
| 1910 | 1911 | 1912 | 1913 | 1914 | 1915 | 1916 | 1917 | 1918 | 1919 | 1920 | 1921 | 1922 | 1923 | 1924 | 1925 | 1926 | 1927 |
| 53.3 | 51.2 | 54.3 | 53.4 | 53.2 | 51.2 | 54.2 | 54.2 | 47.3 | 54.3 | 57.3 | 58.1 | 57.0 | 59.3 | 58.1 | 58.4 | 59.6 | 59.0 |
| 1928 | 1929 | 1930 | 1931 | 1932 | 1933 | 1934 | 1935 | 1936 | 1937 | 1938 | 1939 | 1940 | 1941 | 1942 | 1943 | 1944 | 1945 |
| 59.9 | 57.6 | 60.8 | 60.0 | 60.5 | 60.6 | 61.3 | 62.0 | 61.8 | 62.3 | 63.2 | 63.6 | 60.9 | 61.4 | 64.0 | 64.0 | 64.8 | 65.8 |
| 1946 | 1947 | 1948 | 1949 | 1950 | |||||||||||||
| 66.3 | 66.3 | 68.4 | 68.1 | 68.6 | |||||||||||||
| 1950–55 | 1955–60 | 1960–65 | 1965–70 | 1970–75 | 1975–80 | ||||||||||||
| 69.4 | 70.6 | 71.0 | 71.7 | 72.3 | 73.0 | ||||||||||||
| 1980–85 | 1985–90 | 1990–95 | 1995–2000 | 2000–05 | 2005–10 | ||||||||||||
| 74.2 | 75.1 | 76.3 | 77.2 | 78.4 | 79.7 | ||||||||||||
| 2010–15 | |||||||||||||||||
| 81.0 | |||||||||||||||||
Infant mortality[edit]

Infant mortality has been on the decline since the Second Industrial Revolution, although the majority of the decline came around from the start to the end of the 20th century.[58][59][60][61] In raw terms for example, infant mortality in England sat around 151 deaths to 1000 live births in 1901 but by the end of the century it had plummeted down to only 6 deaths per 1000 births.[59]
There are two general lines of thought which are usually taken from into analysing the decline of infant mortality rates, the first line of thought comes from social historians, who ascribe the decline of infant mortality to social phenomenons of the time such as the need for a healthy population for the sake of the nation's fighting capabilities and political issues surrounding women.[58] The second line of thought comes from demographers themselves which more or less ascribe the decline of infant mortality itself more to the general decline of mortality altogether in the society than any particular reason why.[58]
Physical unfitness during the Boer War came into national prominence as many recruits came back to be too medically unfit for service.[61][60] With this, In 1904, the Report of the Inter-Departmental Committee on Physical Deterioration was published[62][60][61] which listed large amounts of details of the failings of the British population, and for that matter government, in sustaining a healthy population.
The current rate of infant mortality in the United Kingdom is roughly around 3.82 deaths per 1,000 live births.[2]
Age structure[edit]


Interlinked with fertility and mortality, The age structure of the United Kingdom has varied with how rates of fertility and mortality have changed throughout the country's history. Due to the transition to an industrialised society, the United Kingdom has also undergone a 'demographic transition': that is to say, that it has gone from a high birth rate, high mortality rate society to a low birth rate, low mortality rate society over the space of two centuries.
Before the 18th century, the United Kingdom retained an age structure universal to societies in the first stage of the transition theory, with high fertility rates and high mortality rates,[4] in the late 18th century, the Industrial Revolution began, kickstarting the country's transition into the second phase: mortality rates declined but birth rates stayed at the same level;[4] by 1870, the country had begun to transition into the third phase:[4] the birth rate began to decline from around near 5 children per woman to below replacement level in the 1930s.[4] The fourth phase of the transition began in the 1960s, when the fertility rate rose, and peaked during the middle of the decade, and then collapsed by 1973 to a below replacement level rate. Since then, the rate has not risen to an above replacement level fertility rate; this has resulted in a population which is currently ageing:[4] in 2007, for the first time in the country's history, there were more people over the age of 60 than there were under the age of 16.[63]
Peaks and bands within the population represent different periods in which people were born, for example, a large peak of people in particularly for those aged 70–74 born following the Second World War and a wide band for those aged 50–59, born during the 1960s baby boom. Those aged 80 upwards would have been born in the 1930s baby dearth when the birth rate was below replacement level. On the younger band of the population there is a noticeable gap between the ages of 14 and 20, this due to at the beginning of the 21st century a lower number of children being born (and a subsequent lower TFR), however in the years following the birth rate rose during the 2010s and a 'broadening' of the pyramid began for those in the younger years leading to more children in those age cohorts. In relation to the sex ratio of the country, in the higher ages of the population, there are more women than men reflecting the higher life expectancies of women in the population, in the lower ages there are more men than women because there are slightly more boys than girls born each year.[64][65] In relation to the older age brackets, In 2015, there were estimated to be over half a million people (556,270) aged 90 and over living in the UK, up from 194,670 people in 1985,[66] and there were estimated to be 14,570 centenarians (people aged 100 or over) and 850 people aged 105 or over.[67] The Office of National Statistics has also wrote in their mid-2016 report on population projections that the median age of the British population was 40 years of age,[68] and this will continue to rise as more people in the population age and a below-replacement level fertility level not refilling the population. This will make the number of people aged 85 and over double from 1.6 million in mid-2016 to 3.2 million in mid-2041.[69]
The demographic ageing of the population is not evenly spread geographically, as people in rural areas are typically of a higher age than those living in metropolitan areas such as Greater London for example.[63]
Age structure of the population in 2020
- Population pyramids of each constituent country
-

 England (2020 estimate)
 -

 Scotland (2020 estimate)
 -

 Wales (2020 estimate)
 -
 Northern Ireland (2020 estimate)


- Age brackets as a percentage of the total population in local authorities in 2021
-
 Under 15 years oldLess than 15%15 to 18%18 to 20%Above 20%
 -
 16 to 64 years old (working age)Less than 60%60 to 65%65 to 70%Above 70%
 -
 Above the age of 65 years old5 to 15%15 to 20%20 to 25%25% and above


| Ages | 1976 | 1986 | 1999 | 2016 | 2019 |
|---|---|---|---|---|---|
| 0–15 years (%) | 24.5 | 20.5 | 20.4 | 18.9 | 19.0 |
| 16–64 years (%) | 61.2 | 64.1 | 63.8 | 63.1 | 62.5 |
| 65 years and over (%) | 14.2 | 15.4 | 15.8 | 18.0 | 18.5 |
| Median age | 1950 | 1960 | 1971 | 1981 | 1991 | 2000 | 2010 | 2020 | 2030 | 2040 | 2050 | 2060 | 2070 | 2080 | 2090 | 2100 |
|---|---|---|---|---|---|---|---|---|---|---|---|---|---|---|---|---|
| Total | 34.9 years | 35.6 years | 34.1 years | 34.5 years | 35.8 years | 37.6 years | 39.6 years | 40.6 years | 42.4 years | 43.8 years | 43.9 years | 44.7 years | 45.5 years | 46 years | 46.7 years | 47.7 years |
| Male | – | – | – | – | – | – | – | 39.6 years | – | – | – | – | – | – | – | – |
| Female | – | – | – | – | – | – | – | 41.7 years | – | – | – | – | – | – | – | – |
Urbanisation and population density[edit]
Population density[edit]
The United Kingdom is one of the most densely populated countries in Europe, in 2020 it was the 8th most densely populated country.[73]
The current largest metropolitan areas are listed below:
| Rank | Urban area | Pop. | Principal settlement | Rank | Urban area | Pop. | Principal settlement | ||
|---|---|---|---|---|---|---|---|---|---|
| 1 | Greater London | 9,787,426 | London | 11 | Bristol | 617,280 | Bristol | ||
| 2 | Greater Manchester | 2,553,379 | Manchester | 12 | Edinburgh | 512,150 | Edinburgh | ||
| 3 | West Midlands | 2,440,986 | Birmingham | 13 | Leicester | 508,916 | Leicester | ||
| 4 | West Yorkshire | 1,777,934 | Leeds | 14 | Belfast | 483,418 | Belfast | ||
| 5 | Greater Glasgow | 985,290 | Glasgow | 15 | Brighton & Hove | 474,485 | Brighton | ||
| 6 | Liverpool | 864,122 | Liverpool | 16 | South East Dorset | 466,266 | Bournemouth | ||
| 7 | South Hampshire | 855,569 | Southampton | 17 | Cardiff | 390,214 | Cardiff | ||
| 8 | Tyneside | 774,891 | Newcastle upon Tyne | 18 | Teesside | 376,633 | Middlesbrough | ||
| 9 | Nottingham | 729,977 | Nottingham | 19 | Stoke-on-Trent | 372,775 | Stoke-on-Trent | ||
| 10 | Sheffield | 685,368 | Sheffield | 20 | Coventry | 359,262 | Coventry | ||
Urbanisation[edit]

Rapid urbanisation began with the onset of the Industrial Revolution in the mid to late 18th century, shifting jobs and more importantly people away from rural Britain's dominance at the time which was primarily agricultural, to manufacturing jobs within urban areas which started to spring up.[77] In 1750, an estimated total of around only 1 million people lived in some sort of urban area such as a town or city,[78] which was around 1/6th of the estimated total population but a century later this had risen to 8 million people in 1850,[78] equating to just over half of the nation.[77][78]
While this mass urbanisation affected pre-existing cities to a large degree such as London, smaller and 'newer' towns were in particular effected by the re-distribution of the population and exploded in raw population growth.[77] Cities such as Birmingham, Bristol, Edinburgh, Glasgow, Liverpool, Manchester, Leeds, Sheffield and Newcastle for example had an explosive expansion in population numbers around the middle of the 19th century due to the industrial expansion of said cities bringing jobs and again people in for work.[79][78] London during the 19th century become noted as the 'premier city' of the world, being the most populated city from 1825 to 1900[80] and being the first city in Europe and one of the first in the world to reach the figure of one million inhabitants,[81] and then 5 million inhabitants.[80] This urbanisation in the 19th century has had two phases.[77] This mass influx of the population into the cities resulted in a centralisation of the population into the inner city areas however by the time of the late 19th century and early 20th century when technological advancements in transport kicked off allowing cities to expand their 'peripherals' from the inner areas to create large scale 'city regions' of their own.[77] London in particular during the 19th century had the majority of its population within the city living in the inner centre, however by the 20th century a massive expansion of 'Outer London' began which slowly became larger in population size by the middle of the century than Inner London.
By the end of the 20th century the figure of urbanisation was 80% of the country.[77] Importance in population size however of the capital declined during the latter half of the 20th century. By the end of the 20th century, London's ranking on the most populated cities of the world had fallen down to not even being in the top 20.[81]
The current classification of an 'urban' area, also termed as a 'built-up area' (BUA)[82] in the 2011 census, is a settlement which takes variables from both numerical population numbers and population density; in population numbers this is roughly more than or 10,000 people living in an area.[83][84] Anything below that is classified as 'rural', having several levels of distinction to define a rural town and fringe, village or hamlet which is usually taken from population density figures.[84] These areas are then defined within 'output areas' (OA's) themselves, which are geographic areas of the United Kingdom.[84][82] The population which resides within classified 'urban' areas was 84.4% of total population in 2022 and the annual rate of urbanisation change is estimated to be around 0.8% between 2020 and 2025.[2]
Vital statistics (1900–2023)[edit]


| Average population (Mid-year)[85] | Live births[86] |
Deaths | Natural change | Crude birth rate (per 1000)[87] |
Crude death rate (per 1000)[87] |
Natural change (per 1000) |
Crude migration change (per 1000) |
Total Fertility Rate[fn 2][37][2] | |
|---|---|---|---|---|---|---|---|---|---|
| 1900 | 41,154,600 | 1,089,487 | 695,867 | 393,620 | 26.5 | 16.9 | 9.6 | 3.53 | |
| 1901 | 41,538,200 | 1,092,781 | 655,646 | 437,135 | 26.3 | 15.8 | 10.5 | -1.2 | 3.49 |
| 1902 | 41,892,700 | 1,103,483 | 636,650 | 466,833 | 26.3 | 15.2 | 11.1 | -2.6 | 3.44 |
| 1903 | 42,246,600 | 1,113,086 | 613,726 | 499,360 | 26.3 | 14.5 | 11.8 | -3.4 | 3.40 |
| 1904 | 42,611,400 | 1,109,542 | 651,301 | 458,241 | 26 | 15.3 | 10.8 | -2.2 | 3.35 |
| 1905 | 42,980,800 | 1,092,108 | 617,516 | 474,592 | 25.4 | 14.4 | 11 | -2.3 | 3.30 |
| 1906 | 43,361,100 | 1,098,475 | 629,955 | 468,520 | 25.3 | 14.5 | 10.8 | -2.0 | 3.24 |
| 1907 | 43,737,800 | 1,077,851 | 625,271 | 452,580 | 24.6 | 14.3 | 10.3 | -1.6 | 3.19 |
| 1908 | 44,123,800 | 1,102,345 | 621,427 | 480,918 | 25 | 14.1 | 10.9 | -2.1 | 3.14 |
| 1909 | 44,519,500 | 1,073,781 | 614,910 | 458,871 | 24.1 | 13.8 | 10.3 | -1.3 | 3.07 |
| 1910 | 44,915,900 | 1,051,240 | 578,091 | 473,149 | 23.4 | 12.9 | 10.5 | -1.6 | 2.99 |
| 1911 | 42,189,800 | 1,033,395 | 620,828 | 412,567 | 24.5 | 14.7 | 9.8 | -70.5 | 2.92 |
| 1912 | 42,373,600 | 1,025,828 | 580,977 | 444,851 | 24.2 | 13.7 | 10.5 | -6.1 | 2.90 |
| 1913 | 42,582,300 | 1,032,286 | 600,554 | 431,732 | 24.2 | 14.1 | 10.1 | -5.2 | 2.93 |
| 1914 | 42,956,900 | 1,032,734 | 611,970 | 420,764 | 24 | 14.2 | 9.8 | -1.9 | 2.88 |
| 1915 | 41,361,500 | 956,877 | 666,322 | 290,555 | 23.1 | 16.1 | 7 | -44.1 | 2.59 |
| 1916 | 40,536,300 | 922,085 | 599,621 | 322,464 | 22.7 | 14.8 | 8 | -28.0 | 2.60 |
| 1917 | 39,780,700 | 790,736 | 589,416 | 201,320 | 19.9 | 14.8 | 5.1 | -23.7 | 2.10 |
| 1918 | 39,582,000 | 787,427 | 715,246 | 72,181 | 19.9 | 18.1 | 1.8 | -6.8 | 2.03 |
| 1919 | 42,944,100 | 826,202 | 602,188 | 224,014 | 19.2 | 18.1 | 5.2 | 79.7 | 2.31 |
| 1920 | 43,646,400 | 1,126,849 | 555,326 | 571,523 | 19.2 | 14 | 13.1 | 3.3 | 3.08 |
| 1921 | 43,904,100 | 1,001,725 | 544,140 | 457,585 | 22.8 | 12.4 | 10.4 | -4.5 | 2.69 |
| 1922 | 44,331,500 | 924,740 | 579,480 | 345,260 | 20.9 | 13.1 | 7.8 | 1.9 | 2.44 |
| 1923 | 44,563,100 | 900,130 | 526,858 | 373,272 | 20.2 | 11.8 | 8.4 | -3.2 | 2.38 |
| 1924 | 44,885,600 | 865,329 | 563,891 | 301,438 | 19.3 | 12.6 | 6.7 | 0,5 | 2.28 |
| 1925 | 45,040,000 | 842,405 | 558,132 | 284,273 | 18.7 | 12.4 | 6.3 | -2.9 | 2.20 |
| 1926 | 45,217,600 | 825,174 | 536,411 | 288,763 | 18.2 | 11.9 | 6.4 | -2.5 | 2.15 |
| 1927 | 45,432,000 | 777,520 | 568,655 | 208,865 | 17.1 | 12.5 | 4.6 | 0.1 | 2.01 |
| 1928 | 45,622,200 | 783,052 | 543,664 | 239,388 | 17.2 | 11.9 | 5.2 | -1.0 | 2.01 |
| 1929 | 45,731,000 | 761,963 | 623,231 | 138,732 | 16.7 | 13.6 | 3 | -0.6 | 1.95 |
| 1930 | 45,888,900 | 769,239 | 536,860 | 232,379 | 16.8 | 11.7 | 5.1 | -1.6 | 1.95 |
| 1931 | 46,073,600 | 749,974 | 573,908 | 176,066 | 16.3 | 12.5 | 3.8 | 0.2 | 1.89 |
| 1932 | 46,335,000 | 730,079 | 567,986 | 162,093 | 15.8 | 12.3 | 3.5 | 2.2 | 1.83 |
| 1933 | 46,520,000 | 691,560 | 579,467 | 112,093 | 14.9 | 12.5 | 2.4 | 1.6 | 1.72 |
| 1934 | 46,666,000 | 711,483 | 558,072 | 153,411 | 15.2 | 12 | 3.3 | -0.2 | 1.76 |
| 1935 | 46,869,500 | 711,426 | 561,324 | 150,102 | 15.2 | 12 | 3.2 | 1.2 | 1.75 |
| 1936 | 47,081,300 | 720,129 | 580,942 | 139,187 | 15.3 | 12.3 | 3 | 1.5 | 1.77 |
| 1937 | 47,288,600 | 723,779 | 597,798 | 125,981 | 15.3 | 12.6 | 2.7 | 1.7 | 1.79 |
| 1938 | 47,494,100 | 735,573 | 559,598 | 175,975 | 15.5 | 11.8 | 3.7 | 0.6 | 1.84 |
| 1939 | 47,547,700 | 726,632 | 581,857 | 144,775 | 15.3 | 12.2 | 3.0 | -1.9 | 1.84 |
| 1940 | 46,026,200 | 701,875 | 673,253 | 28,622 | 15.2 | 14.6 | 0.6 | -32.6 | 1.74 |
| 1941 | 44,870,400 | 695,726 | 627,378 | 68,348 | 15.5 | 14.0 | 1.5 | -26.6 | 1.72 |
| 1942 | 44,323,000 | 771,851 | 562,356 | 209,495 | 17.4 | 12.7 | 4.7 | -16.9 | 1.93 |
| 1943 | 48,261,000 | 810,524 | 585,582 | 224,942 | 16.8 | 12.1 | 4.7 | 84.1 | 2.03 |
| 1944 | 48,261,600 | 878,298 | 573,570 | 303,728 | 18.2 | 11.9 | -6.3 | 6.3 | 2.25 |
| 1945 | 48,668,900 | 795,868 | 567,027 | 228,841 | 16.4 | 11.7 | 4.7 | 3.7 | 2.05 |
| 1946 | 48,987,800 | 955,266 | 573,361 | 381,905 | 19.5 | 11.7 | 7.8 | -1.2 | 2.47 |
| 1947 | 49,538,700 | 1,025,427 | 600,728[88] | 424,699 | 20.7 | 12.1 | 8.6 | 2.6 | 2.69 |
| 1948 | 50,033,200 | 905,182 | 546,002 | 359,180 | 18.1 | 10.9 | 7.2 | 2.8 | 2.39 |
| 1949 | 50,331,000 | 855,298 | 589,876 | 265,422 | 17 | 11.7 | 5.3 | 0.7 | 2.26 |
| 1950 | 50,381,500[89] | 818,421 | 590,136 | 228,285 | 16.2 | 11.7 | 4.5 | -3.5 | 2.08 |
| 1951 | 50,286,900 | 796,645 | 632,786 | 163,859 | 15.8 | 12.6 | 3.3 | -5.2 | 2.10 |
| 1952 | 50,429,200 | 792,917 | 573,806 | 219,111 | 15.7 | 11.4 | 4.3 | -1.5 | 2.15 |
| 1953 | 50,592,900 | 804,269 | 577,220 | 227,049 | 15.9 | 11.4 | 4.5 | -1.3 | 2.20 |
| 1954 | 50,764,900 | 794,769 | 578,400 | 216,369 | 15.7 | 11.4 | 4.3 | -0.9 | 2.26 |
| 1955 | 50,946,100 | 789,315 | 595,916 | 193,399 | 15.5 | 11.7 | 3.8 | -0.2 | 2.33 |
| 1956 | 51,183,500 | 825,137 | 597,981 | 227,156 | 16.1 | 11.7 | 4.4 | 0.3 | 2.40 |
| 1957 | 51,430,200 | 851,466 | 591,200 | 260,266 | 16.6 | 11.5 | 5.1 | -0.3 | 2.48 |
| 1958 | 51,652,500 | 870,497 | 604,040 | 266,457 | 16.9 | 11.7 | 5.2 | -0.9 | 2.55 |
| 1959 | 51,956,300 | 878,561 | 606,115 | 272,446 | 16.9 | 11.7 | 5.2 | 0.7 | 2.63 |
| 1960 | 52,372,500 | 918,286 | 603,328 | 314,958 | 17.5 | 11.5 | 6.0 | 2.0 | 2.71 |
| 1961 | 52,807,400 | 944,365 | 631,788 | 312,577 | 17.9 | 12.0 | 5.9 | 2.4 | 2.78 |
| 1962 | 53,291,800 | 975,635 | 636,051 | 339,584 | 18.3 | 11.9 | 6.4 | 2.8 | 2.87 |
| 1963 | 53,624,900 | 990,160 | 654,288 | 335,872 | 18.5 | 12.2 | 6.3 | 0 | 2.90 |
| 1964 | 53,990,800 | 1,014,672 | 611,130 | 403,542 | 18.8 | 11.3 | 7.5 | -0.7 | 2.95 |
| 1965 | 54,349,500 | 997,275 | 627,798 | 369,477 | 18.3 | 11.6 | 6.8 | -0.2 | 2.88 |
| 1966 | 54,642,700 | 979,587 | 643,754 | 335,833 | 17.9 | 11.8 | 6.1 | -0.7 | 2.80 |
| 1967 | 54,959,000 | 961,800 | 616,710 | 345,090 | 17.5 | 11.2 | 6.3 | -0.5 | 2.69 |
| 1968 | 55,213,500 | 947,231 | 655,998 | 291,233 | 17.2 | 11.9 | 5.3 | -0.7 | 2.61 |
| 1969 | 55,460,600 | 920,256 | 659,537 | 260,719 | 16.6 | 11.9 | 4.7 | -0.2 | 2.51 |
| 1970 | 55,632,200 | 903,907 | 655,385 | 248,522 | 16.2 | 11.8 | 4.5 | -1.4 | 2.44 |
| 1971 | 55,928,000 | 901,648 | 645,078 | 256,570 | 16.1 | 11.5 | 4.6 | 0.7 | 2.40 |
| 1972 | 56,096,000 | 833,984 | 673,938 | 160,046 | 14.9 | 12.0 | 2.9 | 0.1 | 2.20 |
| 1973 | 56,223,000 | 779,545 | 669,692 | 109,853 | 13.9 | 11.9 | 2.0 | 0.4 | 2.03 |
| 1974 | 56,235,000 | 737,138 | 667,359 | 69,779 | 13.1 | 11.9 | 1.2 | -1.0 | 1.92 |
| 1975 | 56,225,000 | 697,518 | 662,477 | 35,041 | 12.4 | 11.8 | 0.6 | -0.8 | 1.81 |
| 1976 | 56,216,000 | 675,526 | 680,799 | -5,273 | 12.0 | 12.1 | -0.1 | -0.1 | 1.74 |
| 1977 | 56,189,000 | 657,038 | 655,143 | 1,895 | 11.7 | 11.7 | 0.0 | -0.5 | 1.69 |
| 1978 | 56,178,000 | 686,952 | 667,177 | 19,775 | 12.2 | 11.9 | 0.4 | -0.6 | 1.75 |
| 1979 | 56,240,000 | 734,572 | 675,576 | 58,996 | 13.1 | 12.0 | 1.0 | 0.1 | 1.86 |
| 1980 | 56,329,000 | 753,708 | 661,519 | 92,189 | 13.4 | 11.7 | 1.6 | 0 | 1.90 |
| 1981 | 56,357,000 | 730,712 | 657,974 | 72,738 | 13.0 | 11.7 | 1.3 | -0.8 | 1.82 |
| 1982 | 56,290,000 | 718,999 | 662,081 | 56,918 | 12.8 | 11.8 | 1.0 | -2.2 | 1.78 |
| 1983 | 56,315,000 | 721,238 | 659,101 | 62,137 | 12.8 | 11.7 | 1.1 | -0.7 | 1.77 |
| 1984 | 56,409,000 | 729,401 | 644,918 | 84,483 | 12.9 | 11.4 | 1.5 | 0.2 | 1.77 |
| 1985 | 56,554,000 | 750,520 | 670,656 | 79,864 | 13.3 | 11.9 | 1.4 | 1.2 | 1.79 |
| 1986 | 56,683,000 | 754,805 | 660,735 | 94,070 | 13.3 | 11.7 | 1.7 | 0.6 | 1.78 |
| 1987 | 56,804,000 | 775,405 | 644,342 | 131,063 | 13.7 | 11.3 | 2.3 | -0.2 | 1.81 |
| 1988 | 56,916,000 | 787,303 | 649,178 | 138,125 | 13.8 | 11.4 | 2.4 | -0.4 | 1.82 |
| 1989 | 57,076,000 | 777,036 | 657,733 | 119,303 | 13.6 | 11.5 | 2.1 | 0.7 | 1.79 |
| 1990 | 57,237,500 | 798,364 | 641,799 | 156,565 | 13.9 | 11.2 | 2.7 | 0.1 | 1.83 |
| 1991 | 57,438,700 | 792,269 | 646,181 | 146,088 | 13.8 | 11.3 | 2.5 | 1.0 | 1.82 |
| 1992 | 57,584,500 | 780,779 | 634,238 | 146,541 | 13.6 | 11.0 | 2.5 | 0 | 1.79 |
| 1993 | 57,713,900 | 761,526 | 658,194 | 103,332 | 13.2 | 11.4 | 1.8 | 0.4 | 1.76 |
| 1994 | 57,862,100 | 750,480 | 626,222 | 124,258 | 13.0 | 10.8 | 2.1 | 0.5 | 1.74 |
| 1995 | 58,024,800 | 731,882 | 641,712 | 90,170 | 12.6 | 11.1 | 1.6 | 1.2 | 1.71 |
| 1996 | 58,164,400 | 733,163 | 638,879 | 94,284 | 12.6 | 11.0 | 1.6 | 0,8 | 1.73 |
| 1997 | 58,314,200 | 726,622 | 632,517 | 94,105 | 12.5 | 10.8 | 1.6 | 1.0 | 1.72 |
| 1998 | 58,474,900 | 716,888 | 627,592 | 89,296 | 12.3 | 10.7 | 1.5 | 1.3 | 1.71 |
| 1999 | 58,684,400 | 699,976 | 629,476 | 70,500 | 11.9 | 10.7 | 1.2 | 2.4 | 1.68 |
| 2000 | 58,886,100 | 679,029 | 610,579 | 68,450 | 11.5 | 10.4 | 1.2 | 2.2 | 1.64 |
| 2001 | 59,113,000 | 669,123 | 604,393 | 64,730 | 11.3 | 10.2 | 1.1 | 2.8 | 1.63 |
| 2002 | 59,365,700 | 668,777 | 608,045 | 60,732 | 11.3 | 10.2 | 1.0 | 3.3 | 1.63 |
| 2003 | 59,636,700 | 695,549 | 612,085 | 83,464 | 11.7 | 10.3 | 1.4 | 3.2 | 1.70 |
| 2004 | 59,950,400 | 715,996 | 584,791 | 131,205 | 11.9 | 9.8 | 2.2 | 3.1 | 1.77 |
| 2005 | 60,413,300 | 722,549 | 582,964 | 139,585 | 12.0 | 9.6 | 2.3 | 5.4 | 1.76 |
| 2006 | 60,827,100 | 748,563 | 572,224 | 176,339 | 12.3 | 9.4 | 2.9 | 3.9 | 1.82 |
| 2007 | 61,319,100 | 772,245 | 574,687 | 197,558 | 12.6 | 9.4 | 3.2 | 4.9 | 1.87 |
| 2008 | 61,823,800 | 794,383 | 579,697 | 214,686 | 12.8 | 9.4 | 3.5 | 4.7 | 1.96 |
| 2009 | 62,260,500 | 790,204 | 559,617 | 230,587 | 12.7 | 9.0 | 3.7 | 3.4 | 1.89 |
| 2010 | 62,759,500 | 807,721 | 561,666 | 246,055 | 12.9 | 8.9 | 3.9 | 4.1 | 1.92 |
| 2011 | 63,285,100 | 807,776 | 552,232 | 255,544 | 12.8 | 8.7 | 4.0 | 4.4 | 1.91 |
| 2012 | 63,705,000 | 812,970 | 569,024 | 243,946 | 12.8 | 8.9 | 3.8 | 2.8 | 1.92 |
| 2013 | 64,105,700 | 778,803 | 575,458 | 203,345 | 12.1 | 9.0 | 3.2 | 3.1 | 1.83 |
| 2014 | 64,596,800 | 776,352 | 570,341 | 206,011 | 12.0 | 8.8 | 3.2 | 4.5 | 1.82 |
| 2015 | 65,110,000 | 777,165 | 602,782 | 174,383 | 11.9 | 9.3 | 2.7 | 5.2 | 1.80 |
| 2016 | 65,648,100 | 774,835 | 595,659 | 179,176 | 11.8 | 9.1 | 2.7 | 5.6 | 1.79 |
| 2017 | 66,040,200 | 755,066 | 607,172 | 147,894 | 11.4 | 9.2 | 2.2 | 3.8 | 1.74 |
| 2018 | 66,435,600 | 731,213 | 616,014 | 115,199 | 11.0 | 9.3 | 1.7 | 4.3 | 1.68 |
| 2019 | 66,796,800 | 712,699 | 604,707 | 107,992 | 10.7 | 9.1 | 1.6 | 3.8 | 1.63 |
| 2020 | 67,081,234 | 681,560 | 689,629 | -8,069 | 10.2 | 10.3 | -0.1 | 4.4 | 1.56 |
| 2021 | 67,026,292 | 694,685 | 666,659 | 28,026 | 10.3 | 9.9 | 0.4 | -1.2 | 1.54[90] |
| 2022 | 67,596,300 | 673,141 | 657,278[91][92][93] | 15,863 | 10.0 | 9.7 | 0.3 | ||
| 2023 | 660,275[94][95][96] |
Current vital statistics[edit]
| Period | Live births | Deaths[97][98][99] | Natural increase |
|---|---|---|---|
| January 2023 | 74,516 | ||
| January 2024 | 65,625 | ||
| Difference |
Structure of the population[edit]
| Age Group | Male | Female | Total | % |
|---|---|---|---|---|
| Total | 31 028 143 | 32 154 035 | 63 182 178 | 100 |
| 0–4 | 2 002 494 | 1 911 459 | 3 913 953 | 6.19 |
| 5–9 | 1 799 999 | 1 716 616 | 3 516 615 | 5.57 |
| 10–14 | 1 878 838 | 1 790 488 | 3 669 326 | 5.81 |
| 15–19 | 2 040 725 | 1 955 727 | 3 996 452 | 6.33 |
| 20–24 | 2 164 141 | 2 133 057 | 4 297 198 | 6.80 |
| 25–29 | 2 145 054 | 2 161 286 | 4 306 340 | 6.82 |
| 30–34 | 2 059 312 | 2 066 137 | 4 125 449 | 6.53 |
| 35–39 | 2 082 310 | 2 112 167 | 4 194 477 | 6.64 |
| 40–44 | 2 283 902 | 2 341 733 | 4 625 635 | 7.32 |
| 45–49 | 2 293 572 | 2 349 528 | 4 643 100 | 7.35 |
| 50–54 | 2 028 748 | 2 065 706 | 4 094 454 | 6.48 |
| 55–59 | 1 785 598 | 1 828 480 | 3 614 078 | 5.72 |
| 60–64 | 1 868 912 | 1 939 062 | 3 807 974 | 6.03 |
| 65-69 | 1 463 355 | 1 554 125 | 3 017 480 | 4.78 |
| 70-74 | 1 162 621 | 1 300 124 | 2 462 745 | 3.90 |
| 75-79 | 903 433 | 1 102 586 | 2 006 019 | 3.17 |
| 80-84 | 615 163 | 883 733 | 1 498 896 | 2.37 |
| 85-89 | 324 063 | 594 280 | 918 343 | 1.45 |
| 90-94 | 104 072 | 264 353 | 368 425 | 0.58 |
| 95-99 | 19 756 | 73 195 | 92 951 | 0.15 |
| 100+ | 2 075 | 10 193 | 12 268 | 0.02 |
| Age group | Male | Female | Total | Per cent |
| 0–14 | 5 681 331 | 5 418 563 | 11 099 894 | 17.57 |
| 15–64 | 20 752 274 | 20 952 883 | 41 705 157 | 66.01 |
| 65+ | 4 594 538 | 5 782 589 | 10 377 127 | 16.42 |
| Age Group | Male | Female | Total | % |
|---|---|---|---|---|
| Total | 33 145 709 | 33 935 525 | 67 081 234 | 100 |
| 0–4 | 1 941 390 | 1 840 940 | 3 782 330 | 5.64 |
| 5–9 | 2 125 958 | 2 021 455 | 4 147 413 | 6.18 |
| 10–14 | 2 073 515 | 1 971 599 | 4 045 114 | 6.03 |
| 15–19 | 1 893 268 | 1 790 412 | 3 683 680 | 5.49 |
| 20–24 | 2 132 032 | 2 001 126 | 4 133 158 | 6.16 |
| 25–29 | 2 280 809 | 2 195 821 | 4 476 630 | 6.67 |
| 30–34 | 2 263 511 | 2 258 464 | 4 521 975 | 6.74 |
| 35–39 | 2 179 535 | 2 224 565 | 4 404 100 | 6.57 |
| 40–44 | 2 032 071 | 2 059 472 | 4 091 543 | 6.10 |
| 45–49 | 2 126 397 | 2 177 570 | 4 303 967 | 6.42 |
| 50–54 | 2 269 897 | 2 346 120 | 4 616 017 | 6.88 |
| 55–59 | 2 216 617 | 2 294 234 | 4 510 851 | 6.72 |
| 60–64 | 1 888 526 | 1 967 292 | 3 855 818 | 5.75 |
| 65-69 | 1 624 419 | 1 730 962 | 3 355 381 | 5.00 |
| 70-74 | 1 606 864 | 1 757 042 | 3 363 906 | 5.01 |
| 75-79 | 1 114 488 | 1 289 271 | 2 403 759 | 3.58 |
| 80-84 | 759 183 | 967 040 | 1 726 223 | 2.57 |
| 85-89 | 420 012 | 629 854 | 1 049 866 | 1.57 |
| 90-94 | 162 110 | 308 580 | 470 670 | 0.70 |
| 95-99 | 32 420 | 91 300 | 123 710 | 0.18 |
| 100+ | 2 700 | 12 420 | 15 120 | 0.02 |
| Age group | Male | Female | Total | Per cent |
| 0–14 | 6 140 863 | 5 833 994 | 11 974 857 | 17.85 |
| 15–64 | 21 282 650 | 21 315 062 | 42 597 712 | 63.50 |
| 65+ | 5 722 196 | 6 786 469 | 12 508 665 | 18.65 |
Births in England and Wales by place of birth of parents[edit]
Parents’ country of birth:[101]
| Place of birth of parent | Number of births by place of birth of father (% of total births)(2010) | (2011) | (2012) | (2013) | (2014) | (2015) | (2016) | (2017) | (2018) | (2019) | (2020) | (2021) | (2022) | Number of births by place of birth of mother (% of total births) (2010) | (2011) | (2012) | (2013) | (2014) | (2015) | (2016) | (2017) | (2018) | (2019) | (2020) | (2021) | (2022) |
| Total | 723 165 (100) | 723 913 (100) | 729 674 (100) | 698 512 (100) | 695 233 (100) | 697 852 (100) | 696 271 (100) | 679 106 (100) | 657 076 (100) | 640 370 (100) | 613 936 (100) | 624 828 (100) | 605 479 (100) | 723 165 (100) | 723 913 (100) | 729 674 (100) | 698 512 (100) | 695 233 (100) | 697 852 (100) | 696 271 (100) | 679 106 (100) | 657 076 (100) | 64 0370 (100) | 613 936 (100) | 624 828 (100) | 605 479 (100) |
| United Kingdom | 511 264 (70.70) | 510 370 (70.50) | 512 136 (70.19) | 487 046 (69.73) | 482 314 (69.37) | 481 227 (68.96) | 476 354 (68.42) | 462 923 (68.17) | 448 411 (68.24) | 434 113 (67.79) | 413 208 (67.30) | 427 313 (68.39) | 402 503 (66.48) | 541 321 (74.85) | 539 364 (74.51) | 540 572 (74.08) | 513 411 (73.50) | 507 587 (73.01) | 505 588 (72.45) | 499 974 (71.81) | 486 417 (71.63) | 471 476 (71.75) | 456 328 (71.26) | 434 024 (70.70) | 445 055 (71.23) | 422 109 (69.71) |
| Total outside United Kingdom | 169 393 (23.42) | 171 702 (23.72) | 175 639 (24.07) | 172 139 (24.64) | 175 118 (25.19) | 179 795 (25.76) | 183 764 (26.39) | 180 951 (26.65) | 174 579 (26.57) | 173 119 (27.03) | 168 742 (27.49) | 168 476 (26.96) | 173 197 (28.60) | 181 827 (25.14) | 184 529 (25.49) | 189 079 (25.91) | 185 075 (26.50) | 187 610 (26.99) | 192 227 (27.55) | 196 254 (28.19) | 192 651 (28.37) | 185 569 (28.24) | 184 003 (28.73) | 179 881 (29.30) | 179 726 (28.76) | 183 309 (30.28) |
| Not Stated | 42 508 (5.88) | 41 841 (5.78) | 41 899 (5.74) | 39 327 (5.63) | 37 801 (5.44) | 36 830 (5.28) | 36 153 (5.19) | 35 232 (5.19) | 34 086 (5.19) | 33 138 (5.17) | 31 986 (5.21) | 29 039 (4.65) | 29 779 (4.92) | 17 (0.00) | 20 (0.00) | 23 (0.00) | 26 (0.00) | 36 (0.00) | 37 (0.00) | 43 (0.00) | 38 (0.00) | 31 (0.00) | 39 (0.00) | 31 (0.01) | 47 (0.01) | 61 (0.01) |
| Total outside United Kingdom detail : | ||||||||||||||||||||||||||
| EU | 41 269 (5.71) | 43 335 (5.99) | 46 418 (6.36) | 47 607 (6.82) | 50 512 (7.27) | 55 334 (7.93) | 57 858 (8.31) | 58 565 (8.62) | 57 540 (8.76) | 55 626 (8.69) | 52 325 (8.52) | 51 720 (8.28) | 47 423 (7.83) | 52 699 (7.29) | 55 058 (7.61) | 58 911 (8.07) | 60 448 (8.65) | 64 067 (9.22) | 69 070 (9.90) | 71 669 (10.29) | 71 472 (10.52) | 69 775 (10.62) | 67 645 (10.56) | 63 732 (10.38) | 62 992 (10.08) | 58 037 (9.59) |
| Germany | 4 368 (0.60) | 4 298 (0.59) | 4 187 (0.57) | 3 957 (0.57) | 3 988 (0.57) | 3 972 (0.57) | 3 875 (0.56) | 3 687 (0.54) | 3 653 (0.56) | 3 198 (0.50) | 3 107 (0.51) | 5 328 (0.74) | 5 108 (0.71) | 5 064 (0.69) | 4 838 (0.69) | 4 708 (0.68) | 4 667 (0.67) | 4 560 (0.65) | 4 245 (0.63) | 3 917 (0.60) | 3 816 (0.60) | 3 609 (0.59) | 3 511 (0.56) | 3 154 (0.52) | ||
| New EU | 25 758 (3.56) | 27 962 (3.86) | 30 695 (4.21) | 31 992 (4.58) | 34 139 (4.91) | 38 009 (5.45) | 39 985 (5.74) | 40 636 (5.98) | 39 933 (6.08) | 38 490 (6.01) | 35 651 (5.81) | 34 666 (5.55) | 31 515 (5.20) | 34 194 (4.73) | 37 063 (5.12) | 40 821 (5.59) | 42 523 (6.09) | 45 344 (6.52) | 49 642 (7.11) | 51 962 (7.46) | 51 863 (7.64) | 50 840 (7.74) | 48 716 (7.61) | 45 034 (7.34) | 43 823 (7.01) | 39 896 (6.59) |
| Romania | 3 867 (0.53) | 4 387 (0.63) | 5 414 (0.78) | 7 856 (1.13) | 10 684 (1.53) | 12 856 (1.89) | 14 269 (2.17) | 15 211 (2.38) | 14 791 (2.41) | 15 099 (2.42) | 14 651 (2.42) | 4 406 (0.60) | 4 956 (0.71) | 6 102 (0.88) | 8 734 (1.25) | 11 721 (1.68) | 13 717 (2.02) | 15 196 (2.31) | 16 069 (2.51) | 15 713 (2.56) | 15 894 (2.54) | 15 518 (2.56) | ||||
| Poland | 15 619 (2.16) | 16 150 (2.23) | 16 432 (2.25) | 16 436 (2.35) | 16 950 (2.44) | 17 704 (2.54) | 16 956 (2.44) | 15 610 (2.30) | 13 838 (2.11) | 12 041 (1.88) | 10 542 (1.72) | 9 458 (1.51) | 7 613 (1.26) | 19 762 (2.73) | 20 495 (2.83) | 21 156 (2.90) | 21 275 (3.05) | 22 122 (3.18) | 22 928 (3.29) | 22 382 (3.21) | 20 779 (3.06) | 18 765 (2.86) | 16 737 (2.61) | 14 633 (2.38) | 13 373 (2.14) | 11 107 (1.83) |
| Lithuania | 3 512 (0.50) | 3 454 (0.51) | 3 788 (0.52) | 4 535 (0.62) | 4 595 (0.66) | 4 786 (0.69) | 4 872 (0.70) | 4 912 (0.71) | 4 803 (0.71) | 4 517 (0.69) | 4 133 (0.65) | 3 619 (0.59) | 3 499 (0.56) | |||||||||||||
| Rest of Europe (non EU) | 7 392 (1.02) | 7 276 (1.01) | 7 705 (1.06) | 7 608 (1.09) | 8 185 (1.18) | 8 776 (1.26) | 9 289 (1.33) | 9 552 (1.41) | 9 697 (1.48) | 10 553 (1.65) | 10 765 (1.75) | 11 346 (1.82) | 11 557 (1.91) | 7 548 (1.04) | 7 537 (1.04) | 7 890 (1.08) | 7 959 (1.14) | 8 562 (1.23) | 9 208 (1.32) | 9 930 (1.43) | 10 385 (1.53) | 10 599 (1.61) | 11 418 (1.78) | 11 574 (1.89) | 11 974 (1.92) | 12 053 (1.99) |
| Albania | 3 344 (0.54) | 3 768 (0.62) | 3 260 (0.52) | 3 515 (0.58) | ||||||||||||||||||||||
| Africa | 40 816 (5.64) | 39 746 (5.49) | 39 026 (5.35) | 37 563 (5.38) | 37 067 (5.33) | 36 876 (5.28) | 36 667 (5.27) | 35 459 (5.22) | 33 741 (5.14) | 33 375 (5.21) | 32 197 (5.24) | 31 800 (5.09) | 35 053 (5.79) | 39 828 (5.51) | 38 523 (5.32) | 37 837 (5.19) | 36 264 (5.19) | 35 030 (5.04) | 34 960 (5.01) | 34 437 (4.95) | 32 875 (4.84) | 31 158 (4.74) | 30 753 (4.80) | 29 660 (4.83) | 29 150 (4.67) | 32 315 (5.34) |
| North Africa | 4 939 (0.68) | 4 650 (0.64) | 4 504 (0.62) | 4 632 (0.66) | 4 737 (0.68) | 4 760 (0.68) | 4 762 (0.68) | 4 669 (0.69) | 4 669 (0.71) | 4 874 (0.76) | 4 808 (0.78) | 4 531 (0.73) | 4 720 (0.78) | 3 839 (0.53) | 3 562 (0.49) | 3 488 (0.48) | 3 661 (0.52) | 3 733 (0.54) | 3 853 (0.55) | 3 901 (0.56) | 3 907 (0.58) | 3 945 (0.60) | 4 145 (0.65) | 4 270 (0.70) | 4 006 (0.64) | 4 256 (0.70) |
| Western Africa | 14 240 (1.97) | 14 336 (1.98) | 14 546 (1.99) | 14 314 (2.05) | 14 508 (2.09) | 14 350 (2.06) | 14 383 (2.07) | 13 733 (2.02) | 13 246 (2.02) | 12 992 (2.03) | 12 689 (2.07) | 12 828 (2.05) | 15 696 (2.59) | 13 217 (1.83) | 13 067 (1.81) | 13 344 (1.83) | 12 906 (1.85) | 12 613 (1.81) | 12 472 (1.79) | 12 254 (1.76) | 11 381 (1.68) | 10 809 (1.65%) | 10 625 (1.66) | 10 468 (1.71) | 10 487 (1.68) | 13 313 (2.20) |
| Nigeria | 8 129 (1.12) | 8 335 (1.15) | 8 628 (1.18) | 8 397 (1.20) | 8 467 (1.22) | 8 339 (1.19) | 8 208 (1.18) | 7 821 (1.15) | 7 494 (1.14) | 7 201 (1.12) | 7 124 (1.16) | 7 492 (1.20) | 10 042 (1.66) | 7 332 (1.01) | 7 476 (1.03) | 7 685 (1.05) | 7 267 (1.04) | 7 030 (1.01) | 6 829 (0.98) | 6 635 (0.95) | 6 074 (0.89) | 5 769 (0.88) | 5 634 (0.88) | 5 575 (0.91) | 5 907 (0.95) | 8 458 (1.40) |
| Ghana | 3 487 (0.48) | 3 346 (0.46) | 3 545 (0.51) | 3 405 (0.52) | 3 366 (0.53) | 3 241 (0.53) | 3 085 (0.49) | 3 418 (0.56) | 3 566 (0.49) | |||||||||||||||||
| Central Africa | 2 468 (0.34) | 2 271 (0.31) | 2 228 (0.31) | 2 196 (0.31) | 2 212 (0.32) | 2 212 (0.32) | 2 216 (0.32) | 2 248 (0.33) | 2 126 (0.32) | 2 033 (0.32) | 1 926 (0.31) | 1 805 (0.29) | 1 950 (0.32) | 2 599 (0.36) | 2 364 (0.33) | 2 356 (0.32) | 2 288 (0.33) | 2 275 (0.33) | 2 343 (0.34) | 2 247 (0.32) | 2 245 (0.33) | 2 117 (0.32%) | 2 075 (0.32) | 1 890 (0.31) | 1 838 (0.29) | 1 848 (0.31) |
| Eastern Africa | 14 427 (1.99) | 13 930 (1.92) | 13 172 (1.81) | 12 280 (1.76) | 11 656 (1.68) | 11 719 (1.68) | 11 510 (1.65) | 11 145 (1.64) | 10 350 (1.58) | 10 224 (1.60) | 9 529 (1.55) | 9 340 (1.49) | 9 514 (1.57) | 15 417 (2.13) | 14 800 (2.04) | 14 149 (1.94) | 13 305 (1.90) | 12 586 (1.81) | 12 499 (1.79) | 12 371 (1.78) | 11 899 (1.75) | 11 017 (1.68%) | 10 759 (1.68) | 10 013 (1.63) | 9 751 (1.56) | 9 895 (1.63) |
| Somalia | 5 311 (0.73) | 5 171 (0.71) | 4 877 (0.67) | 4 540 (0.65) | 4 334 (0.62) | 4 286 (0.61) | 4 346 (0.62) | 4 139 (0.61) | 3 635 (0.55) | 3 586 (0.56) | 3 289 (0.54) | 3 168 (0.51) | 3 039 (0.50) | 5 882 (0.81) | 5 654 (0.78) | 5 300 (0.73) | 4 897 (0.70) | 4 696 (0.68) | 4 636 (0.66) | 4 621 (0.66) | 4 390 (0.65) | 3 765 (0.57) | 3 698 (0.58) | 3 347 (0.55) | ||
| Southern Africa | 4 633 (0.64) | 4 465 (0.62) | 4 477 (0.61) | 4 051 (0.58) | 3 887 (0.56) | 3 767 (0.54) | 3 736 (0.54) | 3 612 (0.53) | 3 305 (0.50) | 3 208 (0.50) | 3 204 (0.52) | 3 238 (0.52) | 3 127 (0.52) | 4 675 (0.65) | 4 651 (0.64) | 4 425 (0.61) | 4 032 (0.58) | 3 765 (0.54) | 3 743 (0.54) | 3 613 (0.52) | 3 395 (0.50) | 3 231 (0.49) | 3 113 (0.49) | 2 985 (0.49) | 3 018 (0.48) | 2 952 (0.49) |
| South Africa | 4 485 (0.62) | 4 325 (0.60) | 4 337 (0.59) | 3 885 (0.56) | 3 744 (0.54) | 3 618 (0.52) | 3 559 (0.51) | 3 473 (0.51) | 3 178 (0.48) | 4 456 (0.62) | 4 430 (0.61) | 4 231 (0.58) | 3 824 (0.55) | 3 537 (0.51) | ||||||||||||
| The Americas and the Caribbean | 10 865 (1.50) | 10 673 (1.47) | 10 861 (1.49) | 10 196 (1.46) | 10 541 (1.52) | 10 360 (1.48) | 10 606 (1.52) | 10 236 (1.51) | 10 061 (1.53) | 10 030 (1.57) | 9 844 (1.60) | 10 169 (1.63) | 10 259 (1.69) | 11 494 (1.59) | 11 286 (1.56) | 11 317 (1.55) | 10 933 (1.57) | 11 191 (1.61) | 11 346 (1.63) | 11 441 (1.64) | 11 102 (1.63) | 11 097 (1.69) | 10 927 (1.71) | 10 912 (1.78) | 11 439 (1.83) | 11 487 (1.90) |
| North America | 3 648 (0.50) | 3 680 (0.51) | 3 710 (0.51) | 3 465 (0.50) | 3 728 (0.54) | 3 596 (0.52) | 3 711 (0.53) | 3 482 (0.51) | 3 461 (0.53) | 3 407 (0.53) | 3 329 (0.54) | 3 468 (0.56) | 3 236 (0.53) | 4 604 (0.64) | 4 518 (0.62) | 4 567 (0.63) | 4 382 (0.63) | 4 586 (0.66) | 4 564 (0.65) | 4 633 (0.67) | 4 429 (0.65) | 4 476 (0.68) | 4 338 (0.68) | 4 206 (0.69) | 4 583 (0.73) | 4 257 (0.70) |
| United States Of America | 3 271 (0.48) | 3 333 (0.51) | 3 240 (0.51) | 3 145 (0.51) | 3 446 (0.55) | 3 200 (0.53) | ||||||||||||||||||||
| Central America | 233 (0.03) | 252 (0.03) | 221 (0.03) | 249 (0.04) | 243 (0.03) | 284 (0.04) | 284 (0.04) | 254 (0.04) | 274 (0.04) | 279 (0.04) | 279 (0.05) | 342 (0.05) | 383 (0.06) | 343 (0.05) | 373 (0.05) | 345 (0.05) | 365 (0.05) | 403 (0.06) | 414 (0.06) | 402 (0.06) | 410 (0.06) | 428 (0.07) | 412 (0.06) | 427 (0.07) | 494 (0.08) | 513 (0.08) |
| South America | 2 427 (0.34) | 2 363 (0.33) | 2 461 (0.34) | 2 438 (0.35) | 2 624 (0.38) | 2 698 (0.39) | 2 935 (0.42) | 2 930 (0.43) | 3 027 (0.46) | 3 095 (0.48) | 3 245 (0.53) | 3 414 (0.55) | 3 651 (0.60) | 3 378 (0.47) | 3 282 (0.45) | 3 285 (0.45) | 3 301 (0.47) | 3 419 (0.49) | 3 594 (0.52) | 3 799 (0.55) | 3 823 (0.56) | 3 813 (0.58) | 3 939 (0.62) | 4 117 (0.67) | 4 238 (0.68) | 4 509 (0.74) |
| Caribbean | 4 557 (0.63) | 4 378 (0.60) | 4 469 (0.61) | 4 044 (0.58) | 3 946 (0.57) | 3 782 (0.54) | 3 676 (0.53) | 3 570 (0.53) | 3 299 (0.50) | 3 249 (0.51) | 2 991 (0.49) | 2 945 (0.47) | 2 989 (0.49) | 3 169 (0.44) | 3 113 (0.43) | 3 120 (0.43) | 2 885 (0.41) | 2 783 (0.40) | 2 774 (0.40) | 2 607 (0.37) | 2 440 (0.36) | 2 380 (0.36) | 2 238 (0.35) | 2 162 (0.35) | 2 124 (0.34) | 2 208 (0.36) |
| Middle East and Asia | 65 060 (9.00) | 66 963 (9.25) | 67 999 (9.32) | 65 764 (9.41) | 65 634 (9.44) | 65 419 (9.37) | 66 259 (9.52) | 64 234 (9.46) | 60 879 (9.27) | 61 081 (9.54) | 61 258 (9.98) | 61 002 (9.76) | 66 899 (11.05) | 66 348 (9.17) | 68 534 (9.47) | 69 667 (9.55) | 66 324 (9.50) | 65 725 (9.45) | 64 748 (9.28) | 65 961 (9.47) | 64 126 (9.44) | 60 431 (9.20) | 60 881 (9.51) | 61 760 (10.06) | 61 854 (9.90) | 67 342 (11.12) |
| Middle East | 8 035 (1.11) | 7 967 (1.10) | 7 926 (1.09) | 8 049 (1.15) | 8 392 (1.21) | 8 753 (1.25) | 9 229 (1.33) | 9 578 (1.41) | 9 801 (1.49) | 9 693 (1.51) | 9 452 (1.54) | 9 687 (1.55) | 10 302 (1.70) | 6 657 (0.92) | 6 793 (0.94) | 6 781 (0.93) | 6 773 (0.97) | 7 073 (1.02) | 7 409 (1.06) | 7 883 (1.13) | 8 269 (1.22) | 8 433 (1.28) | 8 600 (1.34) | 8 387 (1.37) | 8 676 (1.39) | 9 255 (1.53) |
| Central Asia | 166 (0.02) | 161 (0.02) | 190 (0.03) | 185 (0.03) | 220 (0.03) | 188 (0.03) | 193 (0.03) | 189 (0.03) | 223 (0.03) | 179 (0.03) | 210 (0.03) | 222 (0.04) | 219 (0.04) | 296 (0.04) | 360 (0.05) | 375 (0.05) | 364 (0.05) | 376 (0.05) | 422 (0.06) | 403 (0.06) | 397 (0.06) | 432 (0.07) | 363 (0.06) | 415 (0.07) | 368 (0.06) | 352 (0.06) |
| Eastern Asia | 4 019 (0.56) | 4 030 (0.56) | 4 493 (0.62) | 3 724 (0.53) | 4 118 (0.59) | 3 724 (0.53) | 3 912 (0.56) | 3 457 (0.51) | 3 104 (0.47) | 3 016 (0.47) | 2 721 (0.44) | 2 419 (0.39) | 2 657 (0.44) | 5 931 (0.82) | 5 928 (0.82) | 6 541 (0.90) | 5 605 (0.80) | 6 072 (0.87) | 5 538 (0.79) | 5 836 (0.84) | 5 346 (0.79) | 4 765 (0.73) | 4 614 (0.72) | 4 129 (0.67) | 3 871 (0.62) | 4 075 (0.67) |
| China | 3 611 (0.50) | 3 882 (0.56) | 3 596 (0.52) | |||||||||||||||||||||||
| Southern Asia | 48 722 (6.74) | 50 693 (7.00) | 51 472 (7.05) | 50 389 (7.21) | 49 602 (7.13) | 49 468 (7.09) | 49 799 (7.15) | 48 143 (7.09) | 45 047 (6.86) | 45 482 (7.10) | 46 059 (7.50) | 45 924 (7.35) | 50 645 (8.36) | 46 737 (6.46) | 48 817 (6.74) | 49 302 (6.76) | 47 755 (6.84) | 46 485 (6.69) | 45 795 (6.56) | 46 409 (6.67) | 44 953 (6.62) | 42 007 (6.39) | 42 556 (6.65) | 44 008 (7.17) | 44 170 (7.07) | 48 645 (8.03) |
| India | 12 799 (1.77) | 14 181 (1.96) | 13 991 (1.92) | 13 662 (1.96) | 13 639 (1.96) | 13 798 (1.98) | 14 007 (2.01) | 13 715 (2.02) | 12 968 (1.97) | 13 569 (2.12) | 14 631 (2.38) | 15 452 (2.47) | 18 013 (2.97) | 13 575 (1.88) | 14 892 (2.06) | 14 621 (2.00) | 14 044 (2.01) | 13 735 (1.98) | 13 780 (1.97) | 13 883 (1.99) | 13 476 (1.98) | 12 675 (1.93) | 13 108 (2.05) | 14 404 (2.35) | 15 260 (2.44) | 17 745 (2.93) |
| Pakistan | 19 091 (2.64) | 19 612 (2.71) | 20 280 (2.78) | 20 068 (2.87) | 19 601 (2.82) | 19 236 (2.76) | 19 131 (2.75) | 18 513 (2.73) | 17 334 (2.64) | 17 519 (2.74) | 17 140 (2.79) | 16 375 (2.62) | 17 393 (2.87) | 17 840 (2.47) | 18 434 (2.55) | 19 091 (2.62) | 18 578 (2.66) | 17 943 (2.58) | 17 342 (2.49) | 17 367 (2.49) | 17 099 (2.52) | 15 996 (2.43) | 16 320 (2.55) | 16 460 (2.68) | 15 791 (2.53) | 16 654 (2.75) |
| Bangladesh | 9 105 (1.26) | 9 027 (1.25) | 9 033 (1.24) | 8 776 (1.26) | 8 534 (1.23) | 8 699 (1.25) | 8 876 (1.27) | 8 286 (1.22) | 7 754 (1.18) | 7 371 (1.15) | 7 244 (1.18) | 7 184 (1.15) | 7 435 (1.23) | 8 360 (1.16) | 8 371 (1.16) | 8 224 (1.13) | 7 982 (1.14) | 7 783 (1.12) | 7 752 (1.11) | 8 106 (1.16) | 7 426 (1.09) | 7 027 (1.07) | 6 774 (1.06) | 6 767 (1.10) | 6 790 (1.09) | 7 007 (1.16) |
| Afghanistan | 3 232 (0.50) | 3 275 (0.53) | 3 345 (0.54) | 4 254 (0.70) | 3 875 (0.64) | |||||||||||||||||||||
| Sri Lanka | 3 717 (0.51) | 3 698 (0.51) | 3 745 (0.51) | 3 530 (0.51) | 3 509 (0.50) | 3 511 (0.49) | ||||||||||||||||||||
| South East Asia | 4 048 (0.56) | 4 040 (0.56) | 3 860 (0.53) | 3 374 (0.48) | 3 237 (0.47) | 3 226 (0.46) | 3 075 (0.44) | 2 831 (0.42) | 2 660 (0.40) | 2 661 (0.42) | 2 769 (0.45) | 2 711 (0.43) | 3 041 (0.50) | 6 650 (0.92) | 6 561 (0.91) | 6 592 (0.90) | 5 774 (0.83) | 5 641 (0.81) | 5 519 (0.79) | 5 365 (0.77) | 5 117 (0.75) | 4 725 (0.72) | 4 681 (0.73) | 4 755 (0.77) | 4 714 (0.75) | 4 955 (0.82) |
| Antarctica and Oceania | 3 991 (0.55) | 3 709 (0.51) | 3 630 (0.50) | 3 401 (0.49) | 3 179 (0.46) | 3 030 (0.43) | 3 085 (0.44) | 2 905 (0.43) | 2 661 (0.40) | 2 454 (0.38) | 2 353 (0.38) | 2 439 (0.39) | 2 006 (0.33) | 3 910 (0.54) | 3 591 (0.50) | 3 457 (0.47) | 3 147 (0.45) | 3 035 (0.44)) | 2 895 (0.41) | 2 816 (0.40) | 2 691 (0.40) | 2 509 (0.38) | 2 379 (0.37) | 2 243 (0.37) | 2 317 (0.37) | 2 075 (0.34) |
| Australasia | 3 707 (0.51) | 3 434 (0.47) | 3 344 (0.46) | 3 124 (0.45) | 2 903 (0.42) | 2 788 (0.40) | 2 861 (0.41) | 2 667 (0.39) | 2 439 (0.37) | 2 257 (0.35) | 2 182 (0.36) | 2 251 (0.36) | 1 820 (0.30) | 3 660 (0.51) | 3 350 (0.46) | 3 232 (0.44) | 2 921 (0.42) | 2 800 (0.40) | 2 695 (0.39) | 2 602 (0.37) | 2 499 (0.37) | 2 335 (0.36) | 2 219 (0.35) | 2 101 (0.34) | 2 185 (0.35) | 1 921 (0.32) |
| Other Oceania | 284 (0.04) | 274 (0.04) | 286 (0.04) | 277 (0.04) | 276 (0.04) | 242 (0.03) | 224 (0.03) | 238 (0.04) | 222 (0.03) | 197 (0.03) | 171 (0.03) | 188 (0.03) | 186 (0.03) | 249 (0.03) | 239 (0.03) | 223 (0.03) | 226 (0.03) | 235 (0.03) | 200 (0.03) | 214 (0.03) | 192 (0.03) | 174 (0.03) | 160 (0.02) | 142 (0.02) | 132 (0.02) | 154 (0.03) |
Social issues[edit]
Marriage, divorce, families and household types[edit]
Marriage and divorce[edit]

In 2004, 58% of births were conceived within a married couple, 35% by non-married couples registered by both parents and 7% by non-married mothers who registered the birth alone.[36]
This varied from each constituent nation, Wales for example had the highest births outside of marriage at 51% in 2004, In England this percentage was 42% and in Scotland 47%. Northern Ireland had the lowest of 35% in 2004.[36]
-
 Number of marriages in the United Kingdom 1887–2016
 -
 Opposite sex marriage rate over time in England and Wales
 -
 Number of divorces in England and Wales 1858–2020
 -
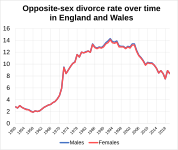 Opposite sex divorce rate in England and Wales
 -
 Median age at divorce in England and Wales
 -
 Culmulative percentage of marriages ending in divorce by year of marriage in England and Wales


- Age structure of population groups relating to marriage
-
 Never Married
 -
 Married or in Civil partnership
 -
 Divorced or dissolved Civil partnership
 -
 Widowed or surviving member of Civil partnership


Household and family type[edit]
-
 Type of households out of total households in 2021
 -
 Family types out of total families in 2021
 -
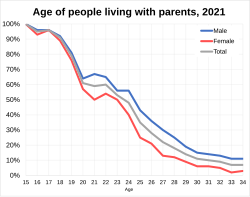 Percentage of age group living with parents in 2021


Sexual orientation[edit]

Out of the 600,000 people in the UK that applied to go to university through UCAS in 2020, 7.2%, or 40,000, described themselves as LGBT on their application form. UCAS estimates this to be a rate 2.5 times higher than the overall UK population. The UCAS report in collaboration with Stonewall also found LGBT students were more likely to come from disadvantaged backgrounds (compared to those who identified as heterosexual or didn't specify), have a disability (compared to non-LGBT students) and have a mental health condition (compared to non-LGBT students).[102]
For the first time, the 2021 United Kingdom census included a question on sexual orientation.[103] Results for Scotland are expected to be published from spring 2024 onwards.[104]
| Sexual orientation (aged 16 and over) | ||
|---|---|---|
| England and Wales[105] | Northern Ireland[106] | |
| Straight or Heterosexual | 89.4% | 90.0% |
| Gay or Lesbian | 1.5% | 1.2% |
| Bisexual | 1.3% | 0.8% |
| All other sexual orientations | 0.3% | 0.2% |
| Not answered | 7.5% | 7.9% |
Gender identity[edit]
In the 2021 United Kingdom census, in England and Wales, 262,000 people (0.5%) answered that their gender identity was different from their sex registered at birth, including 0.10% who identified as a trans man, 0.10% as a trans woman, and 0.06% as non-binary.[107] 1% of people aged 16 to 24 years said that their gender identity was different from their sex registered at birth.[108]
Abortion[edit]

Abortion in the United Kingdom (however not Northern Ireland) was officially legalised under the Abortion Act 1967, allowing women for the first time to get an abortion under numerous medical grounds outlined within the act. Previously, this was outlawed under the Offences Against the Person Act 1861 and then the updated Infant Life (Preservation) Act 1929 which only permitted an abortion if the death of a child was "done in good faith for the purpose only of preserving the life of the mother".
In 2020, the amount of conceptions which led to an abortion was around 25.3%[109]
| Year | 1969 | 1971 | 1976 | 1981 | 1986 | 1991 | 1996 | 2001 | 2006 | 2011 | 2016 | 2020 |
|---|---|---|---|---|---|---|---|---|---|---|---|---|
| Percentage of conceptions leading to an abortion | 5.98% | 11.32% | 15.17% | 17.09% | 18.02% | 19.6% | 20.55% | 23% | 22.26% | 20.88% | 21.5% | 25.29% |
Health[edit]
General health[edit]
| General health (self-identified) | England and Wales | |||||
|---|---|---|---|---|---|---|
| 2001[111] | 2011[112] | 2021[113] | ||||
| Number | % | Number | % | Number | % | |
| Very good health | 35,676,210 | 68.6% | 26,434,409 | 47.1% | 28,827,308 | 48.4% |
| Good health | 19,094,820 | 34.1% | 20,046,220 | 33.6% | ||
| Fair health | 11,568,363 | 22.2% | 7,401,881 | 13.2% | 7,597,001 | 12.7% |
| Bad health | 4,797,343 | 9.2% | 2,428,668 | 4.3% | 2,412,358 | 4.0% |
| Very bad health | 716,134 | 1.3% | 714,655 | 1.2% | ||
| Total | 52,041,916 | 100% | 56,075,912 | 100% | 59,597,542 | 100.0% |
Death rate and cause
-
 Leading causes of death for males
 -
 Leading causes of death for females


Health issues[edit]
- Variety of health issues in graphs
-
 Obesity rates from 1975 to 2016
 -
 Smoking rates from 1974 to 2020
 -
 Percentage of the public who consume alcohol weekly from 2005 to 2017
 -
 Suicide rate in England and Wales per 100,000 people from 1981 to 2020
 -
 Suicide rates regionally in 2020
 -
 Total deaths to drug misuse in England and Wales
 -
 Drug misuse crude death rate regionally in 2019


Disability[edit]

| Disability status | England and Wales | |||||||
|---|---|---|---|---|---|---|---|---|
| 1991 (long-term illness)[114] | 2001 (limiting long-term illness)[115] | 2011[116] | 2021[117] | |||||
| Number | % | Number | % | Number | % | Number | % | |
| Disabled (under the Equality Act) | 6,039,455 | 11.9% | 9,484,856 | 18.2% | 10,048,441 | 17.9% | 10,444,776 | 17.5% |
| Disabled under the Equality Act: Day-to-day activities limited a little | – | – | – | – | 5,278,729 | 9.4% | 5,985,013 | 10.0% |
| Disabled under the Equality Act: Day-to-day activities limited a lot | – | – | – | – | 4,769,712 | 8.5% | 4,459,763 | 7.5% |
| Not disabled (under the Equality Act) | – | – | – | – | 46,027,471 | 82.1% | 49,152,766 | 82.5% |
| Not disabled under the Equality Act: No long term physical or mental health conditions | – | – | – | – | 46,027,471 | 82.1% | 45,090,197 | 75.7% |
| Not disabled under the Equality Act: Has long term physical or mental health condition but day-to-day activities are not limited | – | – | – | – | – | – | 4,062,569 | 6.8% |
| Total | 50,748,000 | 100% | 52,041,916 | 100% | 56,075,912 | 100% | 59,597,542 | 100% |
Employment and income[edit]
The unemployment rate for the youth age bracket of 15–24 was 11.2% in 2019 – 13% for males and 9.2% for females.[118]
-
 Unemployment rate 1881–2017
 -
 Percentage of labour force working in each (broad) sector
 -
 UK employment by broad industry sector
 -
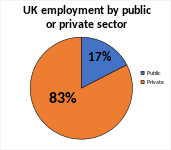 UK employment by public or private sector
 -
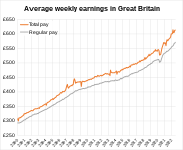 Average weekly earnings over time (seasonally adjusted)
 -
 Average household income 1977–2021
 -
 Percentage of young people who are not in education, employment or training (NEET)
 -
 Economically inactive percentage of population in local authorities in 2021
 -
 Gross disposable household income (GDHI) across the UK mapped in 2020
 -
 The Median Individual Disposable income as of 2018
 -
 The Median Gross Household Income as of 2018


.svg)

_across_the_UK_mapped_in_2020.svg)
.png)
.png)
Method of transportation to work[edit]
| Method of transportation | England and Wales (aged 16 and over in employment) | |||||||||
|---|---|---|---|---|---|---|---|---|---|---|
| 1981 (10% sample)[119] | 1991 (10% sample)[120] | 2001[121] | 2011[122] | 2021[123] | ||||||
| Number | % | Number | % | Number | % | Number | % | Number | % | |
| Work mainly at or from home | 77,711 | 3.7% | 105,715 | 4.9% | 2,170,547 | 9.2% | 1,422,708 | 5.4% | 8,671,722 | 31.2% |
| Underground, metro, light rail, tram | 42,717 | 2.1% | – | – | 706,477 | 3.0% | 1,028,800 | 3.9% | 505,311 | 1.8% |
| Train | 80,751 | 3.9% | 129,325 | 6.1% | 957,713 | 4.1% | 1,371,025 | 5.2% | 529,461 | 1.9% |
| Bus, minibus or coach | 315,767 | 15.2% | 196,554 | 9.2% | 1,742,300 | 7.4% | 1,949,442 | 7.3% | 1,160,990 | 4.2% |
| Taxi | – | – | – | – | 121,380 | 0.5% | 137,988 | 0.5% | 200,490 | 0.7% |
| Motorcycle, scooter or moped | 61,244 | 2.9% | 32,828 | 1.5% | 257,474 | 1.1% | 214,244 | 0.8% | 128,849 | 0.5% |
| Driving a car or van | 806,735 | 38.8% | 1,148,863 | 53.7% | 13,012,850 | 55.3% | 15,264,527 | 57.5% | 12,524,571 | 45.1% |
| Passenger in a car or van | 248,400 | 12.0% | 159,317 | 7.5% | 1,472,576 | 6.3% | 1,357,280 | 5.1% | 1,083,447 | 3.9% |
| Bicycle | 80,084 | 3.9% | 66,739 | 3.1% | 648,433 | 2.8% | 762,334 | 2.9% | 569,295 | 2.0% |
| On foot | 318,606 | 15.3% | 247,987 | 11.6% | 2,352,386 | 10.0% | 2,846,588 | 10.7% | 2,113,657 | 7.6% |
| Other method of travel to work (and Not stated) | 47,482 | 2.3% | 50,517 | 2.4% | 86,916 | 0.4% | 171,400 | 0.6% | 285,873 | 1.0% |
| Total | 2,079,497 | 100% | 2,137,845 | 100% | 23,529,052 | 100% | 26,526,336 | 100% | 27,773,666 | 100% |
- Population pyramids of Method of transportation to work groups in 2021
-
 Drive car to work
 -
 Work from or at home


Migration[edit]


Historical and present net numbers[edit]

Migration to the UK has varied through its history. Irish migration from the Great Famine predominated during the 19th century.[124] Additionally Jewish migration from Russia also arrived famously into Bethnal Green in London.[124]
Starting from the 1950s onwards, following on from the British Nationality Act 1948 which de jure allowed the migration of upwards 800,000,000[125] British subjects who were now British citizens in law, modern mass migration to the United Kingdom began. During this decade West Indians from the Caribbean, those from Jamaica and so on began to arrive.[126]
During the middle of the 1960s to the 70s, migration flipped in origin to the majority of those arriving being of South Asian origin from the Indian sub-continent. Immigration restrictions, in response to the ever increasing number arriving, were introduced, such as the Commonwealth Immigrants Act 1962, Commonwealth Immigrants Act 1968 and the Immigration Act 1971.[127][126]
Through the 1970s, 80s and early 90s, net migration to the United Kingdom was often negative in terms of numbers, with more people leaving the country, than entering in total.
Since 1994, net migration in numbers has been in the positives, with more people entering the country, rather than leaving.[24] Migration increased fourfold following the election of Tony Blair in 1997,[128][129] immigration restrictions were undone such as the primary purpose rule.[130]
In 2004, along with Ireland and Sweden, Britain was one of the only countries within the EU to not implement 'transitional controls' on migration flows from the newly joined A8 countries from Eastern Europe.[131][132] Around 453,000 immigrants, which has been revised upwards in recent years,[132][133] from these new counties were estimated in 2015 to have migrated to the UK.[134]
Country of birth[edit]
Country of birth was first asked as a census question in 1841.[135]
| Rank | Country of birth | Population[136] |
|---|---|---|
| 1 | 863,000 | |
| 2 | 818,000 | |
| 3 | 547,000 | |
| 4 | 427,000 | |
| 5 | 360,000 | |
| 6 | 289,000 | |
| 7 | 260,000 | |
| 8 | 252,000 | |
| 9 | 233,000 | |
| 10 | 217,000 | |
| 11 | 215,000 | |
| 12 | 185,000 | |
| 13 | 168,000 | |
| 14 | 165,000 | |
| 15 | 161,000 | |
| 16 | 159,000 | |
| 17 | 153,000 | |
| 18 | 153,000 | |
| 19 | 128,000 | |
| 20 | 128,000 | |
| 21 | 126,000 | |
| 22 | 123,000 | |
| 23 | 121,000 | |
| 24 | 114,000 | |
| 25 | 101,000 | |
| 26 | 99,000 | |
| 27 | 98,000 | |
| 28 | 95,000 | |
| 29 | 89,000 | |
| 30 | 79,000 | |
| 31 | 76,000 | |
| 32 | 72,000 | |
| 33 | 72,000 | |
| 34 | 71,000 | |
| 35 | 68,000 | |
| 36 | 67,000 | |
| 37 | 67,000 | |
| 38 | 66,000 | |
| 39 | 61,000 | |
| 40 | 59,000 | |
| 41 | 57,000 | |
| 42 | 54,000 | |
| 43 | 52,000 | |
| 44 | 49,000 | |
| 45 | 48,000 | |
| 46 | 47,000 | |
| 47 | 44,000 | |
| 48 | 44,000 | |
| 49 | 42,000 | |
| 50 | 39,000 | |
| 51 | 39,000 | |
| 52 | 38,000 | |
| 53 | 38,000 | |
| 54 | 35,000 | |
| 55 | 34,000 | |
| 56 | 33,000 | |
| 57 | 33,000 | |
| 58 | 29,000 | |
| 59 | 29,000 | |
| 60 | 27,000 | |
| 61 | 27,000 |
In the 1980s to 1990s, around 12 to 13% of births were born to foreign born mothers. In 2004, this had risen to 20% of births being born to foreign born mothers.[36] The fertility rate among non-UK born women was 1.98 and among UK born women 1.50 in 2020.
| Country of birth from 1951 to 2011 | ||||||||||||||
|---|---|---|---|---|---|---|---|---|---|---|---|---|---|---|
| Country of birth | Year | |||||||||||||
| 1951[137] | 1961[137] | 1971[138] | 1981[139] | 1991[140] | 2001[137] | 2011[137] | ||||||||
| Number | % | Number | % | Number | % | Number | % | Number | % | Number | % | Number | % | |
| Europe | – | – | – | – | 52,325,821 | 96.71% | 52,939,273 | 96.13% | 53,960,525 | 95.57% | – | – | ||
| 48,168,300 | 95.8% | 50,233,900 | 95.1% | 51,016,100 | 94.29% | 51,706,978 | 93.89% | 52,659,965 | 93.27% | 54,216,400 | 91.7% | 55,188,698 | 87.34% | |
| Other Europe | – | – | – | – | 1,309,721 | 2.4% | 1,232,295, | 2.2% | 1,300,560 | 2.3% | ||||
| – | – | – | – | 693,435 | 1.28% | 607,428 | 1.10% | 627,930 | 1.11% | |||||
| Other EEC/EU | – | – | – | – | – | – | – | – | 497,985 | 0.88% | ||||
| Other Europe | – | – | – | – | 616,286 | 1.13% | 624,867 | 1.13% | 174,645 | 0.30% | ||||
| Asia | – | – | – | – | 547,340 | 1.01% | 765,383 | 1.38% | 925,725 | 1.63% | – | – | ||
| – | – | – | – | 313,630 | 0.57% | 391,874 | 0.71% | 410,008 | 0.72% | |||||
| – | – | – | – | 137,112 | 0.25% | 188,198 | 0.34% | 234,312 | 0.41% | |||||
| – | – | – | – | – | – | 48,517 | – | 105,066 | 0.18% | |||||
| – | – | – | – | – | – | – | – | 23,998 | – | |||||
| Other Asia | – | – | – | – | 96,598 | 0.17% | 136,794 | 0.24% | 152,341 | 0.26% | ||||
| Africa | – | – | – | – | 155,738 | 0.28% | 290,453 | 0.52% | 332,195 | 0.58% | – | – | ||
| East Africa | – | – | – | – | – | – | – | – | 221,170 | 0.39% | ||||
| Other Africa | – | – | – | – | – | – | – | – | 111,025 | 0.2% | ||||
| Caribbean and Americas | – | – | – | – | 296,347 | 0.54% | 295,179 | 0.53% | 264,781 | 0.46% | – | – | ||
| Old Commonwealth | – | – | – | – | 136,148 | 0.25% | 152,747 | 0.27% | 180,828 | 0.32% | – | – | ||
| Other (New Commonwealth) | – | – | – | – | 114,521 | 0.21% | 162,358 | 0.29% | 194,647 | 0.34% | – | – | ||
| Other: Total[141] | – | – | – | – | 526,587 | 0.97% | 461,410 | 0.83% | 600,065 | 1.06% | – | – | ||
| Foreign born: Total | 2,118,600 | 4.2% | 2,573,500 | 4.9% | 3,190,300 | 5.8% | 3,429,100 | 6.2% | 3,835,400 | 6.7% | 4,896,600 | 8.3% | 7,993,480 | 12.7% |
| Total: | 50,286,900 | 100% | 52,807,400 | 100% | 54,102,502 | 100% | 55,066,803 | 100% | 56,458,766 | 100% | 59,113,000 | 100% | 63,182,178 | 100% |
| TFR by country of birth[142][fn 3][fn 4] | ||||||||||||
|---|---|---|---|---|---|---|---|---|---|---|---|---|
| Country of birth | Year | |||||||||||
| 1971 | 1979 | 1981 | 1983 | 1985 | 1987 | 1989 | 1991 | 1993 | 1995 | 1997 | 2001 | |
| 2.30 | – | 1.70 | 1.70 | 1.70 | 1.80 | 1.80 | 1.80 | 1.70 | 1.70 | 1.65 | 1.6 | |
| New Commonwealth | 4.00 | 3.50 | 2.90 | 2.80 | 2.90 | 2.80 | 2.70 | 2.90 | 2.80 | 2.96 | 3.09 | 2.8 |
| 4.30 | 3.90 | 3.10 | 2.80 | 2.90 | 2.70 | 2.40 | 2.60 | 2.20 | 2.19 | 2.32 | 2.3 | |
| Pakistan, Bangladesh | 9.30 | 7.10 | 6.50 | 6.10 | 5.60 | 5.20 | 4.70 | 5.00 | 5.10 | 5.20 | – | – |
| – | – | – | – | – | – | – | 4.8 | – | – | 5.30 | 4.7 | |
| – | – | – | – | – | – | – | 3.9 | – | – | 4.83 | 3.9 | |
| East Africa | 2.7 | – | 2.1 | 2 | 2.1 | 1 | 1.9 | 2 | 1.7 | 1.8 | 1.76 | 1.6 |
| Other Africa | 4.2 | – | 3.4 | 3.1 | 3 | 3.2 | 4.2 | 3.1 | 3.1 | 3.58 | 3.52 | 2.0 |
| West Indies | 3.4 | 2.5 | 2 | 1.8 | 1.8 | 1.9 | 1.6 | 1.9 | 1.8 | 2.33 | 2.57 | – |
| Mediterranean | – | – | 2.1 | 2.1 | 2.2 | 2 | 1.9 | 2.1 | 1.7 | 1.89 | 1.8 | – |
| Hong Kong, Far East | 2.70 | – | 1.7 | 1.9 | 2 | 1.8 | 1.7 | 1.8 | 1.6 | 1.6 | 1.39 | – |
| Other New Commonwealth | – | – | 2.3 | 2.4 | 2.3 | 2.5 | 2.4 | 2.2 | 2 | 2.63 | 2.94 | 2.2 |
| Rest of the World | – | – | 2.00 | 1.90 | 2.00 | 1.90 | 1.90 | 1.90 | 1.90 | 2.04 | 2.09 | 1.8 |
| Total: | 2.38 | 1.84 | 1.80 | 1.76 | 1.78 | 1.81 | 1.80 | 1.82 | 1.77 | 1.72 | 1.73 | 1.65 |
- Population groups by country of birth distributed in 2011 (if not noted)
-
 Foreign born population in the UK in 2021
 -

-
 Born in Lithuania
 -
 Born in France
 -
 Born in South Africa


- Country of birth population pyramids in 2021 in England and Wales
-
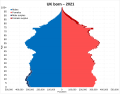 UK born
 -
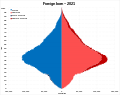 Foreign born: Total
 -
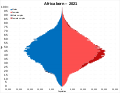 Africa born
 -
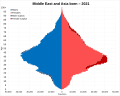 Middle East and Asia born
 -
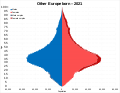 Other Europe born


Internal[edit]
Population movements of the country have fluctuated over time, in the 19th century with the urbanisation of the country, large amounts of people moved to the capital and the nearby industrial cities, but in recent years there has been a general trend of 'de-urbanisation' as parts of the population have moved back to the countryside. An example of recent large scale internal movement in the 21st century has been the departure of 220,000 White British Londoners to other areas of rural England and Wales over the 2000s[143] and over the 2010s around a total of 550,000 people left the city.[144] Demographically by age, the people leaving the city more than entering tend to be in their 30s and 40s while people entering in their 20s.[144]
Ethnicity[edit]
Ethnic demographic breakdown[edit]

| Ethnic Group | Year | |||||||
|---|---|---|---|---|---|---|---|---|
| 1991[145][t 1] | 2001[146][147][148] | 2011[149][150][151][152] | 2021/2[153][154][155][t 2] | |||||
| Number | % | Number | % | Number | % | Number | % | |
| White: Total | 51,873,794 | 94.5% | 54,153,898 | 92.12% | 55,073,145 | 87.2% | 55,756,781 | 83.30% |
| White: British | – | – | 52,728,717 | 89.7% | 52,320,080 | 82.8% | 50,582,935 | 75.57% |
| White: Irish | 837,464 | 1.52% | 1,022,303 | 1.53% | ||||
| White: Gypsy / Traveller / Irish Traveller | – | – | 1,710 | – | 62,981 | 0.1% | 176,994 | 0.26% |
| White: Other | – | – | 1,423,471 | 2.4% | 2,690,084 | 4.3% | 1,562,170 | 2.3% |
| Asian / Asian British: Total | 1,834,117 | 3.34% | 2,578,826 | 4.39% | 4,373,661 | 6.9% | 5,690,325 | 8.5% |
| Asian / Asian British: Indian | 840,255 | 1.53% | 1,053,411 | 1.79% | 1,452,156 | 2.3% | 1,908,079 | 2.85% |
| Asian / Asian British: Pakistani | 476,555 | 0.86% | 747,285 | 1.27% | 1,174,602 | 1.9% | 1,639,728 | 2.45% |
| Asian / Asian British: Bangladeshi | 162,835 | 0.29% | 283,063 | 0.48% | 451,741 | 0.7% | 649,689 | 0.97% |
| Asian / Asian British: Chinese | 156,938 | 0.28% | 247,403 | 0.42% | 433,444 | 0.7% | 490,023 | 0.73% |
| Asian / Asian British: Other Asian | 197,534 | 0.35% | 247,664 | 0.42% | 861,718 | 1.4% | 990,484 | 1.5% |
| Black / Black British: Total[t 3] | 890,727 | 1.62% | 1,148,738 | 1.95% | 1,905,506 | 3% | 2,462,405 | 3.68% |
| Black / Black British: African | 212,362 | 0.38% | 485,277 | 0.83% | 1,021,973 | 1.6% | 1,526,225 | 2.28% |
| Black / Black British: Caribbean | 499,964 | 0.91% | 565,876 | 0.96% | 599,197 | 0.9% | 633,386 | 0.95% |
| Black / Black British: Other Black | 178,401 | 0.32% | 97,585 | 0.17% | 284,336 | 0.5% | 302,794 | 0.45% |
| Mixed / British Mixed | – | – | 677,117 | 1.15% | 1,250,414 | 2% | 1,752,893 | 2.62% |
| Other: Total | 290,206 | 0.52% | 230,615 | 0.39% | 580,049 | 0.9% | 1,264,321 | 1.89% |
| Total: | 54,888,844 | 100% | 58,789,194 | 100% | 63,182,775 | 100% | 66,937,321 | 100% |
Note:
- ^ For 1991, Only data from Great Britain itself has been used, due to Northern Ireland not conducting an question on ethnicity within there. If Northern Ireland population data was added in as substitute as the jurisdiction had virtually no ethnic minorities during that period, the White population would rise to 94.65% of the population.
- ^ The Scottish referendum of 2021 was delayed by a year because of the COVID-19 pandemic. Overall totals have been published. The Ethnic division is expected to be published in Spring 2024. The proportions (about 8% of the total UK population) have been scaled from the 2011 results until these are available.
- ^ For the purpose of harmonising results to make them comparable across the UK, the ONS includes individuals in Scotland who classified themselves in the "African" category (29,638 people), which in the Scottish version of the census is separate from "Caribbean or Black" (6,540 people),[156] in this "Black or Black British" category. The ONS note that "the African categories used in Scotland could potentially capture White/Asian/Other African in addition to Black identities".[157]
- Ethnicities of United Kingdom and in its constituent countries
-
-

-
-


| Ethnic minority | Year | |||||||||||
|---|---|---|---|---|---|---|---|---|---|---|---|---|
| 1939*[159] | 1951* | 1961* | 1971* | 1981* | 1986* | 1991 | 1993* | 1998* | 2000* | 2001 | 2011 | |
| Number | 7,000 | 50,000 | 400,000 | 1,370,000 | 2,090,000 | 2,470,000 | 3,015,050 | 3,200,000 | 3,700,000 | 4,040,000 | 4,635,296 | 8,108,626 |
| % | – | 0.1% | 0.8% | 2.5% | 3.9% | 4.5% | 5.5% | 5.7% | 6.5% | 7.1% | 7.88% | 12.83% |
Geographic distribution
- Distribution of ethnic groups within the United Kingdom in the 2011 census
-
 White: Total (87.12%)
 -
![White: British (81.5%)[fn 6]](//upload.wikimedia.org/wikipedia/commons/thumb/6/6e/White_British_percentage_UK_wide_2011.svg/100px-White_British_percentage_UK_wide_2011.svg.png)
-
![White: Irish (0.95%)[fn 7]](//upload.wikimedia.org/wikipedia/commons/thumb/f/f3/Counties_of_the_UK_Irish.svg/100px-Counties_of_the_UK_Irish.svg.png)
-
 Asian/Asian British: Total (6.92%)
 -
 Asian/Asian British: Indian (2.3%)
 -
 Asian/Asian British: Pakistani (1.86%)
 -
 Asian/Asian British: Bangladeshi (0.71%)
 -
 Asian/Asian British: Chinese (0.69%)
 -
 Asian/Asian British: Other Asian (1.36%)
 -
 Black/Black British: Total (3.01%)
 -
 Black/Black British: Caribbean (0.94%)
 -
 Other: Arab (0.40%)

![White: British (81.5%)[fn 6]](/wiki/File:White_British_percentage_UK_wide_2011.svg)
![White: Irish (0.95%)[fn 7]](/wiki/File:Counties_of_the_UK_Irish.svg)


Age structure of ethnic groups


- Age structure of ethnic groups in England and Wales in the 2021 census
-
 White: Total
 -

-

-

-
 Ethnic minority: Total
 -
 Asian/Asian British: Total
 -
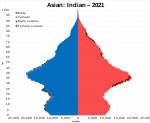 Asian/Asian British: Indian
 -
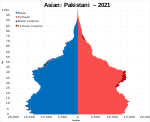 Asian/Asian British: Pakistani
 -
 Asian/Asian British: Bangladeshi
 -
 Asian/Asian British: Chinese
 -
 Other Asian
 -
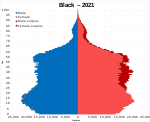 Black: Total
 -
 Black/Black British: Caribbean
 -
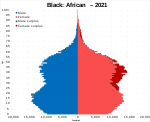 Black/Black British: African
 -
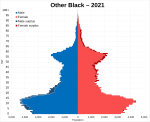
-
 Mixed/British Mixed: Total
 -
 Other ethnic group: Total
 -
 Other: Any other ethnic group
 -
 Other: Arab


Ethnicity of school pupils

| Ethnic group | School year[160][161][162][163] | |||||||||
|---|---|---|---|---|---|---|---|---|---|---|
| 2004 | 2008 | 2012 | 2016 | 2021 | ||||||
| Number | % | Number | % | Number | % | Number | % | Number | % | |
| White: Total | 6,648,681 | 84.2% | 6,406,400 | 82.9% | 6,204,628 | 80.3% | 6,245,235 | 77.8% | 7,001,982 | 73.5% |
| White: British | 6,468,459 | 82% | 6,132,309 | 79.4% | 5,867,768 | 75.9% | 5,763,533 | 71.8% | 6,313,543 | 66.3% |
| White: Irish | 26,100 | 0.3% | 23,620 | 0.3% | 21,805 | 0.3% | 21,127 | 0.3% | 22,994 | 0.2% |
| White: Roma/Irish Traveller | 6,500 | – | 13,295 | 0.2% | 21,308 | 0.3% | 29,184 | 0.4% | 36,845 | 0.4% |
| White: Other | 147,622 | 1.9% | 237,176 | 3.1% | 293,747 | 3.8% | 431,391 | 5.4% | 628,600 | 6.6% |
| Asian / Asian British: Total | 491,953 | 6.2% | 587,288 | 7.6% | 685,135 | 8.9% | 792,382 | 9.9% | 1,083,920 | 11.4% |
| Asian / Asian British: Indian | 156,563 | 2% | 165,320 | 2.1% | 175,964 | 2.3% | 203,785 | 2.5% | 299,136 | 3.1% |
| Asian / Asian British: Pakistani | 189,283 | 2.4% | 226,285 | 2.9% | 267,230 | 3.5% | 309,078 | 3.8% | 398,789 | 4.2% |
| Asian / Asian British: Bangladeshi | 72,473 | 0.9% | 90,161 | 1.2% | 106,800 | 1.4% | 121,100 | 1.5% | 156,301 | 1.64% |
| Asian / Asian British: Chinese | 25,902 | 0.3% | 27,893 | 0.4% | 28,766 | 0.4% | 33,342 | 0.4% | 53,318 | 0.55% |
| Asian / Asian British: Other Asians | 47,732 | 0.6% | 77,629 | 1% | 106,375 | 1.4% | 125,077 | 1.6% | 176,376 | 1.85% |
| Black / Black British: Total | 247,024 | 3.1% | 298,391 | 3.9% | 348,918 | 4.5% | 400,528 | 5% | 502,344 | 5.2% |
| Black: Caribbean | 96,695 | 1.22% | 92,876 | 1.2% | 92,076 | 1.2% | 87,057 | 1.1% | 84,024 | 0.88% |
| Black: African | 122,429 | 1.55% | 172,400 | 2.2% | 215,812 | 2.8% | 263,079 | 3.3% | 352,285 | 3.7% |
| Black: Other Blacks | 27,900 | 0.35% | 33,115 | 0.4% | 41,030 | 0.5% | 50,392 | 0.6% | 66,035 | 0.69% |
| Mixed / British Mixed | 186,314 | 2.4% | 242,511 | 3.1% | 305,936 | 4% | 382,730 | 4.8% | 583,723 | 6.1% |
| Other: Total | 82,280 | 1% | 84,095 | 1.1% | 104,187 | 1.3% | 129,536 | 1.6% | 199,770 | 2.1% |
| Unclassified | 230,573 | 2.9% | 104,012 | 1.3% | 77,862 | 1% | 81,146 | 1% | 153,499 | 1.6% |
| Total: | 7,891,306 | 100% | 7,723,472 | 100% | 7,726,651 | 100% | 8,031,557 | 100% | 9,526,070 | 100% |
- Ethnicity of school pupils with England and its administrative districts in the school year of 2021/2022
-
 White: 71.4%
 -
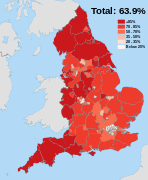 White British: 63.9%


Ethnicity of live births and total fertility rate
| Ethnic Group | Year | |||||||
|---|---|---|---|---|---|---|---|---|
| 2005[165] | 2011 | 2015 | 2019 | |||||
| Number | % | Number | % | Number | % | Number | % | |
| White: Total | 451,514 | 69.5%
(80.3%) |
536,021 | 74.49% | 507,829 | 72.29% | 452,248 | 70.67% |
| White: British | 418,052 | 64.4%
(75.2%[fn 8]) |
476,328 | 66.19% | 432,114 | 62.05% | 374,056 | 58.45% |
| White: Other | 33,462 | 5.1% | 59,693 | 8.29% | 75,715 | 10.87% | 78,192 | 12.22% |
| Asian / Asian British: Total | 56,065 | 8.7% | 76,599 | 10.64% | 76,976 | 11.05% | 73,874 | 11.54% |
| Asian / Asian British: Indian | 16,053 | 2.5% | 22,725 | 3.15% | 21,582 | 3.09% | 20,627 | 3.22% |
| Asian / Asian British: Pakistani | 24,290 | 3.7% | 27,948 | 3.88% | 28,142 | 4.04% | 27,573 | 4.31% |
| Asian / Asian British: Bangladeshi | 8,241 | 1.3% | 9,847 | 1.36% | 9,889 | 1.42% | 9,505 | 1.49% |
| Other Asians | 7,481 | 1.2% | 16,079 | 2.23% | 17,363 | 2.49% | 16,169 | 2.52% |
| Black / Black British: Total | 32,701 | 5% | 36,151 | 5.02% | 33,461 | 4.8% | 30,846 | 4.81% |
| Black: African | 19,756 | 3% | 24,457 | 3.39% | 23,483 | 3.37% | 21,589 | 3.37% |
| Black: Caribbean | 7,517 | 1.2% | 6,943 | 0.96% | 5,964 | 0.85% | 5,480 | 0.86% |
| Other Blacks | 5,428 | 0.8% | 4,751 | 0.66% | 4,014 | 0.57% | 3,777 | 0.59% |
| Mixed / British Mixed | 22,606 | 3.5% | 34,643 | 4.81% | 40,433 | 5.8% | 41,918 | 6.54% |
| Other: Total | 15,232 | 2.4% | 13,320 | 1.85% | 15,625 | 2.24% | 15,523 | 2.42% |
| Not Stated | 70,303 | 10.8% | 22,848 | 3.17% | 22,041 | 3.16% | 25,578 | 4.00% |
| Total: | 649,371 | 100% | 719,582 | 100% | 696,365 | 100% | 639,987 | 100% |
- Percentage of births by ethnic group within the United Kingdom in 2021
-
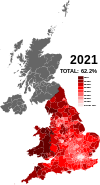 White British (62.2%, including non-stated)

Future projections[edit]

Numerous predictions and projections of the future ethnic demography of the United Kingdom have been made over the years.
In 2010, academic David Coleman produced research postulating a future demographic decline of the White British in Britain, indicating that they would become a minority in Birmingham and London during the 2020s.[166] He also estimated that around 2056 to 2066, the trend of a declining share of the white populace will result in the United Kingdom having an overall white minority.[167][168]
In Prospect, he outlined four projections for a majority-minority scenario within the United Kingdom;[169]
- If net immigration trends (in 2010) continued its overall trend of 254,000 a year and net emigration of the White British was 74,000 a year (180,000 per year), the White British would decline to 59% of the total population by 2051, 'Other Whites' projected to be at 10% and non-Whites projected to be 31% of the population. By 2066 this would inevitably lead to the White British being a minority of the population.
- If migration to the United Kingdom was to decline to a net inflow of 80,000 per year, the White British would be 63% of the population by 2051 and would fall below 50% in 2080.
- Using a cross-party group of MP's recommendation of 'balanced migration', where there is neither a net inflow or outflow, where immigration only consists of 74,000 a year and emigration of the White British the same, the White British would be 67% of the population by 2051 and then fall below 50% by the end of the century.
- If there is no emigration of citizens and no immigration to the United Kingdom ('natural change' scenario), then the White British would remain at around 80% of the population by 2051 and would still remain the majority by the end of the century, albeit a reduced percentage (roughly around 75 - 70%)
- A fifth estimate, made by the Philip Rees and the University of Leeds, estimate that if assumptions about ethnic self-identification are taken into account, and that there is a net outflow of citizens at 38,000 a year, most of which are non-white and long term net migration like mentioned turns negative, this would result in the White British remaining at around 80% of the population by 2051, 20% of which would be ethnic minorities and 15% of that 20% would be non-white.
- Population groupings over time with projections up to 2051 by David Coleman (2010)
-
 White population over time
 -
 Ethnic minority population (non-whites)


Religion[edit]


In 2001, the question of religious adherence was asked for the first time since 1851 in the United Kingdom Census.[170]
The traditional religion in the United Kingdom is Christianity. In England the established church is the Church of England (Anglican). In Scotland, the Church of Scotland (a Presbyterian Church) is regarded as the 'national church' but there is not an established church.
In Wales there is no established church, with the Church in Wales having been disestablished in 1920. Likewise, in Ireland, the Church of Ireland was disestablished in 1871. In Northern Ireland and parts of Western Scotland there are lingering sectarian divides between Roman Catholic and Protestant communities.[171]
The table below shows data regarding religion for the 2001 and 2011 censuses:
| Religion | 2001[172][173][174][175] | 2011[176][177][178][179] | ||
|---|---|---|---|---|
| Number | % | Number | % | |
| Christian | 42,079,417 | 71.58% | 37,583,962 | 59.49% |
| Muslim | 1,591,126 | 2.71% | 2,786,635 | 4.41% |
| Hindu | 558,810 | 0.95% | 835,394 | 1.32% |
| Sikh | 336,149 | 0.57% | 432,429 | 0.68% |
| Jewish | 266,740 | 0.45% | 269,568 | 0.43% |
| Buddhist | 151,816 | 0.26% | 261,584 | 0.41% |
| Other religion | 178,837 | 0.30% | 262,774 | 0.42% |
| No religion | 16,221,509 | 25.67% | ||
| Religion not stated | 4,528,323 | 7.17% | ||
| (No religion and Religion not stated) | 13,626,299 | 23.18% | 20,749,832 | 32.84% |
| Total population | 58,789,194 | 100.00% | 63,182,178 | 100.00% |
- Religion in the 2011 census
-
 Christians (59.5%)


- Religious groups population pyramids in England and Wales in 2021
-
 Christian
 -
 No Religion
 -
 None stated/answered
 -
 Muslim
 -
 Hindu
Hindu -
 Sikh
Sikh -
 Buddhist
 -
 Jewish
 -
 Other Religion


In the 2011 Census, rather than select one of the specified religions offered on the Census form, many people chose to write in their own religion. Some of these religions were reassigned to one of the main religions offered. In England and Wales, 241,000 people belonged to religious groups which did not fall into any of the main religions.[180] The largest of these were Pagans (56,620), Spiritualists (39,061) and Jains (20,288).[181] Despite its high-profile nature there were only 2,418 Scientologists.[182] The census also recorded 176,632 people stating their religion as Jedi Knight and 6,242 people as Heavy Metal[183] after a campaign by Metal Hammer.[181] These returns were classified as "No religion", along with Atheist, Agnostic, Humanist, and Free Thinker.[183] Those who ticked Heathen who had been categorised as no religion in 2001 were categorised as other.[183] It is unclear how the ONS treated people who ticked "Other" but did not write in any religion.[183]
In 2012 the British Social Attitudes Survey found the highest number to be non-religious (48%) followed by Christians (46%) with another six per cent identifying otherwise. Discrepancies found between surveys may be the result of differences in phrasing, question order, and data collection method.[184]
Future projections[edit]
Pew Research Center has found that by 2050 on all scenarios, the Muslim population of the United Kingdom will rise, depending on the scenario the percentage of the population which will be Muslim will either be 9.7% in a zero migration scenario, 16.7% in a medium migration scenario or 17.2% in a high migration scenario.[185]
Languages[edit]
The United Kingdom's de facto official language is English which is spoken as a first language by 95% of the population. Six regional languages—Scots, Ulster-Scots, Welsh, Cornish, Irish and Scottish Gaelic—are protected under the European Charter for Regional or Minority Languages. Abilities in these languages (other than Cornish) for those aged three and above were recorded in the census of 2011 as follows.[186][187][188]
Regional languages[edit]
| Ability | 2011 | |||||||||
|---|---|---|---|---|---|---|---|---|---|---|
| Wales | Scotland | Northern Ireland | ||||||||
| Welsh | Scottish Gaelic | Scots | Irish | Ulster-Scots | ||||||
| Number | % | Number | % | Number | % | Number | % | Number | % | |
| Understands but does not speak, read or write | 157,792 | 5.15% | 23,357 | 0.46% | 267,412 | 5.22% | 70,501 | 4.06% | 92,040 | 5.30% |
| Speaks, reads and writes | 430,717 | 14.06% | 32,191 | 0.63% | 1,225,622 | 23.95% | 71,996 | 4.15% | 17,228 | 0.99% |
| Speaks but does not read or write | 80,429 | 2.63% | 18,966 | 0.37% | 179,295 | 3.50% | 24,677 | 1.42% | 10,265 | 0.59% |
| Speaks and reads but does not write | 45,524 | 1.49% | 6,218 | 0.12% | 132,709 | 2.59% | 7,414 | 0.43% | 7,801 | 0.45% |
| Reads but does not speak or write | 44,327 | 1.45% | 4,646 | 0.09% | 107,025 | 2.09% | 5,659 | 0.33% | 11,911 | 0.69% |
| Other combination of skills | 40,692 | 1.33% | 1,678 | 0.03% | 17,381 | 0.34% | 4,651 | 0.27% | 959 | 0.06% |
| No skills | 2,263,975 | 73.90% | 5,031,167 | 98.30% | 3,188,779 | 62.30% | 1,550,813 | 89.35% | 1,595,507 | 91.92% |
| Total | 3,063,456 | 100.00% | 5,118,223 | 100.00% | 5,118,223 | 100.00% | 1,735,711 | 100.00% | 1,735,711 | 100.00% |
| Can speak | 562,016 | 18.35% | 57,602 | 1.13% | 1,541,693 | 30.12% | 104,943 | 6.05% | 35,404 | 2.04% |
| Has some ability | 799,481 | 26.10% | 87,056 | 1.70% | 1,929,444 | 37.70% | 184,898 | 10.65% | 140,204 | 8.08% |
Cornish is spoken by around 2,500 people. In the 2011 census, 464 respondents aged three and over in Cornwall said that Cornish was their main language, amounting to 0.09% of the total population of Cornwall aged three and over.
-
 Welsh
Welsh -
 Scots
Scots -
 Scottish Gaelic
 -
 Irish
Irish -
 Ulster-Scots


After English, Polish was the second most common language given in the United Kingdom census 2011. 618,091 respondents aged three and over said that Polish was their main language, amounting to 1.01% of the total population of the United Kingdom aged three and over.
The French language is spoken in some parts of the Channel Islands although the islands, like the Isle of Man, are not part of the United Kingdom.[189] British Sign Language is also common.
Proficiency in English[edit]
| Language proficiency | England and Wales | |||
|---|---|---|---|---|
| 2011[190] | 2021[191] | |||
| Number | % | Number | % | |
| Main language is English | 49,808,185 | 92.3% | 52,569,816 | 91.1% |
| Main language is not English | 4,153,266 | 7.7% | 5,134,447 | 8.9% |
| Can speak English very well | 1,722,197 | 3.2% | 2,255,542 | 3.9% |
| Can speak English well | 1,567,919 | 2.9% | 1,838,559 | 3.2% |
| Cannot speak English well | 725,639 | 1.3% | 879,782 | 1.5% |
| Cannot speak English | 137,511 | 0.3% | 160,564 | 0.3% |
| Total | 53,961,451 | 100% | 57,704,263 | 100% |
National identity[edit]
Respondents to the 2011 UK census gave their national identities as follows.
| National identity | Years | ||||||
|---|---|---|---|---|---|---|---|
| 2011[192][193][194] | 2021[195] | ||||||
| United Kingdom |
Country | Country | |||||
| England | Scotland | Wales | N. Ireland | England | Wales | ||
| 51.41% | 60.38% | 2.28% | 11.22% | 0.60% | 15.3% | 9.1% | |
| 5.93% | 0.79% | 62.43% | 0.50% | 0.37% | 0.4% | 0.4% | |
| 3.26% | 0.55% | 0.15% | 57.51% | 0.06% | 0.3% | 55.2% | |
| Northern Irish only | 0.81% | 0.21% | 0.33% | 0.14% | 20.94% | 0.1% | 0.1% |
| 18.77% | 19.19% | 8.37% | 16.95% | 39.89% | 56.8% | 18.5% | |
| 7.82% | 9.09% | 1.26% | 1.54% | 0.27% | 14.3% | 1.8% | |
| 1.67% | 0.15% | 18.29% | 0.07% | 0.09% | 0.2% | 0.1% | |
| 0.44% | 0.11% | 0.06% | 7.11% | 0.02% | 0.2% | 8.1% | |
| Northern Irish and British only | 0.22% | 0.03% | 0.15% | 0.02% | 6.17% | 0.1% | 0.0% |
| Other combination of UK identities only (excludes Irish) | 0.45% | 0.37% | 1.01% | 1.10% | 0.13% | 0.4% | 1.3% |
| Other identity and at least one UK identity | 0.97% | 0.90% | 1.25% | 0.43% | 3.05% | 1.9% | 1.1% |
| 1.31% | 0.64% | 0.41% | 0.32% | 25.26% | 0.5% | 0.3% | |
| Other | 6.94% | 7.59% | 4.01% | 3.10% | 3.12% | 9.5% | 4% |
| Total | 100% | 100% | 100% | 100% | 100% | 100% | 100% |
- Identity group population pyramids in England and Wales in 2021
-
 English only
 -
 British only
 -
 Welsh only
 -
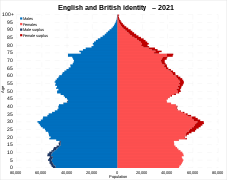 English and British identity
 -
 UK and Non-UK identity
 -
 Non-UK identity


Education[edit]


In the present day each country of the United Kingdom has a separate education system, with power over education matters in Scotland, Wales and Northern Ireland being devolved.
Universal state education in England and Wales was introduced for primary level in 1870 and secondary level in 1900.[196] Education is mandatory from the ages of 5 to 18, The majority of children are educated in state-sector schools,[197] only a small proportion of which select on the grounds of academic ability. Despite a fall in actual numbers, the proportion of children in England attending private schools rose slightly from 7.1% to 7.3% between 2004 and 2007.[197]
Scotland first legislated for universal provision of education in 1696. Four per cent of children in Scotland attend private schools, a rate which has remained relatively stable since 2015.[198][199]
In Wales, one of the most notable distinctive features of education in Wales is the emphasis on the Welsh language – lessons in which are compulsory for all until the age of 16. Whilst a significant minority of students (15.7% in the 2014\15 academic year) are taught primarily through the medium of Welsh.[200]
| Level of qualification | England and Wales (aged 16 and over, not in education) | |||||
|---|---|---|---|---|---|---|
| 2001[201] | 2011[202] | 2021[203] | ||||
| Number | % | Number | % | Number | % | |
| No qualifications | 10,937,042 | 29.1 | 10,307,327 | 22.7% | 8,827,472 | 18.2% |
| Level 1 and entry level qualifications | 6,230,033 | 16.6 | 6,047,384 | 13.3% | 4,679,223 | 9.6% |
| Level 2 qualifications | 7,288,074 | 19.4 | 6,938,433 | 15.3% | 6,493,490 | 13.4% |
| Apprenticeship | – | – | 1,631,777 | 3.6% | 2,590,252 | 5.3% |
| Level 3 qualifications | 3,110,135 | 8.3 | 5,617,802 | 12.3% | 8,225,629 | 16.9% |
| Level 4 qualifications or above | 7,432,962 | 19.8 | 12,383,477 | 27.2% | 16,413,231 | 33.8% |
| Other qualifications | 2,609,192 | 6.9 | 2,570,580 | 5.7% | 1,337,076 | 2.8% |
| Total | 37,607,438 | 100% | 45,496,780 | 100% | 48,566,373 | 100% |
See also[edit]
- Demographics of England
- Demographics of Scotland
- Demographics of Wales
- Demographics of Northern Ireland
- Demographics of London
- Demographics of Birmingham
- Demographics of Liverpool
- Demographics of Greater Manchester
- Demographics of Tees Valley
- City status in the United Kingdom
- List of cities in the United Kingdom
- List of urban areas in the United Kingdom
- Genetic history of the British Isles
Notes and references[edit]
Notes[edit]
- ^ Note: Crude migration change (per 1000) is a trend analysis, an extrapolation based average population change (current year minus previous) minus natural change of the current year (see table vital statistics). As average population is an estimate of the population in the middle of the year and not end of the year.
- ^ In fertility rates, 2.1 and above is a stable population and has been marked blue, 2 and below leads to an aging population and the result is that the population decreases.
- ^ Note: This table has been suggested by the author of the study that it can be correlated with the table on TFR's on different ethnic groups, see below section for said table
- ^ Note: discontinuity in estimates from 1993 to 1996. This increase in total fertility arises from a re-basing of the population estimates for ethnic minorities from the results of the 1991 census. These fertility estimates were not published in 1998–2000 and the only years for which estimates are now published are 1991 and 2001.
- ^ Ethnic minority population has been defined historically in different terms but refers to individuals who are 'non-white'. Starred years are estimates of the total population of ethnic minorities in the country while non-starred are census year figures.
- ^ Percentage for Great Britain, not the entirety of the United Kingdom
- ^ Percentage for Great Britain, not the entirety of the United Kingdom
- ^ Report states that births in which no ethnicity was stated were usually White British. If assumptions about all non-stated births are actually White British, the percentage of the group rises to 75.2% of births in 2005 and 80.3% White overall.
References[edit]
- ^ a b c d "Estimates of the population for the UK, England, Wales, Scotland, and Northern Ireland". Office for National Statistics. 26 March 2024. Retrieved 9 April 2024.
- ^ a b c d e "World Factbook EUROPE : United Kingdom", The World Factbook, 12 July 2018
- ^ "Table 2 2011 Census: Usual resident population and population density, the local authorities in the United Kingdom 17 December 2012". Ons.gov.uk. 17 December 2012. Retrieved 23 December 2012.
- ^ a b c d e f g h i j k l m n o p q r s t u v w x y z aa ab ac ad ae af ag ah ai aj ak al am an ao ap aq ar Chappell, Roma, ed. (2005). "Chapter 1: The UK population past, present and future.". Focus On People and Migration. Palgrave Macmillan London. doi:10.1007/978-1-349-75096-2. ISBN 978-1-4039-9327-4.
- ^ UK Literacy Rate 2003 [CIA] World Book; retrieved 17 June 2013.
- ^ Education (Scotland) Act 1872
- ^ "School leaving age". GOV.UK.
- ^ a b Joan P. Alcock, A Brief History of Roman Britain, page 260, Hachette UK
- ^ Will Durant (7 June 2011). Caesar and Christ: The Story of Civilization. Simon and Schuster. pp. 468–. ISBN 978-1-4516-4760-0.
- ^ Anne Lancashire (2002). London Civic Theatre: City Drama and Pageantry from Roman Times to 1558. Cambridge University Press. p. 19. ISBN 978-0-5216-3278-2.
- ^ "Anglo-Saxon". Britannica. 27 April 2023.
- ^ "Settlers". Oxford Museum of Natural History.
- ^ Wood, Michael (25 May 2012). "Viewpoint: The time Britain slid into chaos". BBC News.
- ^ "Life in the eleventh century". Domesday Book Online.
- ^ "Early census-taking in England and Wales". Office for National Statistics.
- ^ A portrait of Britain in 2031, The Independent, 24 October 2007
- ^ Statistics | Counting the Emigrants, Public Record Office of Northern Ireland
- ^ History and Lessons of Potato Late Blight Archived 9 May 2011 at the Wayback Machine, University of California
- ^ a b c 1841: A window on Victorian Britain, The Independent, 25 April 2006
- ^ Irish-Catholic Immigration, The Library of Congress
- ^ Mabel C. Buer, Health, Wealth and Population in the Early Days of the Industrial Revolution, London: George Routledge & Sons, 1926, page 30 ISBN 0-415-38218-1
- ^ Mintz, Steven. "The Irish Potato Famine". Digitalhistory.uh.edu. Archived from the original on 23 August 2012. Retrieved 31 July 2012.
- ^ a b "Ireland – Population Summary". Homepage.tinet.ie. Retrieved 31 July 2012.
- ^ a b c d e f g h i j k l m n o p Sigle, Wendy (2016), Rindfuss, Ronald R.; Choe, Minja Kim (eds.), "Fertility and Population Change in the United Kingdom", Low Fertility, Institutions, and their Policies: Variations Across Industrialized Countries, Cham: Springer International Publishing, pp. 77–98, doi:10.1007/978-3-319-32997-0_4, ISBN 978-3-319-32997-0, retrieved 31 May 2022
- ^ Somerville, Will (26 September 2007). Immigration Under New Labour. Policy Press. ISBN 978-1-86134-967-5.
- ^ Table 1 2011 Census: Usual resident population by five-year age group and sex, United Kingdom and constituent countries, Accessed 20 December 2012
- ^ "2011 Census – Built-up areas". ONS. Retrieved 20 August 2013.
- ^ "United Kingdom Population 2019", World Population Review
- ^ "Population Estimates for UK, England and Wales, Scotland and Northern Ireland: mid-2020". Office for National Statistics.
- ^ "The Countries of the UK". Office for National Statistics. Archived from the original on 8 January 2016. Retrieved 15 October 2017.
- ^ "National Statistics Online" (PDF). Archived from the original (PDF) on 29 June 2011.
- ^ "UK 2011 Census". Ond.gov.uk.
- ^ "UK Population Estimates 1851 to 2014– Office for National Statistics". Office for National Statistics. September 2014. Retrieved 17 March 2017.
- ^ a b "National population projections, background and methodology: 2018-based - Office for National Statistics". www.ons.gov.uk. Retrieved 19 December 2022.
- ^ National Population Projections, 2016-based, retrieved 29 October 2017
- ^ a b c d e f g h i j k l Chappell, Roma, ed. (2005). "Chapter 5: Fertility and Mortality". Focus On People and Migration. Palgrave Macmillan London. doi:10.1007/978-1-349-75096-2. ISBN 978-1-4039-9327-4.
- ^ a b c d Max Roser (2014), "Total Fertility Rate around the world over the last centuries", Our World In Data, Gapminder Foundation, archived from the original on 5 July 2019, retrieved 7 August 2018
- ^ Szreter, Simon (1996). Fertility, Class and Gender in Britain, 1860–1940. Cambridge Studies in Population, Economy and Society in Past Time. Cambridge: Cambridge University Press. ISBN 978-0-521-34343-5.
- ^ a b c d e f g h i j Teitelbaum, Michael S. (14 July 2014). The British Fertility Decline: Demographic Transition in the Crucible of the Industrial Revolution. Princeton University Press. ISBN 978-1-4008-5715-9.
- ^ a b c d Galor, Oded (2005). "The Demographic Transition and the Emergence of Sustained Economic Growth". Journal of the European Economic Association. 3 (2/3): 494–504. doi:10.1162/jeea.2005.3.2-3.494. ISSN 1542-4766. JSTOR 40004992.
- ^ a b Hatton, Timothy J.; Martin, Richard M. (1 October 2010). "Fertility decline and the heights of children in Britain, 1886–1938". Explorations in Economic History. 47 (4): 505–519. doi:10.1016/j.eeh.2010.05.003. hdl:1885/66235. ISSN 0014-4983. S2CID 1137234.
- ^ a b c d e f Galor, Oded (1 January 2012). "The demographic transition: causes and consequences". Cliometrica. 6 (1): 1–28. doi:10.1007/s11698-011-0062-7. ISSN 1863-2513. PMC 4116081. PMID 25089157.
- ^ Vandenbroucke, Guillaume (May 2012). "Optimal fertility during World War I". mpra.ub.uni-muenchen.de. Retrieved 3 June 2022.
- ^ a b Tomassini, Cecilia (2005). "The demographic characteristics of the oldest old in the United Kingdom". Population Trends (120): 15–22. ISSN 0307-4463. PMID 16025700.
- ^ a b c d e f g h i Shaw, C.; Haskey, J. (1999). "New estimates and projections of the population cohabiting in England and Wales". Population Trends (95): 7–17. ISSN 0307-4463. PMID 10368842.
- ^ "Fertility: UK fertility highest since 1980". Office for National Statistics. 22 August 2007. Retrieved 22 September 2007.
- ^ a b c d e "Vital Statistics: Population and Health Reference Tables (February 2014 Update): Annual Time Series Data". ONS. Retrieved 27 April 2014.
- ^ "Place Analytics". Archived from the original on 24 February 2021. Retrieved 7 August 2011.
- ^ "Large decrease in number of births, ONS figures show". BBC News. 16 July 2014.
- ^ Gillespie, Rosemary (1 January 1999). "Voluntary childlessness in the United Kingdom". Reproductive Health Matters. 7 (13): 43–53. doi:10.1016/S0968-8080(99)90111-8. ISSN 0968-8080.
- ^ a b c d e "Life expectancy". Our World in Data. Retrieved 28 August 2018.
- ^ a b Marshall, Louise; Finch, David; Cairncross, Liz; Bibby, Jo (November 2019). "Mortality and life expectancy trends in the UK: stalling progress" (PDF).
- ^ Leon, David A; Jdanov, Dmitry A; Shkolnikov, Vladimir M (1 November 2019). "Trends in life expectancy and age-specific mortality in England and Wales, 1970–2016, in comparison with a set of 22 high-income countries: an analysis of vital statistics data". The Lancet Public Health. 4 (11): e575–e582. doi:10.1016/S2468-2667(19)30177-X. hdl:10037/17628. ISSN 2468-2667. PMID 31677776. S2CID 207892521.
- ^ a b c "Life expectancy rises 'grinding to halt' in England". BBC News. 18 July 2017. Retrieved 6 July 2022.
- ^ "Austerity blamed for life expectancy stalling for first time in century". The Guardian. 25 February 2020. Retrieved 6 July 2022.
- ^ a b c d Lee, Georgina (29 March 2019). "FactCheck: is austerity reducing life expectancy?". Channel 4 News. Retrieved 6 July 2022.
- ^ "World Population Prospects – Population Division – United Nations". Archived from the original on 19 September 2016. Retrieved 15 July 2017.
- ^ a b c Woods, R.I.; Watterson, P.A.; Woodward, JH. (1 November 1988). "The Causes of Rapid Infant Mortality Decline in England and Wales, 1861–1921 Part I". Population Studies. 42 (3): 343–366. doi:10.1080/0032472031000143516. ISSN 0032-4728. PMID 11613879.
- ^ a b Galley (31 December 2021). "Infant Mortality in England, 1538–2000: Decline in the Twentieth Century". Local Population Studies. 107 (1): 122–196. doi:10.35488/lps107.2021.122 (inactive 15 March 2024). S2CID 250470810.
{{cite journal}}: CS1 maint: DOI inactive as of March 2024 (link) - ^ a b c Galley, Chris (30 June 2021). "Infant Mortality in England, 1538-2000: Stability and the Beginnings of Change, 1837-1910". Local Population Studies. 106 (1): 98–209. doi:10.35488/lps106.2021.98 (inactive 15 March 2024). S2CID 237806062.
{{cite journal}}: CS1 maint: DOI inactive as of March 2024 (link) - ^ a b c HATTON, TIMOTHY (January 2011). "Infant mortality and the health of survivors: Britain, 1910–50". The Economic History Review. 64 (3): 951–972. doi:10.1111/j.1468-0289.2010.00572.x. PMID 22069806. S2CID 8797147.
- ^ "Recommendations of the Inter-Departmental Committee on Physical Deterioration". The Journal of State Medicine. 12 (9): 561–568. 1904. ISSN 0368-4407. JSTOR 45161539.
- ^ a b Stockdale, Aileen (May 2011). "A review of demographic ageing in the UK: opportunities for rural research: A Review of Demographic Ageing in the UK". Population, Space and Place. 17 (3): 204–221. doi:10.1002/psp.591.
- ^ 2011 Census: Population Estimates for the United Kingdom, 27 March 2011, Ons.gov.uk, Accessed 21 December 2012
- ^ Structure of Population by Age Archived 17 November 2014 at the Wayback Machine Bluenomics
- ^ "Estimates of the very old (including centenarians), UK – Office for National Statistics". Ons.gov.uk. Retrieved 16 September 2017.
- ^ "Estimates of the very old (including centenarians), UK – Office for National Statistics". Ons.gov.uk. Retrieved 16 September 2017.
- ^ Population Estimates for UK, England and Wales, Scotland and Northern Ireland: Mid-2016, Office for National Statistics
- ^ "National Population Projections, 2016-based – Office for National Statistics". Ons.gov.uk. Retrieved 29 October 2017.
- ^ Office for National Statistics, Article: Overview for UK population: July 2017
- ^ "Overview of the UK population – Office for National Statistics".
- ^ Ritchie, Hannah; Roser, Max (20 September 2019). "Age Structure". Our World in Data.
- ^ "European Countries By Population Density". WorldAtlas. 16 September 2020. Retrieved 3 June 2022.
- ^ "2011 Census - Built-up areas". ONS. Retrieved 1 July 2013.
- ^ "NRS – Background Information Settlements and Localities" (PDF). National Records of Scotland. Retrieved 29 September 2020.
- ^ The UK's major urban areas Office for National Statistics (Urban area of Belfast and connected settlements, Table 3.1, page 47)
- ^ a b c d e f Herbert, David (1982), "Towns and cities", The changing geography of the United Kingdom, Routledge, pp. 190–212, doi:10.4324/9781003071105-10, ISBN 978-1-003-07110-5, S2CID 225136347, retrieved 8 June 2022
- ^ a b c d Quirk, Joel; Richardson, David (1 December 2010). "Religion, Urbanisation and Anti-Slavery Mobilisation in Britain, 1787–1833". European Journal of English Studies. 14 (3): 263–279. doi:10.1080/13825577.2010.517298. ISSN 1382-5577. S2CID 144274555.
- ^ White, Matthew. "The rise of cities in the 18th century". British Library. Archived from the original on 10 June 2022. Retrieved 10 June 2022.
- ^ a b "What Were the Largest Cities Throughout History?". ThoughtCo. Retrieved 6 June 2022.
- ^ a b Watson, C. (2008). "TRENDS IN WORLD URBANISATION". S2CID 32442081.
{{cite web}}: Missing or empty|url=(help) - ^ a b "2011 rural/urban classification – Office for National Statistics". www.ons.gov.uk. Retrieved 9 June 2022.
- ^ Ritchie, Hannah; Roser, Max (13 June 2018). "Urbanization". Our World in Data.
- ^ a b c "The Rural-Urban Definition". GOV.UK. Retrieved 8 June 2022.
- ^ "United Kingdom population mid-year estimate". Office for National Statistics. Retrieved 6 March 2018.
- ^ "Vital statistics: population and health reference tables". Office for National Statistics. Retrieved 6 March 2018.
- ^ a b "The demographic transition". Our World in Data. Retrieved 11 March 2023.
- ^ Polio outbreak. Smallman-Raynor, M. R.; Cliff, A. D. (2006). Poliomyelitis : a world geography: emergence to eradication. Oxford University Press. pp. 317–18. ISBN 019924474X.
- ^ "UK Population Estimates 1851 to 2014 – Office for National Statistics". Ons.gov.uk. Retrieved 8 March 2022.
- ^ "Vital statistics in the UK: births, deaths and marriages – Office for National Statistics". Ons.gov.uk. Retrieved 19 January 2022.
- ^ "Deaths registered monthly in England and Wales - 2022 edition". Office for National Statistics. Retrieved 4 September 2023.
- ^ "Vital Events Reference Tables 2022". National Records of Scotland. 31 May 2013. Retrieved 4 September 2023.
- ^ "Monthly deaths". Northern Ireland Statistics and Research Agency. 12 January 2017. Retrieved 4 September 2023.
- ^ "Deaths registered monthly in England and Wales - 2023 edition". Office for National Statistics. Retrieved 6 February 2024.
- ^ "Vital Events Reference Tables 2023". National Records of Scotland. 31 May 2013. Retrieved 6 February 2024.
- ^ "Monthly deaths". Northern Ireland Statistics and Research Agency. 12 January 2017. Retrieved 6 February 2024.
- ^ "Deaths, Northern Ireland". Nisra.gov.uk. 12 January 2017.
- ^ "Monthly Data on Births and Deaths Registered in Scotland". Nrscotland.gov.uk. 31 May 2013.
- ^ "Deaths registered monthly in England and Wales – Office for National Statistics". Ons.gov.uk. Retrieved 8 March 2022.
- ^ a b "UNSD — Demographic and Social Statistics". unstats.un.org. Retrieved 10 May 2023.
- ^ "Parents' country of birth - Office for National Statistics".
- ^ Lawrie, Eleanor (24 September 2021). "LGBT freshers: 'I worried Oxford wouldn't accept me'". BBC News. Retrieved 28 September 2021.
- ^ "Sexual orientation, England and Wales - Office for National Statistics". www.ons.gov.uk. Retrieved 18 October 2023.
- ^ Team, National Records of Scotland Web (31 May 2013). "National Records of Scotland". National Records of Scotland. Retrieved 18 October 2023.
- ^ "TS077 - Sexual orientation - Nomis - Official Census and Labour Market Statistics". www.nomisweb.co.uk. Retrieved 7 May 2023.
- ^ "Census 2021 main statistics sexual orientation tables". Northern Ireland Statistics and Research Agency. 14 March 2023. Retrieved 18 October 2023.
- ^ "Gender identity, England and Wales - Office for National Statistics". www.ons.gov.uk. Retrieved 4 November 2023.
- ^ "Gender identity: age and sex, England and Wales - Office for National Statistics". www.ons.gov.uk. Retrieved 4 November 2023.
- ^ "Conceptions in England and Wales – Office for National Statistics". www.ons.gov.uk. Retrieved 9 June 2022.
- ^ "Conceptions in England and Wales - Office for National Statistics". www.ons.gov.uk. Retrieved 29 June 2022.
- ^ "KS008 - Health and provision of unpaid care - Nomis - Official Census and Labour Market Statistics". www.nomisweb.co.uk. Retrieved 7 May 2023.
- ^ "QS302EW (General health) - Nomis - Official Census and Labour Market Statistics". www.nomisweb.co.uk. Retrieved 7 May 2023.
- ^ "TS037 - General health - Nomis - Official Census and Labour Market Statistics". www.nomisweb.co.uk. Retrieved 7 May 2023.
- ^ "1991 census - local base statistics - Nomis - Official Census and Labour Market Statistics". www.nomisweb.co.uk. Retrieved 8 May 2023.
- ^ "KS008 - Health and provision of unpaid care - Nomis - Official Census and Labour Market Statistics". www.nomisweb.co.uk. Retrieved 8 May 2023.
- ^ "QS303EW (Long-term health problem or disability) - Nomis - Official Census and Labour Market Statistics". www.nomisweb.co.uk. Retrieved 8 May 2023.
- ^ "TS038 - Disability - Nomis - Official Census and Labour Market Statistics". www.nomisweb.co.uk. Retrieved 8 May 2023.
- ^ "United Kingdom", The World Factbook, Central Intelligence Agency, 20 May 2022, retrieved 27 May 2022
- ^ "1981 census - small area statistics - Nomis - Official Census and Labour Market Statistics". www.nomisweb.co.uk. Retrieved 7 May 2023.
- ^ "1991 census - local base statistics - Nomis - Official Census and Labour Market Statistics". www.nomisweb.co.uk. Retrieved 7 May 2023.
- ^ "UV037 - Method of travel to work - Nomis - Official Census and Labour Market Statistics". www.nomisweb.co.uk. Retrieved 7 May 2023.
- ^ "QS701EW (Method of travel to work) - Nomis - Official Census and Labour Market Statistics". www.nomisweb.co.uk. Retrieved 7 May 2023.
- ^ "TS061 - Method used to travel to work - Nomis - Official Census and Labour Market Statistics". www.nomisweb.co.uk. Retrieved 7 May 2023.
- ^ a b Panayi, Panikos (11 September 2014). An Immigration History of Britain: Multicultural Racism since 1800. Routledge. ISBN 978-1-317-86423-3.
- ^ "Immigration". Parliamentary Debates (Hansard). 19 March 2003. Retrieved 7 February 2023.
- ^ a b David, Mason (23 July 2003). Explaining ethnic differences: Changing patterns of disadvantage in Britain. Policy Press. ISBN 978-1-84742-576-8.
- ^ Latorre, Will Somerville Will Somerville, Dhananjayan Sriskandarajah, Maria (21 July 2009). "United Kingdom: A Reluctant Country of Immigration". migrationpolicy.org. Retrieved 8 February 2023.
{{cite web}}: CS1 maint: multiple names: authors list (link) - ^ Somerville, Will Somerville Will (10 May 2007). "The Immigration Legacy of Tony Blair". migrationpolicy.org. Retrieved 8 February 2023.
- ^ Somerville, Will (26 September 2007). Immigration Under New Labour. Policy Press. ISBN 978-1-86134-967-5.
- ^ "Immigration Rules Relaxed". www.bbc.co.uk. Retrieved 7 February 2023.
- ^ Kalia, Kirin (1 December 2005). "EU Disunion: Immigration in an Enlarged Europe". migrationpolicy.org. Retrieved 8 February 2023.
- ^ a b Quetteville, Harry de (24 June 2021). "EU immigration to the UK underestimated by 1.6 million". The Telegraph. ISSN 0307-1235. Retrieved 7 February 2023.
- ^ "EU migration to UK 'underestimated' by ONS". BBC News. 21 August 2019. Retrieved 7 February 2023.
- ^ Watt, Nicholas; Wintour, Patrick (24 March 2015). "How immigration came to haunt Labour: the inside story". The Guardian. ISSN 0261-3077. Retrieved 7 February 2023.
- ^ Sillitoe, K.; White, P. H. (1992). "Ethnic Group and the British Census: The Search for a Question". Journal of the Royal Statistical Society. Series A (Statistics in Society). 155 (1): 141–163. doi:10.2307/2982673. ISSN 0964-1998. JSTOR 2982673. PMID 12159122.
- ^ "Table 1.3: Overseas-born population in the United Kingdom, excluding some residents in communal establishments, by sex, by country of birth, January 2019 to December 2019". Office for National Statistics. 21 May 2020. Figure given is the central estimate. See the source for 95% confidence intervals.
- ^ a b c d "UK Government Web Archive" (PDF). webarchive.nationalarchives.gov.uk. Retrieved 12 March 2023.
- ^ Taken from Casweb UK Data Service from the 1971 UK wide Census. SAS08 of Country of Birth of England, Scotland and Wales
- ^ Taken from Casweb UK Data Service from the 1981 UK wide Census. Table 4 of Country of Birth in England, Scotland and Wales.
- ^ Taken from Casweb UK Data Service from the 1991 UK wide Census. Table 4 of Country of Birth in England, Scotland, Wales and a separate table on Northern Ireland
- ^ This does not include Other (New Commonwealth)
- ^ Coleman, D. A.; Dubuc, S. (1 March 2010). "The fertility of ethnic minorities in the UK, 1960s–2006". Population Studies. 64 (1): 19–41. doi:10.1080/00324720903391201. ISSN 0032-4728. PMID 20087815. S2CID 11039594.
- ^ "Why have the white British left London?". BBC News. 20 February 2013. Retrieved 6 June 2022.
- ^ a b "London population: Why so many people leave the UK's capital". BBC News. 18 March 2019. Retrieved 6 June 2022.
- ^ Data is taken from United Kingdom Casweb Data services of the United Kingdom 1991 Census on Ethnic Data for England, Scotland and Wales (Table 6)
- ^ "Office of National Statistics; 2001 Census Key Statistics". webarchive.nationalarchives.gov.uk. Retrieved 7 September 2021.
- ^ "Analysis of Ethnicity in the 2001 Census – Summary Report". www.gov.scot. Retrieved 7 September 2021.
- ^ "Northern Ireland Neighbourhood Information Service". 2001.
- ^ "Office of National Statistics; 2011 Census Key Statistics". webarchive.nationalarchives.gov.uk. Retrieved 7 September 2021.
- ^ "2011 Census: Ethnic Group, local authorities in England and Wales". webarchive.nationalarchives.gov.uk. Retrieved 15 December 2021.
- ^ "2011 Census: Key Results from Releases 2A to 2D". Scotland's Census. Retrieved 15 December 2021.
- ^ "Table DC2206NI – National Identity (Classification 1) by Ethnic Group". Northern Ireland Statistics and Research Agency.
- ^ "Ethnic group, England and Wales: Census 2021". Office for National Statistics. Retrieved 3 January 2024.
- ^ "Ethnicity". Scotland's census. Retrieved 3 January 2024.
- ^ "Census 2021 main statistics ethnicity tables". NISRA. 7 September 2022. Retrieved 3 January 2024.
- ^ "Table KS201SC – Ethnic group: All people" (PDF). National Records of Scotland. 2013. Archived from the original (PDF) on 24 September 2015. Retrieved 28 April 2015.
- ^ "Ethnic group". Office for National Statistics. 2 November 2011. Retrieved 27 April 2015.
- ^ Haug, Werner; Committee, Council of Europe European Population; Compton, Paul; Courbage, Youssef; Affairs, Council of Europe Directorate of Social and Health; Cohesion, Council of Europe Directorate General III—Social (1 January 2002). The Demographic Characteristics of Immigrant Populations. Council of Europe. ISBN 978-92-871-4974-9.
{{cite book}}: CS1 maint: multiple names: authors list (link) - ^ Spencer, Ian R. G. (1997). British immigration policy since 1939 : the making of multi-racial Britain. Internet Archive. New York : Routledge. p. 16. ISBN 978-0-415-13695-2.
As recently as 1939 the permanent Asian and Black population of the United Kingdom was officially estimated at about 7,000 people.
- ^ "Pupil census: supplementary statistics". www.gov.scot. Retrieved 4 November 2022.
- ^ "Schools, pupils and their characteristics, Academic Year 2021/22". explore-education-statistics.service.gov.uk. Retrieved 9 September 2022.
- ^ "Schools' census results: April 2021". GOV.WALES. 9 September 2021. Retrieved 5 November 2022.
- ^ "School and pupil characteristics". webarchive.nationalarchives.gov.uk. Retrieved 8 November 2022.
- ^ "Births and infant mortality by ethnicity, England and Wales". Retrieved 31 January 2022.
- ^ "Birthweight and gestational age by ethnic group, England and Wales 2005: introducing new data on births" (PDF). 15 February 2009. Archived from the original (PDF) on 15 February 2009. Retrieved 22 August 2022.
- ^ Coleman, David (17 November 2010). "When Britain becomes 'majority minority'". Prospect.
- ^ "White Britons 'will be minority' by 2066, says professor". www.telegraph.co.uk. 2 May 2013. Retrieved 14 January 2022.
- ^ David Coleman (2010), "Projections of the Ethnic Minority Populations of the United Kingdom 2006–2056", Population and Development Review, vol. 36, Wiley Online Library, pp. 441–486
- ^ Coleman, David (17 November 2010). "When Britain becomes 'majority minority'". Prospect.
- ^ "Census to ask people about religious beliefs". The Guardian. 11 January 2000. Retrieved 14 June 2022.
- ^ Antonia Fraser amply covers aspects of this sectarian divide in her book, The King and the Catholics (New York: Doubleday, 2018).
- ^ "Religion (2001 Census)". data.gov.uk. 9 February 2010. Retrieved 18 December 2012.
- ^ "Summary: Religious Group Demographics". scotland.gov.uk. Retrieved 18 December 2012.
- ^ "Census 2001: Religion (administrative geographies)". nisra.gov.uk. Retrieved 18 December 2012.
- ^ "Table KS07c: Religion (full list with 10 or more persons)". nisra.gov.uk. Archived from the original on 25 February 2013. Retrieved 18 December 2012.
- ^ "2011 Census: KS209EW Religion, local authorities in England and Wales". ons.gov.uk. 2 July 2010. Retrieved 18 December 2012.
- ^ "Scotland's Census 2011: Table KS209SCa" (PDF). scotlandcensus.gov.uk. Retrieved 26 September 2013.
- ^ "Census 2011: Religion: KS211NI (administrative geographies)". nisra.gov.uk. Retrieved 18 December 2012.
- ^ "Census 2011: Religion – Full Detail: QS218NI – Northern Ireland". nisra.gov.uk. Retrieved 1 October 2013.
- ^ Census Table QS210EW Religion (detailed), Ons.gov.uk, retrieved 4 May 2015.
- ^ a b "'Jedi' religion most popular alternative faith". The Telegraph. 11 December 2012. Retrieved 14 November 2020.
- ^ Booth, Robert (11 December 2012). "Census 2011 data on religion reveals Jedi Knights are in decline". The Guardian. ISSN 0261-3077. Retrieved 14 November 2020.
- ^ a b c d "Census 2011 – Any other religion? |". Brin.ac.uk. Retrieved 14 November 2020.
- ^ Michael Lipka (24 April 2014). Cameron's 'Christian country': What the numbers say about religion in the United Kingdom (Report). Pew Research.
- ^ "Europe's Growing Muslim Population". Pew Research Center's Religion & Public Life Project. 29 November 2017. Retrieved 27 May 2022.
- ^ "NOMIS – Census 2011". Retrieved 28 July 2014.
- ^ "Scotland's Census 2011 – Standard Outputs". Retrieved 28 July 2014.
- ^ "Northern Ireland Neighbourhood Information Service". Retrieved 28 July 2014.
- ^ "Royal.gov.uk". Royal.gov.uk. Archived from the original on 21 September 2012. Retrieved 4 October 2012.
- ^ "QS205EW (Proficiency in English) - Nomis - Official Census and Labour Market Statistics". www.nomisweb.co.uk. Retrieved 7 May 2023.
- ^ "TS029 - Proficiency in English - Nomis - Official Census and Labour Market Statistics". www.nomisweb.co.uk. Retrieved 7 May 2023.
- ^ 2011 Census, England and Wales: National identity (detailed), local authorities in England and Wales, Accessed 2 April 2014
- ^ 2011 Census, Scotland: National identity (detailed) Archived 7 April 2014 at the Wayback Machine, Accessed 2 April 2014
- ^ 2011 Census, Northern Ireland: National Identity – Full Detail, Accessed 2 April 2014
- ^ "TS027 - National identity - UK - Nomis - Official Census and Labour Market Statistics". www.nomisweb.co.uk. Retrieved 6 May 2023.
- ^ "United Kingdom". Humana. Archived from the original on 3 October 2006. Retrieved 18 May 2006.
- ^ a b Private school pupil numbers in decline guardian.co.uk 9 November 2007
- ^ "Facts & Figures » SCIS". Scis.org.uk. Retrieved 15 January 2021.
- ^ MSPs vote to scrap endowment fee BBC News, 28 February 2008
- ^ "Ffigyrau addysg Gymraeg yn 'sioc'". BBC Cymru Fyw (in Welsh). 4 August 2016. Retrieved 12 June 2020.
- ^ "KS013 - Qualifications and students - Nomis - Official Census and Labour Market Statistics". www.nomisweb.co.uk. Retrieved 7 May 2023.
- ^ "KS501UK - Qualifications and students". NOMIS.
- ^ "TS067 - Highest level of qualification - Nomis - Official Census and Labour Market Statistics". www.nomisweb.co.uk. Retrieved 7 May 2023.
Bibliography[edit]
- "Census 2001". Religion in Britain. Archived from the original on 12 March 2007. Retrieved 6 September 2005.
- "Census 2001". 390,000 Jedis There Are. Retrieved 6 September 2005.
- Census 2001 website
- Abstract (1833). Abstract of the Answers and Returns made pursuant to an act passed in the eleventh year of the reign of His Majesty King George IV intituled an act for taking an account of the population of Great Britain, and the increase and diminution thereof. Population Register Abstract 1831. British Parliamentary Papers, 38.
- Arkell, T. (1992). An Examination of the Poll Taxes of the late Seventeenth Century, the Marriage Duty Act and Gregory King.
- K. Schürer, & T. Arkell (eds.), Surveying the People: the interpretation and use of document sources for the study of population in the late seventeenth century (pp. 142–177). Oxford: Leopard's Hill Press.
- Boulton, J. (1992). "The Marriage Duty Act and parochial registration in London, 1695–1706". In: K. Schürer, & T. Arkell (eds.), Surveying the People: the interpretation and use of document sources for the study of population in the late seventeenth century; pp. 222–252. Oxford: Leopard's Hill Press.
- Boulton, J. (1993). "Clandestine marriage in London: an examination of the neglected urban variable", in: Urban History; 20, pp. 191–210.
| Companies | |||||||||
|---|---|---|---|---|---|---|---|---|---|
| Currency, governance, regulation | |||||||||
| History | |||||||||
| Nations, regions, cities |
| ||||||||
| People and labour | |||||||||
| Sectors |
| ||||||||
| Trade and business organisations | |||||||||