
Hartley County, Texas
Hartley County | |
|---|---|
_Channing,_Texas.jpg) Hartley County Courthouse | |
 Location within the U.S. state of Texas | |
 Texas's location within the U.S. | |
| Coordinates: 35°50′N 102°37′W / 35.84°N 102.61°W | |
| Country | |
| State | |
| Founded | 1891 |
| Seat | Channing |
| Largest community | Hartley |
| Area | |
| • Total | 1,463 sq mi (3,790 km2) |
| • Land | 1,462 sq mi (3,790 km2) |
| • Water | 1.2 sq mi (3 km2) 0.08% |
| Population (2010) | |
| • Total | 6,062 |
| • Density | 4.1/sq mi (1.6/km2) |
| Time zone | UTC−6 (Central) |
| • Summer (DST) | UTC−5 (CDT) |
| Congressional district | 13th |
| Website | www |
Hartley County is a county located in the U.S. state of Texas. As of the 2010 census, its population was 6,062.[1] The county seat is Channing.[2] The county was created in 1876 and later organized in 1891.[3] It is named for Oliver C. Hartley and his brother, Rufus K. Hartley, two early Texas legislators and lawyers.
Geography
According to the U.S. Census Bureau, the county has a total area of 1,463 square miles (3,790 km2), of which 1,462 square miles (3,790 km2) is land and 1.2 square miles (3.1 km2) (0.08%) is water.[4]
Major highways
Adjacent counties
- Dallam County (north)
- Moore County (east)
- Oldham County (south)
- Quay County, New Mexico (southwest)
- Union County, New Mexico (northwest)
Demographics
| Census | Pop. | Note | %± |
|---|---|---|---|
| 1880 | 100 | — | |
| 1890 | 252 | 152.0% | |
| 1900 | 377 | 49.6% | |
| 1910 | 1,298 | 244.3% | |
| 1920 | 1,109 | −14.6% | |
| 1930 | 2,185 | 97.0% | |
| 1940 | 1,873 | −14.3% | |
| 1950 | 1,913 | 2.1% | |
| 1960 | 2,171 | 13.5% | |
| 1970 | 2,782 | 28.1% | |
| 1980 | 3,987 | 43.3% | |
| 1990 | 3,637 | −8.8% | |
| 2000 | 5,537 | 52.2% | |
| 2010 | 6,062 | 9.5% | |
| 2016 (est.) | 5,747 | [5] | −5.2% |
| U.S. Decennial Census[6] 1850–2010[7] 2010–2014[1] | |||
As of the census[8] of 2000, there were 5,537 people, 1,604 households, and 1,220 families residing in the county. The population density was 4 people per square mile (1/km²). There were 1,760 housing units at an average density of 1 per square mile (0/km²). The racial makeup of the county was 81.07% White, 8.15% Black or African American, 0.43% Native American, 0.27% Asian, 0.05% Pacific Islander, 8.60% from other races, and 1.43% from two or more races. 13.69% of the population were Hispanic or Latino of any race.
There were 1,604 households out of which 35.50% had children under the age of 18 living with them, 68.90% were married couples living together, 4.70% had a female householder with no husband present, and 23.90% were non-families. 21.60% of all households were made up of individuals and 11.80% had someone living alone who was 65 years of age or older. The average household size was 2.56 and the average family size was 2.98.
In the county, the population was spread out with 20.80% under the age of 18, 4.70% from 18 to 24, 35.70% from 25 to 44, 26.90% from 45 to 64, and 11.90% who were 65 years of age or older. The median age was 40 years. For every 100 females there were 154.10 males. For every 100 females age 18 and over, there were 172.90 males.
The median income for a household in the county was $46,327, and the median income for a family was $53,004. Males had a median income of $29,783 versus $21,783 for females. The per capita income for the county was $18,067. About 3.70% of families and 6.60% of the population were below the poverty line, including 8.00% of those under age 18 and 5.30% of those age 65 or over.
Government and infrastructure
| Year | Republican | Democratic | Third Parties |
|---|---|---|---|
| 2016 | 88.6% 1,730 | 8.9% 173 | 2.5% 49 |
| 2012 | 89.3% 1,708 | 9.6% 184 | 1.1% 21 |
| 2008 | 86.2% 1,711 | 12.6% 250 | 1.2% 24 |
| 2004 | 84.3% 1,736 | 15.3% 315 | 0.4% 8 |
| 2000 | 81.0% 1,645 | 17.7% 359 | 1.3% 27 |
| 1996 | 68.7% 1,242 | 25.6% 463 | 5.8% 104 |
| 1992 | 60.2% 1,081 | 22.6% 406 | 17.3% 310 |
| 1988 | 70.4% 1,229 | 28.9% 505 | 0.7% 13 |
| 1984 | 79.5% 1,419 | 19.9% 356 | 0.6% 11 |
| 1980 | 71.0% 1,248 | 26.8% 470 | 2.2% 39 |
| 1976 | 50.8% 811 | 48.5% 774 | 0.8% 12 |
| 1972 | 80.2% 946 | 17.5% 206 | 2.4% 28 |
| 1968 | 51.5% 597 | 25.8% 299 | 22.8% 264 |
| 1964 | 43.6% 437 | 56.3% 565 | 0.1% 1 |
| 1960 | 50.7% 413 | 48.7% 397 | 0.6% 5 |
| 1956 | 44.0% 353 | 55.8% 448 | 0.3% 2 |
| 1952 | 53.6% 468 | 46.0% 402 | 0.5% 4 |
| 1948 | 14.6% 83 | 84.1% 477 | 1.2% 7 |
| 1944 | 5.0% 26 | 93.1% 484 | 1.9% 10 |
| 1940 | 16.8% 110 | 83.2% 545 | |
| 1936 | 6.7% 40 | 93.3% 560 | |
| 1932 | 11.2% 74 | 88.8% 586 | |
| 1928 | 52.3% 179 | 47.7% 163 | |
| 1924 | 25.1% 61 | 64.2% 156 | 10.7% 26 |
| 1920 | 34.6% 81 | 61.5% 144 | 3.9% 9 |
| 1916 | 15.5% 30 | 83.4% 161 | 1.0% 2 |
| 1912 | 9.8% 16 | 70.7% 116 | 19.5% 32 |
The Texas Department of Criminal Justice operates the Dalhart Unit prison in an unincorporated area in the county, near Dalhart.[10]
Communities
Cities
- Channing (county seat)
- Dalhart (partly in Dallam County)
Census-designated place
Gallery
-
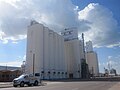 Dalhart Grain Elevator Coop in Hartley
 -
 Hartley High School in Hartley
 -
 Abandoned building in northern Hartley County


See also
- List of museums in the Texas Panhandle
- National Register of Historic Places listings in Hartley County, Texas
References
- ^ a b "State & County QuickFacts". United States Census Bureau. Retrieved December 17, 2013.
- ^ "Find a County". National Association of Counties. Retrieved 2011-06-07.
- ^ "Texas: Individual County Chronologies". Texas Atlas of Historical County Boundaries. The Newberry Library. 2008. Retrieved May 24, 2015.
- ^ "2010 Census Gazetteer Files". United States Census Bureau. August 22, 2012. Retrieved April 28, 2015.
- ^ "Population and Housing Unit Estimates". Retrieved June 9, 2017.
- ^ "U.S. Decennial Census". United States Census Bureau. Retrieved April 28, 2015.
- ^ "Texas Almanac: Population History of Counties from 1850–2010" (PDF). Texas Almanac. Retrieved April 28, 2015.
- ^ "American FactFinder". United States Census Bureau. Retrieved 2011-05-14.
- ^ http://uselectionatlas.org/RESULTS
- ^ "Dalhart Unit." Texas Department of Criminal Justice. Retrieved on June 4, 2010.
External links
- Hartley County government’s website
- Hartley County from the Handbook of Texas Online
- Hartley County Profile from the Texas Association of Counties
Places adjacent to Hartley County, Texas | ||||||||||||||||
|---|---|---|---|---|---|---|---|---|---|---|---|---|---|---|---|---|
| ||||||||||||||||
Municipalities and communities of Hartley County, Texas, United States | ||
|---|---|---|
| Cities |  | |
| CDP | ||
| Footnotes | ‡This populated place also has portions in an adjacent county or counties | |