
San Bernardino County, California
County of San Bernardino | |
|---|---|
 Seal | |
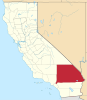
 Location in the state of California | |
 California's location in the United States | |
| Country | |
| State | |
| Region/Metro area | Inland Empire |
| Incorporated | 1853 |
| Named for | Saint Bernardino of Siena [1][2] |
| County seat | San Bernardino |
| Largest city | San Bernardino |
| Area | |
| • Total | 52,070 km2 (20,105 sq mi) |
| • Land | 51,930 km2 (20,052 sq mi) |
| • Water | 140 km2 (53 sq mi) |
| Population (2010 Census) | 2,035,210 |
| • Density | 33/km2 (85/sq mi) |
| Time zone | UTC-8 (Pacific Standard Time) |
| • Summer (DST) | UTC-7 (Pacific Daylight Time) |
| Website | www.sbcounty.gov |
San Bernardino County is a county in the U.S. state of California. As of the 2010 census, the population was 2,035,210, up from 1,709,434 as of the 2000 census. With an area of 20,105 square miles, San Bernardino County is the largest county in the contiguous United States by area, larger than any of the nine smallest states, and larger than the four smallest states combined; and larger than the closest-sized countries of Bosnia and Herzegovina or Costa Rica.[3]
Located in the southeast California, the thinly populated deserts and mountains of this vast county stretch from the outskirts of the densely populated Riverside-San Bernardino Area to the Nevada border and the Colorado River.
The county seat is San Bernardino. The county is considered part of the Inland Empire region.
History

Father Francisco Dumetz named San Bernardino on May 20, 1810, feast day of St. Bernardino of Siena.
San Bernardino County was formed from parts of Los Angeles County in 1853. Parts of the county's territory were given to Riverside County in 1893.
The Franciscans gave the name San Bernardino to the snowcapped peak in Southern California, in honor of the saint and it is from him that the county derives its name.[2]
Geography


San Bernardino County is part of the Inland Empire area of Southern California which also includes Riverside County. At just over 20,000 square miles (52,000 km2), San Bernardino County is just slightly larger than the states of Maryland, Delaware, Rhode Island, and Massachusetts combined. It is the only county in California bordered by both Nevada and Arizona, and is one of only two counties in California bordering more than one U.S. state (the other being Modoc County, bordering Nevada and Oregon in the northeast corner of the state).
The Mojave National Preserve covers some of the eastern desert, especially between Interstate 15 and Interstate 40. The desert portion also includes the cities of Needles next to the Colorado River, and Barstow at the junction in Interstate 15 and Interstate 40. Trona is at the northwestern part of the county west of Death Valley. This national park, mostly within Inyo County, also has a small portion of land within the San Bernardino County. The largest metropolitan area in the Mojave Desert part of the county is Victor Valley, with the incorporated localities of Apple Valley, Victorville, Adelanto, and Hesperia. Further south, a portion of Joshua Tree National Park overlaps the county near Twentynine Palms. Additional places near and west of Twentynine palms include Yucca Valley, Joshua Tree, and Morongo Valley.
The mountains are home to the San Bernardino National Forest, and include the communities of Crestline, Lake Arrowhead, Running Springs, Big Bear City, Forest Falls, and Big Bear Lake.
The San Bernardino Valley is at the eastern end of the San Gabriel Valley. The San Bernardino Valley includes the cities of Ontario, Chino, Chino Hills, Upland, Fontana, Rialto, Colton, Grand Terrace, Rancho Cucamonga, San Bernardino, Loma Linda, Highland, Redlands, and Yucaipa.
Incorporated communities
| San Bernardino County Cities |
Year Incorporated |
Population, 2010 |
Median Income, 2006[4] |
|---|---|---|---|
| Adelanto | 1970 | 31,765 | $41,444 |
| Apple Valley | 1988 | 69,135 | $46,751 |
| Barstow | 1947 | 22,639 | $44,737 |
| Big Bear Lake | 1981 | 5,019 | $43,983 |
| Chino | 1910 | 77,983 | $70,994 |
| Chino Hills | 1991 | 74,799 | $103,706 |
| Colton | 1887 | 52,154 | $45,911 |
| Fontana | 1952 | 196,069 | $60,722 |
| Grand Terrace | 1978 | 12,040 | $69,806 |
| Hesperia | 1988 | 90,173 | $43,018 |
| Highland | 1987 | 53,104 | $53,917 |
| Loma Linda | 1970 | 23,261 | $49,211 |
| Montclair | 1956 | 36,664 | $52,768 |
| Needles | 1913 | 4,844 | $35,338 |
| Ontario | 1891 | 163,924 | $56,688 |
| Rancho Cucamonga | 1977 | 165,269 | $75,429 |
| Redlands | 1888 | 68,747 | $63,463 |
| Rialto | 1911 | 99,171 | $45,759 |
| San Bernardino | 1854 | 209,924 | $36,676 |
| Twentynine Palms | 1987 | 25,048 | $36,471 |
| Upland | 1906 | 73,732 | $64,894 |
| Victorville | 1962 | 115,903 | $50,531 |
| Yucaipa | 1989 | 51,367 | $50,529 |
| Yucca Valley | 1991 | 20,700 | $38,092 |
Unincorporated communities
Adjacent counties

National protected areas
- Angeles National Forest (part)
- Death Valley National Park (part)
- Havasu National Wildlife Refuge (part)
- Joshua Tree National Park (part)
- Mojave National Preserve
- San Bernardino National Forest (part)
Demographics
| Census | Pop. | Note | %± |
|---|---|---|---|
| 1900 | 27,929 | — | |
| 1910 | 56,706 | 103.0% | |
| 1920 | 73,401 | 29.4% | |
| 1930 | 133,900 | 82.4% | |
| 1940 | 161,108 | 20.3% | |
| 1950 | 281,642 | 74.8% | |
| 1960 | 503,591 | 78.8% | |
| 1970 | 684,072 | 35.8% | |
| 1980 | 895,016 | 30.8% | |
| 1990 | 1,418,380 | 58.5% | |
| 2000 | 1,709,434 | 20.5% | |
| 2010 | 2,035,210 | 19.1% |
2010
The 2010 United States Census reported that San Bernardino County had a population of 2,035,210. The racial makeup of San Bernardino County was 1,153,161 White, 181,862 African American, 22,689 Native American, 128,603 Asian, 6,870 Pacific Islander, 439,661 from other races, and 102,364 from two or more races. Hispanic or Latino of any race were 1,001,145 persons.[5]
| Population reported at 2010 United States Census | |||||||||
|---|---|---|---|---|---|---|---|---|---|
Population |
American |
American |
Islander |
races |
more races |
or Latino (of any race) | |||
| San Bernardino County | 2,035,210 | 1,153,161 | 181,862 | 22,689 | 128,603 | 6,870 | 439,661 | 102,364 | 1,001,145 |
cities and towns |
Population |
American |
American |
Islander |
races |
more races |
or Latino (of any race) | ||
| Adelanto | 31,765 | 13,909 | 6,511 | 411 | 617 | 194 | 8,337 | 1,786 | 18,513 |
| Apple Valley | 69,135 | 47,762 | 6,321 | 779 | 2,020 | 294 | 8,345 | 3,614 | 20,156 |
| Barstow | 22,639 | 11,840 | 3,313 | 477 | 723 | 278 | 4,242 | 1,766 | 9,700 |
| Big Bear Lake | 5,019 | 4,204 | 22 | 48 | 78 | 10 | 491 | 166 | 1,076 |
| Chino | 77,983 | 43,981 | 4,829 | 786 | 8,159 | 168 | 16,503 | 3,557 | 41,993 |
| Chino Hills | 74,799 | 38,035 | 3,415 | 379 | 22,676 | 115 | 6,520 | 3,659 | 21,802 |
| Colton | 52,154 | 22,613 | 5,055 | 661 | 2,590 | 176 | 18,413 | 2,646 | 37,039 |
| Fontana | 196,069 | 92,978 | 19,574 | 1,957 | 12,948 | 547 | 58,449 | 9,616 | 130,957 |
| Grand Terrace | 12,040 | 7,912 | 673 | 120 | 778 | 32 | 1,898 | 627 | 4,708 |
| Hesperia | 90,173 | 55,129 | 5,226 | 1,118 | 1,884 | 270 | 22,115 | 4,431 | 44,091 |
| Highland | 53,104 | 27,836 | 5,887 | 542 | 3,954 | 168 | 11,826 | 2,891 | 25,556 |
| Loma Linda | 23,261 | 11,122 | 2,032 | 97 | 6,589 | 154 | 2,022 | 1,245 | 5,171 |
| Montclair | 36,664 | 19,337 | 1,908 | 434 | 3,425 | 74 | 9,882 | 1,604 | 25,744 |
| Needles | 4,844 | 3,669 | 95 | 399 | 35 | 9 | 323 | 314 | 1,083 |
| Ontario | 163,924 | 83,683 | 10,561 | 1,686 | 8,453 | 514 | 51,373 | 7,654 | 113,085 |
| Rancho Cucamonga | 165,269 | 102,401 | 15,246 | 1,134 | 17,208 | 443 | 19,878 | 8,959 | 57,688 |
| Redlands | 68,747 | 47,452 | 3,564 | 625 | 5,216 | 235 | 8,266 | 3,389 | 20,810 |
| Rialto | 99,171 | 43,592 | 16,236 | 1,062 | 2,258 | 361 | 30,993 | 4,669 | 67,038 |
| San Bernardino | 209,924 | 95,734 | 31,582 | 2,822 | 8,454 | 839 | 59,827 | 10,666 | 125,994 |
| Twentynine Palms | 25,048 | 17,938 | 2,063 | 329 | 979 | 345 | 1,678 | 1,716 | 5,212 |
| Upland | 73,732 | 48,364 | 5,400 | 522 | 6,217 | 159 | 9,509 | 3,561 | 28,035 |
| Victorville | 115,903 | 56,258 | 19,483 | 1,665 | 4,641 | 489 | 26,036 | 7,331 | 55,359 |
| Yucaipa | 51,367 | 40,824 | 837 | 485 | 1,431 | 74 | 5,589 | 2,127 | 13,943 |
| Yucca Valley | 20,700 | 17,280 | 666 | 232 | 469 | 44 | 1,185 | 824 | 3,679 |
places |
Population |
American |
American |
Islander |
races |
more races |
or Latino (of any race) | ||
| Baker | 735 | 302 | 1 | 5 | 10 | 14 | 380 | 23 | 502 |
| Big Bear City | 12,304 | 10,252 | 83 | 202 | 103 | 31 | 1,089 | 544 | 2,323 |
| Big River | 1,327 | 1,137 | 14 | 50 | 2 | 0 | 54 | 70 | 160 |
| Bloomington | 23,851 | 12,988 | 649 | 309 | 330 | 47 | 8,600 | 928 | 19,326 |
| Bluewater | 172 | 156 | 2 | 1 | 0 | 1 | 9 | 3 | 11 |
| Crestline | 10,770 | 9,289 | 107 | 135 | 96 | 20 | 526 | 597 | 1,775 |
| Fort Irwin | 8,845 | 5,481 | 1,086 | 103 | 402 | 120 | 916 | 737 | 2,261 |
| Homestead Valley | 3,032 | 2,594 | 34 | 58 | 30 | 9 | 196 | 111 | 517 |
| Joshua Tree | 7,414 | 6,176 | 234 | 84 | 104 | 18 | 368 | 430 | 1,308 |
| Lake Arrowhead | 12,424 | 10,729 | 95 | 93 | 152 | 33 | 847 | 475 | 2,709 |
| Lenwood | 3,543 | 2,133 | 219 | 94 | 37 | 25 | 813 | 222 | 1,675 |
| Lucerne Valley | 5,811 | 4,507 | 170 | 106 | 90 | 0 | 676 | 262 | 1,447 |
| Lytle Creek | 701 | 606 | 6 | 7 | 23 | 0 | 25 | 34 | 98 |
| Mentone | 8,720 | 6,114 | 438 | 122 | 352 | 32 | 1,234 | 428 | 3,085 |
| Morongo Valley | 3,552 | 3,076 | 40 | 73 | 31 | 4 | 187 | 141 | 531 |
| Mountain View Acres | 3,130 | 1,748 | 215 | 48 | 98 | 17 | 861 | 143 | 1,647 |
| Muscoy | 10,644 | 4,459 | 454 | 125 | 101 | 16 | 4,992 | 497 | 8,824 |
| Oak Glen | 638 | 545 | 50 | 13 | 2 | 1 | 14 | 13 | 123 |
| Oak Hills | 8,879 | 6,796 | 266 | 100 | 226 | 28 | 1,166 | 297 | 2,719 |
| Phelan | 14,304 | 10,807 | 276 | 139 | 446 | 20 | 1,993 | 623 | 4,128 |
| Piñon Hills | 7,272 | 5,966 | 58 | 65 | 189 | 4 | 659 | 331 | 1,738 |
| Running Springs | 4,862 | 4,325 | 23 | 47 | 50 | 6 | 146 | 265 | 695 |
| San Antonio Heights | 3,371 | 2,765 | 67 | 24 | 284 | 15 | 115 | 101 | 612 |
| Searles Valley | 1,739 | 1,405 | 69 | 56 | 16 | 6 | 83 | 104 | 293 |
| Silver Lakes | 5,623 | 4,566 | 315 | 39 | 198 | 15 | 270 | 220 | 907 |
| Spring Valley Lake | 8,220 | 6,450 | 403 | 55 | 381 | 23 | 481 | 427 | 1,528 |
| Wrightwood | 4,525 | 4,126 | 38 | 28 | 51 | 7 | 112 | 163 | 538 |
communities |
Population |
American |
American |
Islander |
races |
more races |
or Latino (of any race) | ||
| All others not CDPs (combined) | 115,368 | 69,810 | 5,951 | 1,738 | 2,997 | 366 | 29,149 | 5,357 | 61,233 |
2000
As of the censusTemplate:GR of 2000, there were 1,709,434 people, 528,594 households, and 404,374 families residing in the county. The population density was 85 people per square mile (33/km²). There were 601,369 housing units at an average density of 30 per square mile (12/km²). The racial makeup of the county was 58.9% White, 9.1% African American, 1.2% Native American, 4.7% Asian, 0.3% Pacific Islander, 20.8% from other races, and 5.0% from two or more races. 39.2% of the population were Hispanic or Latino of any race. 8.3% were of German, 5.5% English and 5.1% Irish ancestry according to Census 2000. 66.1% spoke English, 27.7% Spanish and 1.1% Tagalog as their first language.
There were 528,594 households out of which 43.7% had children under the age of 18 living with them, 55.8% were married couples living together, 14.8% had a female householder with no husband present, and 23.5% were non-families. 18.4% of all households were made up of individuals and 6.6% had someone living alone who was 65 years of age or older. The average household size was 3.2 and the average family size was 3.6.
The number of homeless in San Bernardino County grew from 5,270 in 2002 to 7,331 in 2007, a 39% increase.[6]
In the county the population was spread out with 32.3% under the age of 18, 10.3% from 18 to 24, 30.2% from 25 to 44, 18.7% from 45 to 64, and 8.6% who were 65 years of age or older. The median age was 30 years. For every 100 females there were 99.6 males. For every 100 females age 18 and over, there were 97.20 males.
The median income for a household in the county was $42,066, and the median income for a family was $46,574. Males had a median income of $37,025 versus $27,993 for females. The per capita income for the county was $16,856. About 12.6% of families and 15.80% of the population were below the poverty line, including 20.6% of those under age 18 and 8.4% of those age 65 or over.
Transportation infrastructure
Major highways
|
Public transportation
- Barstow Area Transit serves Barstow and the surrounding county area.
- Morongo Basin Transit Authority provides bus service in Yucca Valley, Joshua Tree and Twentynine Palms (including the Marine base). Limited service is also provided to Palm Springs.
- Mountain Area Regional Transit Authority (MARTA) covers the Lake Arrowhead and Big Bear regions. Limited service is also provided to Downtown San Bernardino.
- Needles Area Transit serves Needles and the surrounding county area.
- Omnitrans provides transit service in the urbanized portion of San Bernardino County, serving the City of San Bernardino, as well as the area between Montclair and Yucaipa.
- Victor Valley Transit Authority operates buses in Victorville, Hesperia, Adelanto, Apple Valley and the surrounding county area.
- Foothill Transit connects the Inland Empire area to the San Gabriel Valley and downtown Los Angeles.
- OCTA connects Chino to Irvine and Brea.
- RTA connects Montclair to Riverside County.
- San Bernardino County is also served by Greyhound buses and Amtrak trains. Metrolink commuter trains connect the urbanized portion of the county with Los Angeles, Orange, and Riverside Counties.
Airports
- Commercial passenger flights are available at L.A./Ontario International Airport.
- San Bernardino International Airport is being remodeled and is expected to serve the region as an international airport. The airport will have access through interstate I-215 and I-10 through Mill Street. Terminal construction was recently finished, and commercial flights are planned awaiting carriers to select SBD as a destination city.
- Southern California Logistics Airport (Victorville) is a major cargo and general aviation airport.
- The County of San Bernardino owns six general aviation airports: Apple Valley Airport, Baker Airport, Barstow-Daggett Airport, Chino Airport, Needles Airport, and Twentynine Palms Airport.
- Other general aviation airports in the county include: Big Bear City Airport, Cable Airport (Upland), Hesperia Airport (not listed in NPIAS),[7] and Redlands Municipal Airport
Education
Colleges and universities
- Barstow Community College
- Brandman University, Ontario Campus
- California State University, San Bernardino
- Chaffey College
- Crafton Hills College
- Loma Linda University
- National University, Ontario Campus
- National University, San Bernardino Campus
- Palo Verde Community College-Needles Campus
- Pioneer University, Oro Grande
- San Bernardino Valley College
- University of La Verne
- University of Redlands
- Victor Valley College
Libraries
San Bernardino County is home to the San Bernardino County Library system, which consists of 34 branches within the county and branches in Victorville, Riverside County, Murrieta, Moreno Valley, and College of the Desert.[8] Branch libraries offer services such as free internet access, live 24/7 reference services, vital records, LITE (Literacy, Information, Technology, and Education) Centers for children, and literacy programs.[9]
City-sponsored public libraries also exist in San Bernardino County, including A. K. Smiley Public Library in Redlands, California, which was built in 1898.[10] Other public libraries in the County include: San Bernardino City Public Library, Rancho Cucamonga Public Library, Upland Public Library, Montclair Public Library, Colton City Library, Apple Valley Public Library, and the Ontario City Library.[11]
Government
This section needs expansion. You can help by adding to it. (March 2011) |
The San Bernardino County Board of Supervisors has 5 members elected from their districts.
Politics
| Year | GOP | DEM | Others |
|---|---|---|---|
| 2008 | 45.8% 277,408 | 52.1% 315,720 | 2.2% 13,206 |
| 2004 | 55.3% 289,306 | 43.6% 227,789 | 1.1% 5,682 |
| 2000 | 48.8% 221,757 | 47.2% 214,749 | 4.0% 18,387 |
| 1996 | 43.6% 180,135 | 44.4% 183,372 | 12.1% 49,848 |
| 1992 | 37.2% 176,563 | 38.7% 183,634 | 24.0% 113,873 |
| 1988 | 60.0% 235,167 | 38.6% 151,118 | 1.5% 5,723 |
| 1984 | 64.8% 222,071 | 34.0% 116,454 | 1.2% 4,180 |
| 1980 | 59.7% 172,957 | 31.7% 91,790 | 8.7% 25,065 |
| 1976 | 49.5% 113,265 | 47.9% 109,636 | 2.6% 5,984 |
| 1972 | 59.7% 144,689 | 35.5% 85,986 | 4.8% 11,581 |
| 1968 | 50.1% 111,974 | 40.0% 89,418 | 9.9% 22,224 |
| 1964 | 42.8% 92,145 | 57.1% 123,012 | 0.1% 243 |
| 1960 | 52.0% 99,481 | 47.5% 90,888 | 0.5% 944 |
| 1956 | 56.9% 86,263 | 42.8% 64,946 | 0.3% 443 |
| 1952 | 57.3% 77,718 | 41.8% 56,663 | 0.9% 1,153 |
| 1948 | 48.6% 46,570 | 47.7% 45,691 | 3.8% 3,577 |
| 1944 | 46.5% 34,084 | 52.6% 38,530 | 0.9% 646 |
| 1940 | 44.3% 30,511 | 54.5% 37,520 | 1.2% 847 |
| 1936 | 39.0% 22,219 | 59.5% 33,955 | 1.5% 842 |
| 1932 | 44.6% 22,094 | 50.2% 24,889 | 5.2% 2,565 |
| 1928 | 74.7% 29,229 | 24.1% 9,436 | 1.1% 447 |
| 1924 | 56.9% 15,974 | 9.4% 2,634 | 33.7% 9,453 |
| 1920 | 62.8% 12,518 | 28.2% 5,620 | 9.0% 1,783 |
San Bernardino County is a politically competitive county, in which candidates from both major political parties have won in recent elections. The Democratic Party carried the county in 2008, with Barack Obama winning a majority of its votes, and in 1992 and 1996, when Bill Clinton won pluralities. Republican George W. Bush took the county in 2000 by a plurality and in 2004. The county is split between heavily Latino, middle-class, and Democratic areas and more wealthy conservative areas. The heavily Latino cities of Ontario and San Bernardino went for John Kerry in 2004, but with a relatively low voter turnout. In 2006, San Bernardino's population exceeded 201,000, and in 2004, only 42,520 votes were cast in the city; in 2006, strongly Republican Rancho Cucamonga had over 145,000 residents, of whom 53,054 voted.
In the House of Representatives, all of California's 43rd congressional district and parts of the 25th, 26th, 41st, and 42nd districts are in the county. Except for the 43rd, which is held by Democrat Joe Baca, every district is held by Republicans: Buck McKeon, David Dreier, Jerry Lewis, and Gary Miller respectively.
In the State Assembly, tiny parts of the 32nd and 34th districts, parts of the 36th, 59th, 60th, 61st, 63rd, and 65th districts, and all of the 62nd district are in the county. Except for the 61st and 62nd districts, which are represented by Democrats Norma Torres and Wilmer Carter respectively, every district is represented by a Republican: Shannon Grove (AD-32), Minority Leader Connie Conway (AD-34), Steve Knight (AD-36), Tim Donnelly (AD-59), Curt Hagman (AD-60), Mike Morrell (AD-63), and Paul Cook (AD-65).
In the State Senate, parts of the 17th, 18th, 29th, 31st, and 32nd districts are in the county, and are held by Republicans Sharon Runner, Jean Fuller, Bob Huff, and Minority Leader Bob Dutton, and Democrat Gloria Negrete McLeod respectively.
On Nov. 4, 2008 San Bernardino County voted 67% for Proposition 8, which amended the California Constitution to ban same-sex marriages.
According to the California Secretary of State, as of May, 2009, there were 806,589 registered voters in San Bernardino County. Of those, 324,857 (40.28%) were registered Democrats, 306,203 (37.96%) were registered Republicans, with the remainder belonging to minor political parties or declining to state.[12]
Public safety
Law enforcement

The county's primary law enforcement agency is the San Bernardino County Sheriff's Department. The department provides law enforcement services in the unincorporated areas of the county and in 14 contract cities, operates the county jail system, provides marshal services in the county superior courts, and has numerous other divisions to serve the residents of the county.
Sergeant Phil Brown of the San Bernardino County Sheriff's Department said the gangs are growing more violent in the farthest reaches of the county, including the High Desert. Racial tensions among the Chicano gangs and the African-American gangs have heightened dramatically in the Inland Empire, causing even the most rural areas to be affected. "It's getting out in more remote areas," Brown said. "They go gang against gang. There's more gang violence to the general public and its becoming more random..."[13]
Crime statistics
Crime in 2005 (reported by the sheriff's office)[14]
Column-generating template families
The templates listed here are not interchangeable. For example, using {{col-float}} with {{col-end}} instead of {{col-float-end}} would leave a <div>...</div> open, potentially harming any subsequent formatting.
| Type | Family | Handles wiki
table code?† |
Responsive/ mobile suited |
Start template | Column divider | End template |
|---|---|---|---|---|---|---|
| Float | "col-float" | Yes | Yes | {{col-float}} | {{col-float-break}} | {{col-float-end}} |
| "columns-start" | Yes | Yes | {{columns-start}} | {{column}} | {{columns-end}} | |
| Columns | "div col" | Yes | Yes | {{div col}} | – | {{div col end}} |
| "columns-list" | No | Yes | {{columns-list}} (wraps div col) | – | – | |
| Flexbox | "flex columns" | No | Yes | {{flex columns}} | – | – |
| Table | "col" | Yes | No | {{col-begin}}, {{col-begin-fixed}} or {{col-begin-small}} |
{{col-break}} or {{col-2}} .. {{col-5}} |
{{col-end}} |
† Can template handle the basic wiki markup {| | || |- |} used to create tables? If not, special templates that produce these elements (such as {{(!}}, {{!}}, {{!!}}, {{!-}}, {{!)}})—or HTML tags (<table>...</table>, <tr>...</tr>, etc.)—need to be used instead.
Fire rescue
The county operates the San Bernardino County Consolidated Fire District (commonly known as the San Bernardino County Fire Department). The department provides "all-risk" fire, rescue, and emergency medical services to all unincorporated areas, except for several areas served by independent fire protection districts, within the county as well as several cities which have chosen to contract with the department.
Environmental quality
California Attorney General Jerry Brown sued the county in April 2007 under the state's environmental quality act for failing to account for the impact of global warming in the county's 25-year growth plan, approved in March. The Center for Biological Diversity, the Sierra Club and the Audubon Society also sued in a separate case. According to Brendan Cummings, a senior attorney for the plaintiffs: "San Bernardino has never seen a project it didn't like. They rubber-stamp development. It's very much of a frontier mentality." The plaintiffs want the county to rewrite its growth plan's environmental impact statement to include methods to measure greenhouse gases and take steps to reduce them.[15]
According to county spokesman David Wert, only 15% of the county is actually controlled by the county; the rest is cities and federal and state land. However, the county says it will make sure employment centers and housing are near transportation corridors to reduce traffic and do more to promote compact development and mass transit. The county budgeted $325,000 to fight the lawsuit.[15]
The state and the county reached a settlement in August 2007.[16] The county agreed to amend its general plan to include a Greenhouse Gas Emissions Reduction Plan, including an emissions inventory and reduction targets.
Places of interest
- The Mojave National Preserve
- Calico Ghost Town — northeast of Barstow via Interstate 15
- Zzyzx — a small desert settlement that used to be a health spa and is now the Desert Studies Center
- Joshua Tree National Park
- San Bernardino National Forest — home to Big Bear Lake outdoor activities
- Goldstone Deep Space Communications Complex
- Snow Summit and Bear Mountain (Ski Area) are home to Southern California's premier winter ski resorts. Mountain High, although technically located in Los Angeles County, is also an alternative to Snow Summit and Bear Mountain because of its proximity to San Bernardino County.
Notable people
Including current residents, as well as former residents who have made their mark in history:
- Jon Foreman, singer-song writer, and member of the band, Switchfoot.
- Earl W. Bascom, inventor, rodeo champion, California Rodeo Hall of Fame inductee, actor, artist/sculptor, "Father of Modern-day Rodeo." Lived in Ontario and the Victor Valley.
- Glen Bell, founder of Taco Bell
- Susan Easton Black, author
- Frank Bogert, raised in Wrightwood, rodeo announcer, mayor of Palm Springs 1958–1966.
- Ron Carter, author
- Ronnie Lott, Hall of Fame football player, grew up in Rialto.
- Landon Donovan, professional soccer player for the U.S. National Team and the Major League Soccer Los Angeles Galaxy.
- James Earp, one of the "Fighting Earps" of Dodge City, and Tombstone fame. Buried in Mountain View Cemetery, San Bernardino
- Morgan Earp, US Marshal killed in Tombstone, Arizona, and buried in Hermosa Gardens Cemetery, Colton, California, one of the "Fighting Earps" of Tombstone fame.
- Nicholas Porter Earp, Justice of the Peace, coroner, judge, preacher, saloon owner, gambler, father of the "Fighting Earps".
- Virgil Earp, one of the "Fighting Earps" of Dodge City, and Tombstone fame. US Marshal, Arizona Territory. Lived in Colton, California.
- Wyatt Earp, one of the "Fighting Earps" of Dodge City, and Tombstone fame. Lived in San Timoteo Canyon, Colton and Vidal. The town of Earp, California is named in his honor, as he owned a gold mine in the nearby Whipple Mountains.
- Tennessee Ernie Ford, radio announcer, country and gospel music singer, television show host. Lived in Victorville, Oro Grande and San Bernardino.
- Cuba Gooding, Jr., Academy Award–winning actor. Lived in Apple Valley.
- Gene Hackman, Hollywood actor and Academy Award winner. He was born in San Bernardino.
- Jefferson Hunt, U.S. Army - Mormon Battalion officer, western pioneer, State Legislator, "Father of San Bernardino County", Brigadier General of California Militia.
- Will James, artist, illustrator, author. Lived in Apple Valley.
- Eric Koston, professional skateboarder - born in Bangkok, Thailand but grew up in San Bernardino, California
- Eddie Lawson, four-time world champion Grand Prix motorcycle racer.
- John Walker Lindh, the so-called "American Taliban" fighter now incarcerated in ADX Florence.
- Amasa Lyman, first mayor of San Bernardino City, Mormon Apostle
- Biddy Mason, former slave, a nurse and midwife who became the wealthiest woman in California in her day, helped found the AME Church. She lived in San Bernardino, coming there with the Mormon colonists.
- Dick and Mac McDonald, the fast food pioneering brothers of what became McDonald's Corporation
- Melina Perez, professional wrestler
- Jim Pike, singer with The Lettermen, Reunion
- Tim Powers, fantasy author
- Roy Rogers and Dale Evans, western actors, rodeo producer. Lived in Apple Valley.
- Spike (Peanuts), the fictional canine resident from the Needles area
- Randy Rhoads, guitar prodigy who played with Ozzy Osbourne's Blizzard of Oz, is laid to rest in Mountain View Cemetery
- Bobby Sherman, actor
- Charles C. Rich, one of the founders of San Bernardino, Mormon Apostle.
- Cleon Skousen, FBI agent, Chief of Police, lawyer, author, world lecturer. Lived in San Bernardino.
- Joseph F. Smith, religious leader, became the sixth President of the Church of Jesus Christ of Latter-day Saints (Mormon). Lived and worked in Mormon Springs (now Crestline) in the 1850s.
- John Charles Thomas, baritone opera singer on Broadway. Lived in Apple Valley.
- Three Bars, stud thoroughbred horse, Hall of Fame foundation sire of American Quarter Horse. Lived in Apple Valley.
- Darren Collison, NBA rookie drafted by the New Orleans Hornets grew up in Rancho Cucamonga, attended Etiwanda High School and received a scholarship to play at UCLA.
- New Boyz, Rap Duo
See also
- List of California counties
- List of California public officials charged with crimes, San Bernardino County
- List of school districts in San Bernardino County, California
- National Register of Historic Places listings in San Bernardino County, California
References
- ^ "San Bernardino, California Tourism". PlanetWare. Retrieved 2009-09-16.
- ^ a b Van de Grift Sanchez, Nellie (1914). Spanish and Indian place names of California: their meaning and their romance. p. 74. Retrieved 2009-09-17.
- ^ Wikipedia: List of countries and outlying territories by total area
- ^ Husing, John (2007). "Inland Empire City Profile 2007" (PDF). Inland Empire Quarterly Economic Report. 19 (4). Redlands: Economics & Politics, Inc. Retrieved 2007-12-01.
{{cite journal}}: Unknown parameter|month=ignored (help) - ^ "2010 Census P.L. 94-171 Summary File Data". United States Census Bureau.
- ^ Quan, Douglas (2007-09-25). "S.B. County steps up fight against homelessness". Press Enterprise. Retrieved 2007-12-24.
- ^ Site L26 List of airports in California
- ^ San Bernardino County Library catalog
- ^ San Bernardino County Library website
- ^ A.K. Smiley Public Library history
- ^ Public libraries in San Bernardino County, CA
- ^ "Report of Registration as of May 4, 2009 - Registration By County" (PDF). sos.ca.gov. Retrieved 30 November 2010.
- ^ Barrett, Beth (September 26, 2004). "Homegrown Terror". lang.sbsun.com. Retrieved 30 November 2010.
- ^ "Reported by the sheriff's office". City data County San Bernardino County, CA. Retrieved 2010-10-29.
- ^ a b Ritter, John (June 5, 2007). "Inland Empire's 25-year growth targeted". USA Today. Retrieved 2007-11-10.
- ^ Office of the Attorney General, State of California, Brown Announces Landmark Global Warming Settlement, August 21, 2007.
External links
- San Bernardino County website
- San Bernardino County Museum website
- San Bernardino County Library website
34°50′N 116°11′W / 34.83°N 116.19°W

State of California | |
|---|---|
Sacramento (capital) | |
| Topics | |
| Regions |
|
| Metro regions | |
| Counties |
|
| Most populous cities | |