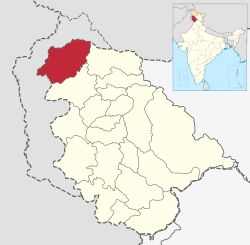
Kupwara district
This article needs additional citations for verification. (May 2017) |
Kupwara district | |
|---|---|
 Location of Kupwara district in Jammu and Kashmir | |
| Coordinates (Kupwara): 34°31′12″N 74°15′00″E / 34.52000°N 74.25000°E | |
| Country | India |
| Union territory | Jammu and Kashmir |
| Division | Kashmir Division |
| Headquarters | Kupwara |
| Government | |
| • Vidhan Sabha constituencies | 5 : Karnah, Kupwara, Lolab, Handwara and Langate |
| Population (2011) | |
| • Total | 870,354 |
| Demographics | |
| • Literacy | 75.60% |
| Time zone | UTC+05:30 (IST) |
| Vehicle registration | JK-09 |
| Website | http://kupwara.gov.in/ |
Kupwara District is one of 10 districts located in Kashmir region of Jammu and Kashmir, India. The river Kishenganga, originating from the Himalayas, flows through the outer areas of the district from east to west.[1]
Economy
Most of the people depend on agriculture and horticulture. There is a good production and business of walnuts in Kupwara.[2]
Department of horticulture have developed high density walnut nursery in Kupwara[3]
Demographics
Demographics
Kupwara district: mother-tongue of population, according to the 2011 Census.[5]
According to the 2011 census Kupwara district has a population of 870,354.[citation needed] This gives it a ranking of 470th in India (out of a total of 640). The district has a population density of 368 inhabitants per square kilometre (950/sq mi). Its population growth rate over the decade 2001–2011 was 34.62%. Kupwara has a sex ratio of 843 females for every 1000 males (this varies with religion), and a literacy rate of 75.60%.[citation needed]
| Kupwara district: religion, gender ratio, and % urban of population, according to the 2011 Census.[4] | |||||||||
|---|---|---|---|---|---|---|---|---|---|
| Hindu | Muslim | Christian | Sikh | Buddhist | Jain | Other | Not stated | Total | |
| Total | 37,128 | 823,286 | 1,700 | 5,600 | 66 | 39 | 13 | 2,522 | 870,354 |
| 4.27% | 94.59% | 0.20% | 0.64% | 0.01% | 0.00% | 0.00% | 0.29% | 100.00% | |
| Male | 36,057 | 430,521 | 1,215 | 4,821 | 51 | 28 | 9 | 1,488 | 474,190 |
| Female | 1,071 | 392,765 | 485 | 779 | 15 | 11 | 4 | 1,034 | 396,164 |
| Gender ratio (% female) | 2.9% | 47.7% | 28.5% | 13.9% | 22.7% | 28.2% | 30.8% | 41.0% | 45.5% |
| Sex ratio (no. of females per 1,000 males) |
30 | 912 | 399 | 162 | – | – | – | 695 | 835 |
| Urban | 9,460 | 93,355 | 369 | 1,123 | 20 | 6 | 8 | 388 | 104,729 |
| Rural | 27,668 | 729,931 | 1,331 | 4,477 | 46 | 33 | 5 | 2,134 | 765,625 |
| % Urban | 25.5% | 11.3% | 21.7% | 20.1% | 30.3% | 15.4% | 61.5% | 15.4% | 12.0% |
Kupwara district
| |||
|---|---|---|---|
| Mother tongue code | Mother tongue | People | Percentage |
| 001002 | Assamese | 618 | 0.07% |
| 002007 | Bengali | 1,750 | 0.20% |
| 004001 | Dogri | 976 | 0.11% |
| 005018 | Gujarati | 529 | 0.06% |
| 006102 | Bhojpuri | 193 | 0.02% |
| 006195 | Garhwali | 47 | 0.01% |
| 006207 | Gojri/Gujjari/Gujar | 80,163 | 9.21% |
| 006235 | Haryanvi | 83 | 0.01% |
| 006240 | Hindi | 23,640 | 2.72% |
| 006340 | Kumauni | 455 | 0.05% |
| 006439 | Pahari | 122,927 | 14.12% |
| 006489 | Rajasthani | 199 | 0.02% |
| 006503 | Sadan/Sadri | 47 | 0.01% |
| 007016 | Kannada | 748 | 0.09% |
| 008005 | Kashmiri | 618,887 | 71.11% |
| 008019 | Dardi | 661 | 0.08% |
| 011016 | Malayalam | 850 | 0.10% |
| 012003 | Manipuri | 81 | 0.01% |
| 013071 | Marathi | 2,479 | 0.28% |
| 014011 | Nepali | 1,141 | 0.13% |
| 015043 | Odia | 771 | 0.09% |
| 016038 | Punjabi | 5,887 | 0.68% |
| 020027 | Tamil | 1,464 | 0.17% |
| 021046 | Telugu | 1,221 | 0.14% |
| 022015 | Urdu | 976 | 0.11% |
| 024001 | Afghani/Kabuli/Pashto | 1,691 | 0.19% |
| 053005 | Gujari | 1,110 | 0.13% |
| – | Others | 760 | 0.09% |
| Total | 870,354 | 100.00% | |
References
- ^ "Statement showing the number of blocks in respect of 22 Districts of Jammu and Kashmir State including newly Created Districts, as on 31-03-2008" (PDF). Archived from the original (PDF) on 10 September 2008. Retrieved 29 August 2008. dated 2008-03-13, accessed 2008-08-30
- ^ Ministry of Panchayati Raj (8 September 2009). "A Note on the Backward Regions Grant Fund Programme" (PDF). National Institute of Rural Development. Archived from the original (PDF) on 5 April 2012. Retrieved 27 September 2011.
- ^ "Horticulture deptt to develop high density walnut nursery in Kupwara". Greater Kashmir. 20 April 2019. Retrieved 16 April 2020.
- ^ a b C-1 Population By Religious Community – Jammu & Kashmir (Report). Office of the Registrar General & Census Commissioner, India. Retrieved 28 July 2020.
- ^ a b C-16 Population By Mother Tongue – Jammu & Kashmir (Report). Office of the Registrar General & Census Commissioner, India. Retrieved 18 July 2020.
