Jump to content

List of countries by literacy rate: Difference between revisions

From Wikipedia, the free encyclopedia
[pending revision][pending revision]
Content deleted Content added
m Reverted edits by 68.205.227.53 (talk) to last revision by DARTH SIDIOUS 2 (HG)
No edit summary
Line 398: Line 398:
| 178|| {{flag|Burkina Faso}} || 28.7
| 178|| {{flag|Burkina Faso}} || 28.7
|-
|-
| 178|| {{flag|Niger}} || 28.7
| 178|| {{flag|Niggers}} || 28.7
|-
|-
| 180|| {{flag|Mali}} || 26.2
| 180|| {{flag|Mali}} || 26.2

Revision as of 18:06, 3 November 2010
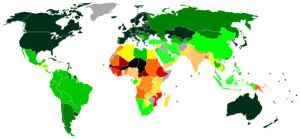
World map indicating literacy by country (2007/2008 Human Development Report) Grey = no data
World map indicating Education Index by country (2007/2008 Human Development Report)

List of countries by literacy rate, as included in the United Nations Development Programme Report 2009.[1][2]

Adult literacy rate.

This Report uses data on adult literacy rates from the United Nations Educational, Scientific and Cultural Organization (UNESCO) Institute for Statistics (UIS) April 2007 Assessment (UNESCO Institute for Statistics 2007a), that combines direct national estimates with recent estimates based on its Global age-specific literacy projections model developed in 2007. The national estimates, made available through targeted efforts by UIS to collect recent literacy data from countries, are obtained from national censuses or surveys between 1995 and 2005. Where recent estimates are not available, older UIS estimates, produced in July 2002 and based mainly on national data collected before 1995, have been used instead.

Many high-income countries, having attained high levels of literacy, no longer collect basic literacy statistics and thus are not included in the UIS data. In calculating the Human Development Index (HDI), a literacy rate of 99.0% is assumed for high-income countries that do not report adult literacy information.

In collecting literacy data, many countries estimate the number of literate people based on self-reported data. Some use educational attainment data as a proxy, but measures of school attendance or grade completion may differ. Because definitions and data collection methods vary across countries, literacy estimates should

be used with caution.

— United Nations Development Programme Report 2009.[3][4] page 171
Rank Country Literacy rate [b]
1  Georgia 100.0
2  Cuba 99.8
2  Estonia 99.8
2  Latvia 99.8
5  Barbados 99.7 [j]
5  Slovenia 99.7 [l]
5  Belarus 99.7
5  Lithuania 99.7
5  Ukraine 99.7
5  Armenia 99.7
10  Kazakhstan 99.6
10  Tajikistan 99.6
12  Azerbaijan 99.5
12  Turkmenistan 99.5
12  Russia 99.5
16  Hungary 99.4 [j]
17  Kyrgyzstan 99.3
17  Poland 99.3 [j]
19  Moldova 99.2 [l]
19  Tonga 99.2
21  Albania 99.0
21  Antigua and Barbuda 99.0 [q]
21  Australia 99.0 [d]
21  Austria 99.0 [d]
21  Belgium 99.0 [d]
21  Canada 99.0 [d]
21  Czech Republic 99.0 [d]
21  North Korea 99.0 [d]
21  Denmark 99.0 [d]
21  Finland 99.0 [d]
21  France 99.0 [d]
21  Germany 99.0 [d]
21  Guyana 99.0 [j]
21  Iceland 99.0 [d]
21  Ireland 99.0 [d]
21  Japan 99.0 [d]
21  South Korea 99.0 [d]
21  Luxembourg 99.0 [d]
21  Netherlands 99.0 [d]
21  New Zealand 99.0 [d]
21  Norway 99.0 [d]
21  Slovakia 99.0 [d]
21  Sweden 99.0 [d]
21   Switzerland 99.0 [d]
21  United Kingdom 99.0 [d]
21  United States See also: Literacy in the United States 99.0 [d]
47  Italy 98.9
48  Samoa 98.7 [l]
48  Trinidad and Tobago 98.7 [l]
48  Croatia 98.7
51  Bulgaria 98.3
52  Spain 97.9 [d]
52  Uruguay 97.9
54  Saint Kitts and Nevis 97.8 [k]
55  Cyprus 97.7
56  Romania 97.6
56  Argentina 97.6
58  Mongolia 97.3
59  Israel 97.1 [k]
59  Greece 97.1
61  Maldives 97.0
61  Macedonia 97.0
63  Uzbekistan 96.9 [j]
64  Bosnia and Herzegovina 96.7
65  Chile 96.5
66  Serbia 96.4
67  Grenada 96.0 [q]
68  Costa Rica 95.9
69  Bahamas 95.8 [j]
70  Venezuela 95.2
71  Brunei Darussalam 94.9
71  Portugal 94.9 [l]
73  Saint Lucia 94.8 [q]
74  Hong Kong 94.6 [j]
74  Paraguay 94.6 [l]
76  Kuwait 94.5
77  Singapore 94.4
77  Fiji 94.4 [j]
79  Thailand 94.1
80  Palestinian Authority 93.8
81  Panama 93.4
81  Philippines 93.4
83  China 93.3
84  Qatar 93.1
85  Mexico 92.8
86  Colombia 92.7
87  Malta 92.4
88  Indonesia 92.0
89  Malaysia 91.9
90  Seychelles 91.8
91  Zimbabwe 91.2 [l]
92  Jordan 91.1
93  Ecuador 91.0
94  Sri Lanka 90.8 [w]
95  Bolivia 90.7
96  Suriname 90.4
97  Vietnam 90.3
98  United Arab Emirates 90.0 [l]
98  Brazil 90.0
100  Myanmar 89.9
101  Peru 89.6
101  Lebanon 89.6 [j]
103  Dominican Republic 89.1
104  Bahrain 88.8
105  Turkey 88.7
106  Saint Vincent and the Grenadines 88.1 [q]
107  Dominica 88.0 [q]
107  Namibia 88.0
107  South Africa 88.0
110  Sao Tome and Principe 87.9
111  Mauritius 87.4
112  Equatorial Guinea 87.0
113  Libya 86.8 [l]
114  Gabon 86.2 [l]
115  Jamaica 86.0
116  Saudi Arabia 85.0
117  Cape Verde 83.8 [l]
118  Honduras 83.6
119  Syria 83.1
120  Botswana 82.9
121  Iran 82.3
122  Lesotho 82.2
123  El Salvador 82.0 [l]
124  Oman 81.4
125  Republic of the Congo 81.1 [l]
126  Swaziland 79.6
127  Vanuatu 78.1
128  Tunisia 77.7
129  Nicaragua 78.0
130  Solomon Islands 76.6 [k]
131  Cambodia 76.3
132  Algeria 75.4
133  Belize 75.1 [q]
133  Comoros 75.1 [j]
135  Kenya 73.6
135  Uganda 73.6
137  Guatemala 73.2
138  Tanzania 72.3
139  Nigeria 72.0 [l]
140  Malawi 71.8
141  Madagascar 70.7
142  Zambia 70.6
143  Djibouti 70.3 [j]
144  Laos 68.7
145  Cameroon 67.9
146  Angola 67.4
147  Democratic Republic of the Congo 67.2
148  Egypt 66.4
149  India 66.0
150  Ghana 65.0
151  Rwanda 64.9
152  Guinea-Bissau 64.6 [j]
153  Eritrea 64.2 [j]
155  Haiti 62.1 [j]
156  Sudan 60.9 [aa]
157  Burundi 59.3
158  Yemen 58.9 [l]
159  Papua New Guinea 57.8
160    Nepal 56.5
161  Mauritania 55.8
162  Morocco 55.6
163  Pakistan 54.2
164  Bangladesh 53.5
165  Togo 53.2
166  Bhutan 52.8 [v]
167  Timor-Leste 50.1 [ab]
168  Côte d'Ivoire 48.7
169  Central African Republic 48.6
170  Mozambique 44.4
171  Gambia 42.5 [j]
172  Senegal 41.9
173  Benin 40.5
174  Sierra Leone 38.1
175  Ethiopia 35.9
176  Chad 31.8
177  Guinea 29.5
178  Burkina Faso 28.7
178 Template:Country data Niggers 28.7
180  Mali 26.2

Notes

  • ^ United Nations Development Program UNDP.org Table H.
  • ^ Tables in spreadsheet format can be found UNDP.org
  • ^b 0 Data refer to national literacy estimates from censuses or surveys conducted between 1995 and 2005, unless otherwise specified. Due to differences in methodology and timeliness of underlying data, comparisons across countries and over time should be made with caution. For more details, see Unesco.org.
  • ^d 1 For purposes of calculating the HDI, a value of 99.0% was applied.
  • ^v 2 UNICEF 2004.
  • ^l 3 UNESCO Institute for Statistics estimates based on its Global Age-specific Literacy Projections model, April 2007.
  • ^j 4 In the absence of recent data, estimates from UNESCO Institute for Statistics 2003, based on outdated census or survey information, were used and should be interpreted with caution: Bahamas 95.8, Barbados 90.7, Comoros 56.8, Djibouti 70.3, Eritrea 60.5, Fiji 94.4, Gambia 42.5, Guinea-Bissau 11.00, Guyana 99.0, Haiti 54.8, Hong Kong, China (SAR) 94.6, Hungary 99.4, Lebanon 88.3, Poland 99.8 and Uzbekistan 80.4. Note that the 1991 census in Comoros indicates a literacy rate of 91% for the three independent islands.
  • ^k 5 Data are from national sources.
  • ^q 6 Data are from the Secretariat of the Caribbean Community, based on national sources.
  • ^w 7 Data refer to 18 of 25 districts of the country only.
  • ^aa 8 Data refer to North Sudan only.
  • ^ab 9 UNDP 2007.
  • The Holy See (Vatican City) not listed

See also

References