
Busiest airports by continent
The busiest airports by continent is based on the busiest airports in all continents except Antarctica and Oceania. The rankings are judged on 2014, 2015 and 2016 statistics.
Busiest airports in Europe, 2016
Busiest airports in Asia, 2016
| 2016 rank | Airport | City | Country | Code (IATA/ICAO) | Total passengers | 2015–2016 traffic evolution |
|---|---|---|---|---|---|---|
| 1. | Beijing | China, People's Republic of | PEK/ZBAA | 94,393,000 | ||
| 2. | Dubai | United Arab Emirates | DXB/OMDB | 83,654,250 | ||
| 3. | Tokyo | Japan | HND/RJTT | 79,520,000 | ||
| 4. | Hong Kong | Hong Kong, China | HKG/VHHH | 70,502,000 | ||
| 5. | Shanghai | China, People's Republic of | PVG/ZSPD | 65,982,100 | ||
| 6. | Guangzhou | China, People's Republic of | CAN/ZGGG | 59,780,000 | ||
| 7. | Singapore | Singapore | SIN/WSSS | 58,698,000 | ||
| 8. | Seoul | Republic of Korea | ICN/RKSI | 57,765,397 | ||
| 9. | Bangkok | Thailand | BKK/VTBS | 55,892,428 | ||
| 10. | Delhi | India | DEL/VIDP | 55,631,385 | ||
| 11. | Jakarta | Indonesia | CGK/WIII | 54,145,000 | ||
| 12. | Kuala Lumpur | Malaysia | KUL/WMKK | 52,620,000 | ||
| 13. | Chengdu | China, People's Republic of | CTU/ZUUU | 46,039,000 | ||
| 14. | Mumbai | India | BOM/VABB | 44,978,526 | ||
| 15. | Taipei | China, Republic of | TPE/RCTP | 42,296,322 | ||
| 16. | Kunming | China, People's Republic of | KMG/ZPPP | 41,980,300 | ||
| 17. | Shenzhen | China, People's Republic of | SZX/ZGSZ | 41,975,000 | ||
| 18. | Shanghai | China, People's Republic of | SHA/ZSSS | 40,452,900 | ||
| 19. | Manila | Philippines | MNL/RPLL | 39,516,782 | ||
| 20. | Tokyo | Japan | NRT/RJAA | 39,053,652 | ||
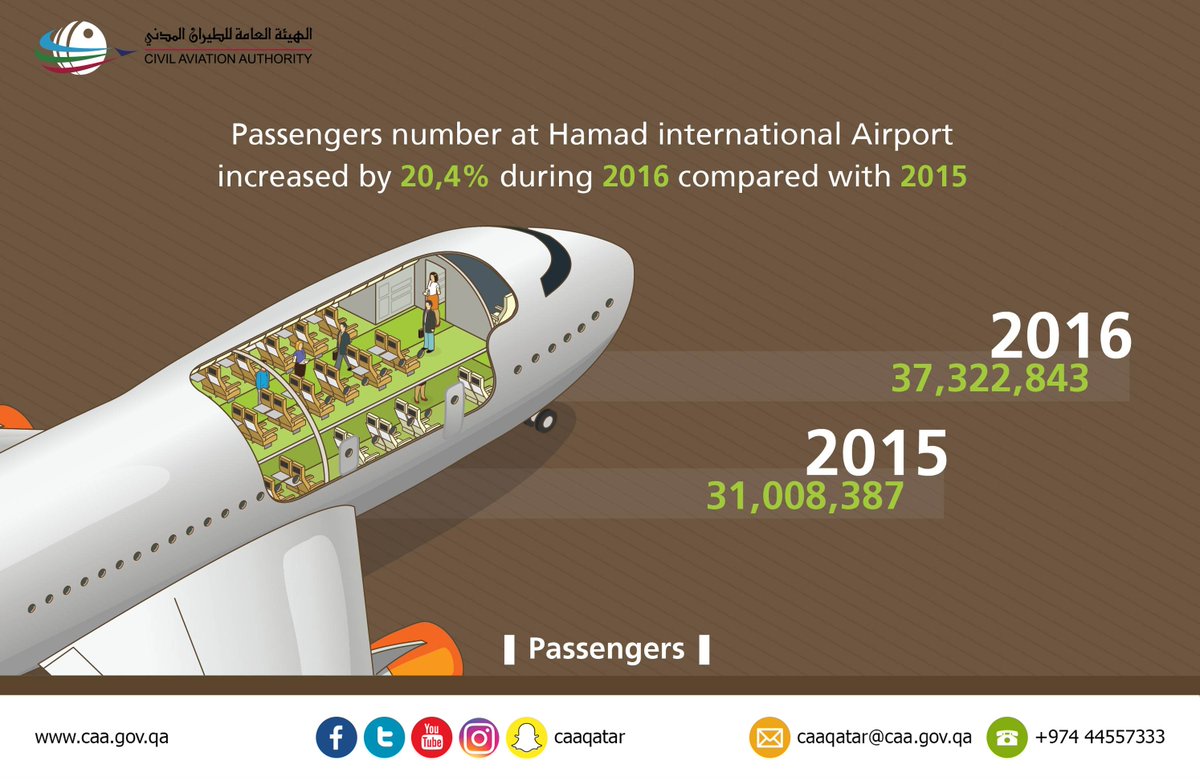
| 21. | Doha | Qatar | DOH/OTHH | 37,322,843 | ||
| 22. | Xi'an | China, People's Republic of | XIY/ZLXY | 36,994,300 | ||
| 23. | Chongqing | China, People's Republic of | CKG/ZUCK | 35,888,800 | ||
| 24. | Bangkok SGD | Thailand | DMK/VTBD | 35,203,757 | ||
| 25. | Ho Chi Minh City | Vietnam | SGN/VVTS | 32,486,537 | ||
| 26. | Hangzhou | China, People's Republic of | HGH/ZSHC | 31,595,000 | ||
| 27. | Jeddah | Saudi Arabia | JED/OEJN | 31,003,000 | ||
| 28. | Jeju | Republic of Korea | CJU/RKPC | 29,707,364 | ||
| 29. | Abu Dhabi | United Arab Emirates | AUH/OMAA | 25,964,178 | ||
| 30. | Greater Osaka Area | Japan | KIX/RJBB | 25,232,279 | ||
| 31. | Seoul | Republic of Korea | GMP/RKSS | 25,043,088 | ||
| 32. | Xiamen | China, People's Republic of | XMN/ZSAM | 22,737,000 | ||
| 33. | Nanjing | China, People's Republic of | NKG/ZSNJ | 22,358,100 | ||
| 34. | Riyadh | Saudi Arabia | RUH/OERK | 22,300,000 | ||
| 35. | Bangalore | India | BLR/VOBL | 22,187,841 | ||
| 36. | Changsha | China, People's Republic of | CSX/ZGHA | 21,296,700 | ||
| 37. | Fukuoka | Japan | FUK/RJFF | 20,968,463 | ||
| 38. | Wuhan | China, People's Republic of | WUH/ZHHH | 20,771,000 | ||
| 39. | Zhengzhou | China, People's Republic of | CGO/ZHCC | 20,760,000 | ||
| 40. | Qingdao | China, People's Republic of | TAO/ZSQD | 20,660,000 | ||
| 41. | Hanoi | Vietnam | HAN?VVNB | 20,596,632 | ||
| 42. | Sapporo | Japan | CTS/RJCC | 20,461,531 | ||
| 43. | Ürümqi | China, People's Republic of | URC/ZWWW | 20,200,800 | ||
| 44. | Denpesar | Indonesia | DPS/WADD | 19,986,415 | ||
| 45. | Surabaya | Indonesia | SUB/WARR | 19,483,844 | ||
| 46. | Haikou | China, People's Republic of | HAK/ZJHK | 18,803,800 | ||
| 47. | Naha | Japan | OKA/ROAH | 18,336,030 | ||
| 48. | Central District | Israel | TLV/LLBG | 17,936,810 | ||
| 49. | Chennai | India | MAA/VOMM | 17,733,375 | ||
| 50. | Sanya | China, People's Republic of | SYX/ZJSY | 17,370,000 |
Busiest airports in North America, 2015
Busiest airports in South America, 2013
Busiest airports in Africa, 2017
| 2014 rank | Country | Airport | City | Annual passengers |
|---|---|---|---|---|
| 1 | O. R. Tambo International Airport | Johannesburg | 21,231,510[48] | |
| 2 | Cairo International Airport | Cairo | 16,400,000[49] | |
| 3 | Cape Town International Airport | Cape Town | 10,752,246[48] | |
| 4 | Mohammed V International Airport | Casablanca | 9,357,427[50] | |
| 6 | Addis Ababa Bole International Airport | Addis Ababa | 8,700,000[49] | |
| 7 | Houari Boumediene Airport | Algiers | 7,500,000[49] | |
| 8 | Jomo Kenyatta International Airport | Nairobi | 7,000,000[51] | |
| 5 | Murtala Muhammed International Airport | Lagos | 6,360,000[52] | |
| 9 | Sharm el-Sheikh International Airport | Sharm el-Sheikh | 6,239,021[49] | |
| 10 | Tunis-Carthage Airport | Tunis | 5,146,000[51] |
Busiest airports in the world, 2016
See also
Continents
- List of the busiest airports in Africa
- List of the busiest airports in Asia
- List of the busiest airports in Europe
- List of the busiest airports in North America
- List of the busiest airports in South America
Regions
- List of the busiest airports in the Arab states of Persian Gulf
- List of the busiest airports in the Balkans
- List of the busiest airports in the Baltic states
- List of the busiest airports in the Caribbean
- List of the busiest airports in Central America
- List of the busiest airports in Latin America
- List of the busiest airports in the Nordic countries
Rankings
- List of busiest airports by aircraft movements
- List of busiest airports by cargo traffic
- List of busiest airports by international passenger traffic
- List of busiest airports by passenger traffic
References
- ^ a b c d e f g h i j k l m n o p q r s t u v w x y z aa ab "UK Airport Data". UK Civil Aviation Authority. Retrieved 2017-03-11.
- ^ a b c d e f g h i j "Paris Partners: 'Les pactes d'amitié et de coopération'". Mairie de Paris. Retrieved December 1, 2008.
- ^ a b Amsterdam Transport and Traffic statistics
- ^ a b c d e f g h i j k l m n o p q r German Airport Statistics
- ^ a b c d e f g h i j k l m n o p q r s t u v w x y z Spain AENA Airport Statistics
- ^ a b c d e f g h i j k l m n o p q r s t u v Italian Airport Statistics
- ^ a b c d e f g h i j k l Russia airport statisticTemplate:Ru icon
- ^ a b Sabiha Gökçen Airport Traffic Report
- ^ a b Copenhagen Airport Traffic Statistics
- ^ Dublin Airport Annual Reports
- ^ a b c d e f g h Anna.aero - European Airport Traffic Trends
- ^ a b Zürich Statistical yearbook
- ^ a b c d Norwegian AVINOR Airport Statistics
- ^ a b c d Swedich Airport Statistic
- ^ a b Vienna Airport Statistics
- ^ a b c Portugal Airport Statistics
- ^ http://www.presstur.com/empresas---negocios/aviacao/aeroporto-de-lisboa-atingiu-22449-milhoes-de-passageiros-de-voos-comerciais-em-2016/
- ^ a b "Brussels Capital-Region". Georges Picavet. 4 June 2005. Retrieved 4 August 2008.
- ^ a b AIA traffic statistics
- ^ a b Fraport traffic figures
- ^ a b Geneva Airport Statistics
- ^ a b Prague Airport Reports
- ^ Poland Airports Statistic 2014-2015
- ^ http://www.pasazer.com/news/32962/lotnisko,chopina,rekordowy,2016.html
- ^ a b Nice Airport Statistics
- ^ Budapest airport statistic
- ^ Aeroporturi București rapoarte anualeTemplate:Ro icon
- ^ https://boardingpass.ro/record-de-pasageri-pe-aeroporturile-din-bucuresti-1099-milioane-de-pasageri-in-2016
- ^ a b c d e f g h Cite error: The named reference
Francewas invoked but never defined (see the help page). - ^ https://aeroportodoporto.wordpress.com/estatisticas-2016/
- ^ МА Борисполь отчитался о рекордных показателяхTemplate:Ru icon
- ^ a b Toulouse Airport Statistics
- ^ https://www.turisver.com/35-me-ampliar-remodelar-aeroporto-faro
- ^ a b EuroAirport key figures
- ^ a b Charleroi Airport Statistics
- ^ a b c Greece Airport Statistics
- ^ a b Keflavik Passenger Statistics
- ^ a b Cyprus Airport Statistics
- ^ a b DHMI Turkish Airports Statistics
- ^ a b Riga Airport Statistics
- ^ a b Malta Airport Annual Statistics
- ^ a b Krakow airport basic data
- ^ a b Sofia Airport 2016
- ^ a b Belgrade Traffic Figures
- ^ a b c d e f g h i j k l m n o p q r s t u v w x y z aa ab ac ad ae af ag ah ai aj ak al "2015 North American (ACI-NA) Top 50 airports (includes Passenger, Cargo and Movements)" (Excel). Airports Council International, North America. Retrieved August 23, 2016.
- ^ a b "Estadística Operacional de Aeropuertos / Airports Operational Statistics". DGAC, Secretaría de Comunicaciones y Transportes. Retrieved February 2, 2016.
- ^ a b Airports Company South Africa Statistics
- ^ a b c d Jeune Afrique
- ^ Morocco Airport Statistics
- ^ a b http://www.howtodiys.com/jomo-kenyatta-international-airport-jkia/
- ^ Nigeria Airport Statistics
- ^ "Year-to-date Airport Traffic Report" (PDF). Hartsfield-Jackson Atlanta International Airport. 2017-02-02. Retrieved 2017-02-19.
- ^ a b c d e f g 2016年民航机场吞吐量排名. Civil Aviation Administration of China. 2017-02-24. Retrieved 2017-02-28.
- ^ "Dubai International Airport Factsheet". Dubai Airports. Retrieved 2017-02-19.
- ^ "Los Angeles International Airport Traffic Comparison Calendar YTD January to December 2016" (PDF). Los Angeles World Airports. 2017-01-25. Retrieved 2017-02-19.
- ^ 2016年(平成28年)空港利用者数ランキング(日本). Japan Biz. 2017-02-09. Retrieved 2017-02-19.
- ^ "Monthly Operations, Passengers, Cargo Summary by Class. December 2016" (PDF). O’Hare International Airport. 2017-01-20. Retrieved 2017-02-19.
- ^ "Finalized Civil International Air Traffic Statistics at HKIA. Year 2016" (PDF). Hong Kong International Airport. Retrieved 2017-03-06.
- ^ "UK Airport Data". Paris Airports Statistics. Retrieved 2017-02-19.
- ^ "DFW Total Passengers. December 2016" (PDF). O’Hare International Airport. 2017-02-03. Retrieved 2017-02-19.
- ^ "Amsterdam Transport and Traffic statistics". Amsterdam Airport Schiphol. Retrieved 2017-02-19.
- ^ a b "ADV German Airport Statistics". Flughafenverband ADV. Retrieved 2017-02-19.
- ^ "DHMI Turkish Airports Statistics". Devlet Hava Meydanları İşletmesi. Retrieved 2017-02-19.
- ^ "JFK December 2016 Traffic Report" (PDF). The Port Authority of New York and New Jersey. 2017-02-13. Retrieved 2017-02-19.
- ^ "Annex A - Passenger, airfreight and aircraft movement statistics for 2016". Changi Airport Group. 2017-01-30. Archived from the original on 2016-01-27. Retrieved 2017-02-28.
{{cite web}}: Unknown parameter|deadurl=ignored (|url-status=suggested) (help) - ^ "Total Operations and Traffic. December 2016" (PDF). Denver International Airport. Retrieved 2017-03-06.
- ^ "Airport Statistics". Incheon Airport. Retrieved 2017-02-19.
- ^ "AOT Air Traffic Calendar Year 2016" (PDF). Airports of Thailand PLC. 2017-01-23. Retrieved 2017-02-19.
- ^ "AAI Traffic News. Calendar Year 2016". Airports Authority of India. Retrieved 2017-02-19.
- ^ "Lalu Lintas Angkutan Udara". Direktorat Jenderal Perhubungan Udara. Retrieved 2017-02-19.
- ^ "SFO Shatters Annual Traffic Record with 53.1 Million Passengers in 2016". San Francisco International Airport. 2017-01-31. Retrieved 2017-02-19.
- ^ "Traffic Snapshot" (PDF). Malaysia Airports Holdings Berhad. Retrieved 2017-03-06.
- ^ a b "Estadísticas de Tráfico Aéreo". AENA. Retrieved 2017-02-19.
- ^ "2016 Enplaned and Deplaned Passengers" (PDF). McCarran International Airport. 2017-01-18. Retrieved 2017-02-19.
- ^ "December 2016 Airport Statistics". Port of Seattle. Retrieved 2017-02-19.
- ^ "AAI Traffic News. Calendar Year 2016". Airports Authority of India. Retrieved 2017-02-19.
- ^ "Traffic Report Twelve Month Ended: December 31, 2016". Miami International Airport. Retrieved 2017-02-19.
- ^ "Aviation Activity for December 2016" (PDF). Charlotte Douglas International Airport. Retrieved 2017-02-19.
- ^ "Traffic Summary as of December 2016". Greater Toronto Airports Authority. 2017-01-10. Retrieved 2017-02-19.
- ^ "Monthly Statistical Reports-December 2016" (PDF). Sky Harbor International Airport. Retrieved 2017-02-19.
- ^ 表3 民航運輸各機 (PDF). Civil Aviation Authority MOTC ROC. Retrieved 2017-02-19.
- ^ "Airline Activity Report. Calendar Year 2016". Orlando International Airport. Retrieved 2017-02-19.
- ^ "Sydney Airport Traffic Performance December 2016" (PDF). Sydney Airport. 2017-01-20. Retrieved 2017-02-19.
- ^ "ADV German Airport Statistics". Assaeroporti. Retrieved 2017-02-19.
- ^ "Estadísticas del AICM a Diciembre de 2016" (PDF). Mexico City International Airport. Retrieved 2017-02-19.
- ^ "Department of Aviation Monthly Statistical Summary Report for December 2016" (PDF). Houston Airport System. Retrieved 2017-02-19.
- ^ "EWR December 2016 Traffic Report" (PDF). The Port Authority of New York and New Jersey. 2017-02-13. Retrieved 2017-02-19.
- ^ "NAIA Congestion Alarms Govt". The Manila Times. 2017-02-16. Retrieved 2017-02-19.
- ^ "Narita Airport Traffic Statistics 2016 (Jan-Dec)" (PDF). Narita International Airport Corporation. Retrieved 2017-02-19.
- ^ "IAD by the Numbers". Washington Metropolitan Airports Commission. 2017-02-13. Retrieved 2017-02-19.
- ^ "Passenger Numbers at Hamad International Airport". Civil Aviation Authority of the State of Qatar. Retrieved 2017-02-19.